Figure 1 Study flow chart.
DOI: https://doi.org/10.4414/smw.2021.20405
Multimorbidity poses an increasing socioeconomic challenge to governments and healthcare providers worldwide [1, 2]. Concomitant with the ageing population, multimorbidity puts a strain on available resources and traditional healthcare patterns [3, 4]. A population ageing and care simulation model estimated that the proportion of patients with more than four conditions will almost double by 2035 [5]. This prospect gives a presentiment of the upcoming healthcare burden and is, albeit slowly, receiving attention from healthcare providers and politicians.
Multimorbidity is defined as the co-occurrence of two or more chronic health conditions [6, 7]. This definition was intended for public health and study purposes, detached from clinical relevance. Nevertheless, it is an important prerequisite to conducting standardised research. As previous research on multimorbidity significantly varies in methodology [3], current data on prevalence and burden of multimorbidity is heterogeneous. Remaining inconsistencies in definition, terminology and research on multimorbidity impede integrative understanding of the topic.
From a clinician’s perspective, multimorbidity is an ill-defined phenomenon, yet seen daily. However, medical research, education and healthcare delivery are mostly dominated by single-disease concepts [8–10]. Risk of morbidity, mortality, hospitalisation, disability, adverse drug events, duplicative tests and conflicting medical advice was shown to increase with every additional chronic condition [11–13]. Consequently, the awareness of multimorbidity and its impact on different healthcare outcomes in the in-hospital setting is of growing importance. To correctly address the main challenges posed by multimorbidity, only a comprehensive understanding of its consequences will allow a solution-oriented approach, practicable for all involved stakeholders.
Thus, we first aimed to illustrate the overall and age-dependent prevalence of in-hospital multimorbidity in a medical population-based cohort. Our second aim was to investigate the age-stratified burden of multimorbidity and number of chronic conditions in terms of in-hospital mortality, length of hospital stay (LOS), intensive care unit (ICU) admission, 30-day, and 1-year readmission rates. We hypothesised an increasing prevalence of multimorbidity in medical cases over the 6-year study period. Moreover, we expected multimorbidity, as well as an increasing number of chronic health conditions, to be associated with a higher incidence of worse healthcare outcomes independent of age.
This study followed the statement of the Strengthening the Reporting of Observational Studies in Epidemiology (STROBE) guidelines for cohort studies. Institutional review board approval, including waiver of the requirement for participant informed consent, as the data were de-identified, was provided by the institutional review board of Northwestern Switzerland (AG/SO 2009/074 and EKNZ BASEC PB_2017-00449).
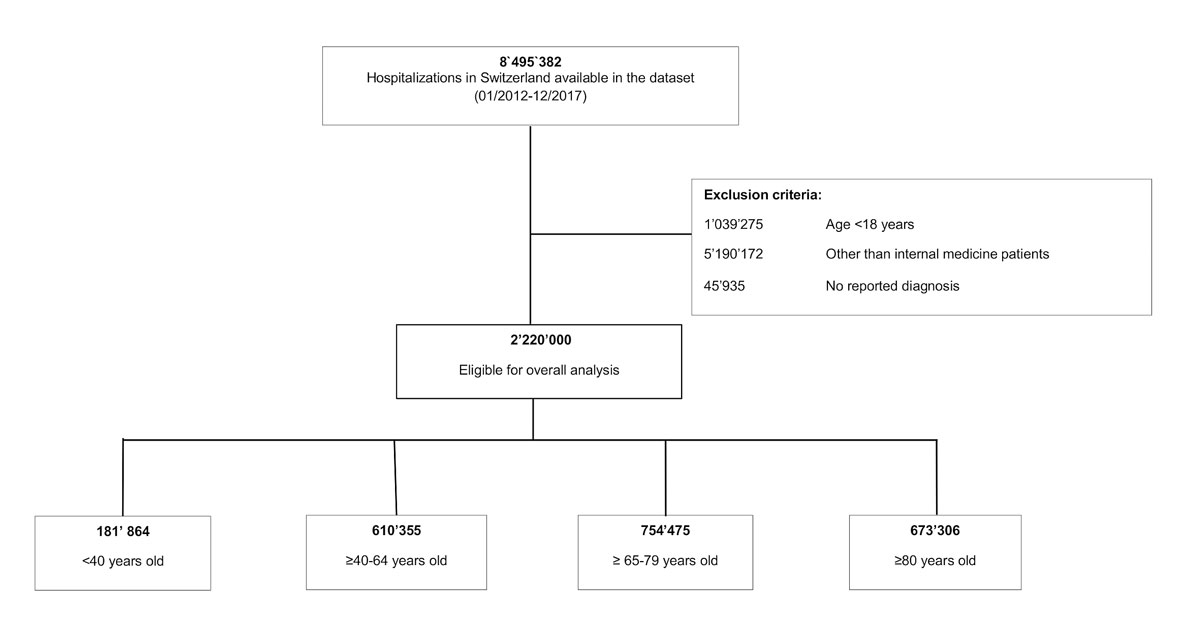
This nationwide population-based cross-sectional study analysed administrative data collected by the Federal Statistical Office of Switzerland from 1 January 2012 to 31 December 2017. The dataset included a total of 8,495,382 de-identified Swiss inpatient discharge records from acute care, general and specialised clinics except for post-acute care with information on hospitalisation, patients’ and hospital characteristics including ICD-10 (International Classification of Diseases, tenth revision, German Modification) codes of all diagnoses reported in the discharge letter. The database reflects information captured for billing purposes at hospital level by trained medical coders according to national guidelines, with the same underlying reimbursement system over the whole timeframe investigated, and thus was a representative dataset for virtually all hospitalisations in private and public hospitals across Switzerland.
We selected all adult medical inpatient discharge records from the full spectrum of secondary to tertiary care with at least one reported diagnosis, resulting in a total of 2,220,000 index hospitalisations for further analysis (see fig. 1 below). The Federal Statistical Office defined hospitals affiliated with a university and all hospitals serving as primary representative to provide care for a canton (26 government-assigned regions of Switzerland) as tertiary care hospitals and all smaller hospitals as secondary care. An index hospitalisation was defined in accordance with the SwissDRG as an admission including all consecutive readmissions into the same hospital within 18 days after the initial discharge. All admissions after 18 days from initial discharge or admissions into another hospital were evaluated as another index hospitalisation and therefore registered in the dataset as a new case. Consequently, 1,018,206 (69.6%) of the 1,463,781 patients were hospitalised once, 277,972 (19.0%) twice and 167,603 (11.4%) three times or more. The readmission rate analysis for every case was based on the information encoded as “days to next hospitalisation”, which was available even if the readmission did not generate a new case.
Medical cases were defined as encoded by the Federal Statistical Office. Thus, gynaecology and obstetrics, paediatrics, ophthalmology, non-medical intensive care, otolaryngology, surgery, psychiatry, dermatology and venereology, radiology, rehabilitation and emergency centre patient records were excluded.
Multimorbidity was defined according to the World Health Organization (WHO) as the presence of at least two chronic conditions [6]. We applied the “Chronic Condition Indicator (CCI) for the International Classification of Diseases (ICD-10-CM)” to distinguish between chronic and acute conditions, based on ICD-10 codes. The CCI was developed as part of the Healthcare Cost and Utilization Project (HCUP), a Federal-State-Industry partnership sponsored by the Agency for Healthcare Research and Quality (AHRQ) in the United States of America [14]. It was designed to facilitate healthcare research using administrative data. It is publicly accessible and undergoes annual updates. For this analysis, the 2019.1 version was used. The CCI divides all ICD-10-CM codes into two categories: chronic or acute. To qualify as “chronic”, a condition has to last 12 months or longer and meet at least one of the following criteria: placing limitations on self-care, independent living and social interactions and/or need for ongoing intervention with medical products, services or special equipment [14]. In the case of an inconsistency between the ICD-10 codes of the CCI with American ICD-10 coding standard and the Swiss database records, we chose the most representative code with the highest resemblance to merge the ICD-10 codes of the CCI with the ICD-10 codes of the database records.
We analysed time- and age-dependent prevalence of in-hospital multimorbidity, as well as the median number of chronic conditions (MCC) on a continuous scale to illustrate the extent and time trend of inpatient multimorbidity in medical cases in Switzerland.
To investigate the overall and age-dependent burden of multimorbidity among hospitalised medical cases, we defined the following outcomes. The primary outcome was all-cause in-hospital mortality. Secondary outcomes were LOS, ICU admission (binary coded), and 30-day, and 1-year all-cause readmission rates. The definition of all-cause readmission was based on the information “days to the next hospitalisation”, which was recorded once for every single case. From this, we created binary variables for 30-day and 1-year readmission for every case. All outcome analyses were conducted on discharge record level. Data for ICU admission was missing for 0.12% and for readmission rates in 0.016% of the cases. Missing variables were considered as no event. No data concerning mortality and LOS were missing.
In terms of a better comparability with previous studies [15], we formed four age categories (<40 years, ≥40–64, ≥65–79 and ≥80 years) to further stratify our descriptive and outcome analysis.
We cross tabulated characteristics of all cases by age group. Descriptive statistics gave an overview of the overall, time- and age-dependent prevalence of in-hospital multimorbidity, as well as of the median number of chronic conditions. Associations of multimorbidity with in-hospital mortality, ICU admission, all-cause 30-day and 1-year readmission rates were assessed using a multivariable logistic regression model adjusted for age, sex, nationality, hospital size (number of hospital beds), hospital teaching status (affiliation to university), type and date (month and year) of admission, number of previous hospitalisations within the dataset – as a marker of healthcare utilisation – and insurance class (private, semiprivate or general sector). The association of multimorbidity with LOS was assessed using a linear regression model, adjusted identically as in the multivariable logistic regression model. Previous analysis of association of every age from 18 to 100 with every outcome showed no considerable loss of information by forming the above-mentioned age categories. This sub-analysis can be found in the appendix (supplementary fig. S1). Using the Breslow-Day test we calculated terms of effect modification to check for age-stratified subgroup associations. We fitted adjusted regression models to investigate age-dependent associations of the number of chronic conditions with each healthcare outcome. Based on these models we calculated marginal effects and illustrated them in margins plots. We used the Mantel-Haenszel chi-square test to assess probability for trend. It reflects the departure of a linear trend from horizontal (i.e., no trend if p >0.05). Significance was based on 95% confidence intervals (CIs). Statistical analyses were performed from 1 May 2019 to 20 April 2020, using Stata, version 15.1 (StataCorp LLC).
As a reference point for the baseline characteristics of discharge records, Switzerland had 8,484,130 residents in 2017, 49.6% were male with a life expectancy of 85.4 years for female and 81.4 years for male residents. Approximately 46% were <40 years old, 35% were 40–64 years old and 19% were ≥65 years old; 66,971 residents died and 117.6 out of 1000 residents were hospitalised [16].
Of the 2,220,000 analysed cases, 51.3% were male, the mean age was 68.0 years, 82.7% were Swiss citizens, 72.0% were emergency admissions and 73.9% were treated in a tertiary care hospital (fig. 1). Based on our definition, a total of 79.7% of cases were multimorbid with a median number of chronic conditions (MCC) of 4 (interquartile range [IQR] 2–6). The most prevalent chronic conditions were cardiovascular diseases (63.6%), mental disorders (25.8%) and renal diseases (19.9%), among others. The proportion of emergency admissions was higher overall in non-multimorbid cases. Only the oldest age category (≥80 years) showed slightly higher emergency admission rates in multimorbid cases (78.4% versus 75.8% in non-multimorbid cases).
Figure 1 Study flow chart.
Table 1 presents all baseline characteristics stratified by age group.
Table 1 Characteristics of medical inpatient discharge records.
| Total | <40 years | ≥40–64 years | ≥65–79 years | ≥80 years | |
|---|---|---|---|---|---|
| Number of discharge records | 2,220,000 | 181,864 | 610,355 | 754,475 | 673,306 |
| Age, mean (SD) | 68.0 (17.4) | 29.4 (6.4) | 54.3 (6.8) | 72.5 (4.3) | 85.8 (4.3) |
| Male sex, n (%) | 1,139,453 (51.3) | 90,216 (49.6) | 354,158 (58.0) | 411,778 (54.6) | 283,301 (42.1) |
| Swiss resident, n (%) | 1,836,651 (82.7) | 118,668 (65.3) | 458,153 (75.1) | 645,274 (85.5) | 614,556 (91.3) |
| Tertiary care hospital, n (%) | 1,640,178 (73.9) | 132,775 (73.0) | 454,038 (74.4) | 559,469 (74.2) | 493,896 (73.4) |
| Number of discharge records per patient, n (%) | |||||
| – 1 | 1,018,141 (45.9) | 112,423 (61.8) | 304,304 (49.9) | 320,929 (42.5) | 280,485 (41.7) |
| – 2 | 555,998 (25.0) | 33,905 (18.6) | 140,740 (23.1) | 192,421 (25.5) | 188,932 (28.1) |
| – 3–5 | 524,728 (23.6) | 24,990 (13.7) | 127,498 (20.9) | 195,880 (26.0) | 176,360 (26.2) |
| – 6–10 | 108,517 (4.9) | 7,889 (4.3) | 33,259 (5.4) | 41,481 (5.5) | 25,888 (3.8) |
| – >10 | 12,616 (0.6) | 2,657 (1.5) | 4,554 (0.7) | 3,764 (0.5) | 1,641 (0.2) |
| Cardiovascular disease*, n (%) | 1,412,749 (63.6) | 20,857 (11.5) | 290,075 (47.5) | 552,754 (73.3) | 549,063 (81.5) |
| Malignancy/cancer*, n (%) | 322,952 (14.5) | 13,076 (7.2) | 98,430 (16.1) | 139,855 (18.5) | 71,591 (10.6) |
| Diabetes*, n (%) | 378,945 (17.1) | 6,772 (3.7) | 82,534 (13.5) | 166,647 (22.1) | 122,992 (18.3) |
| Renal disease*, n (%) | 441,682 (19.9) | 5,595 (3.1) | 49,099 (8.0) | 151,354 (20.1) | 235,634 (35.0) |
| HIV, tuberculosis and hepatitis B,C*, n (%) |
13,858 (0.6) | 1947 (1.1) | 8759 (1.4) | 2382 (0.3) | 770 (0.1) |
| Gastrointestinal disorder*, n (%) | 277,028 (12.5) | 14,997 (8.2) | 82,739 (13.6) | 101,174 (13.4) | 78,118 (11.6) |
| Musculoskeletal disorder*, n (%) | 281,973 (12.7) | 7775 (4.3) | 50,379 (8.3) | 100,421 (13.3) | 123,398 (18.3) |
| Respiratory disease*, n (%) | 285,312 (12.9) | 8811 (4.8) | 62,850 (10.3) | 124,136 (16.5) | 89,515 (13.3) |
| Obesity*, n (%) | 50,419 (2.3) | 2458 (1.4) | 18,304 (3.0) | 21,273 (2.8) | 8384 (1.2) |
| Mental disorder*, n (%) | 572,859 (25.8) | 50,125 (27.6) | 165,706 (27.1) | 165,173 (21.9) | 191,855 (28.5) |
| Neurological disorder*, n (%) | 425,891 (19.2) | 26,925 (14.8) | 108,132 (17.7) | 156,757 (20.8) | 134,077 (19.9) |
| Multimorbidity, n (%) | 1,769,530 (79.7) | 71,802 (39.5) | 439,526 (72.0) | 654,749 (86.8) | 603,453 (89.6) |
| Median number of chronic conditions (IQR) |
4 (2–6) | 1 (0–2) | 3 (1–5) | 4 (2–6) | 5 (3–7) |
| Emergency admission, n (%) | 1,598,245 (72.0) | 14,1050 (77.6) | 414,484 (67.9) | 516,449 (68.5) | 526,262 (78.2) |
| – Multimorbid | 1,255,452 (70.9) | 49,153 (68.5) | 286,072 (65.1) | 446,893 (68.3) | 473,334 (78.4) |
| – Not multimorbid | 342,793 (76.1) | 91,897 (83.5) | 128,412 (75.2) | 69,556 (69.7) | 52,928 (75.8) |
HIV = human immunodeficiency virus, SD = standard deviation, IQR = interquartile range * All above listed conditions are a compilation based on the intersection of the Chronic Condition Indicator (CCI) list by the AHRQ and the ICD-codes of the corresponding diseases and thereby chronic: cardiovascular disease I00-I999, cancer C00-C97, diabetes E10-17, musculoskeletal disorder M00-99, respiratory disease J30-98, renal disease N00-N19, gastrointestinal disease K0-K93, mental disorders F00-F99, obesity E65-68, HIV, tuberculosis and hepatitis B, C B20-B24, A15-19, B15-B25, neurological disorder G00-G99
The prevalence of in-hospital multimorbidity (%) as well as the MCC (IQR) increased incrementally by each age group (<40 years: 39.5%, MCC 1 (0–2); ≥40–64 years: 72.0%, MCC 3 (1–5); ≥65–79 years: 86.8%, MCC 4 (2,–6); ≥80 years: 89.6%, MCC 5 (3–7)). However, continuous age analysis of prevalence and MCC revealed a small decrease of multimorbidity and MCC from the age of ≥90 years and ≥85 years, respectively (fig. 2 ). During the 6-year study period, multimorbidity increased by about 1.0% per year from 76.1% in 2012 to 82.2% in 2017. This increase over time was observed in every age group for both in-hospital multimorbidity and MCC (supplementary fig. S2 in the appendix ).
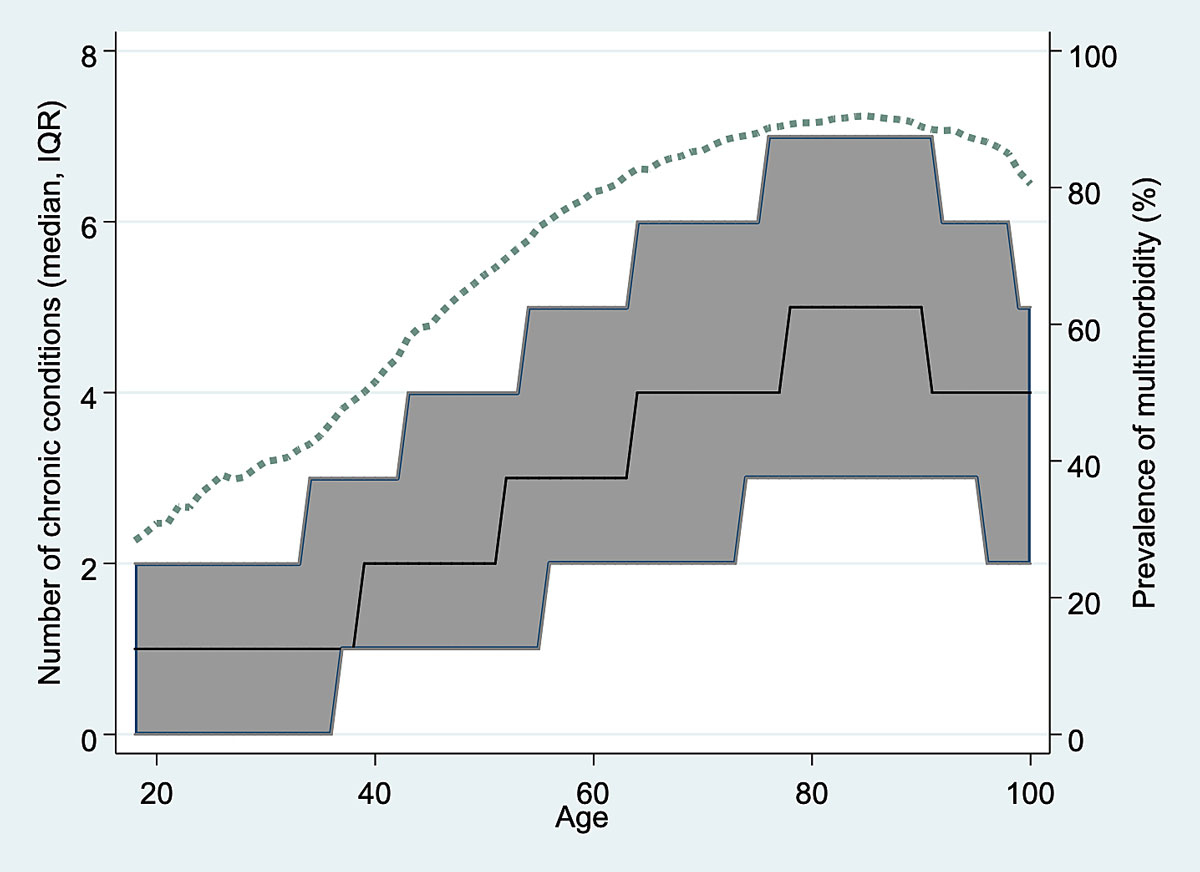
Figure 2 Age-dependent median number of chronic conditions (n, interquartile range [IQR]) and prevalence of multimorbidity (dashed line) on a continuous age scale.
The overall crude all-cause in-hospital mortality was 4.9%. Multimorbid cases had an in-hospital mortality rate of 5.5% compared with 2.8% in cases not meeting the criteria of multimorbidity (supplementary table S1 in the appendix). In multimorbid cases below 40 years of age, we found increased odds of all-cause in-hospital mortality of 8.0 compared with non-multimorbid cases in the same age category (adjusted OR 8.02, 95% CI 6.72 to 9.58). The odds gradually decreased with age to 0.72 (95% CI, 0.71 to 0.74,) in cases over the age of 80 (fig. 3 ). Analyses of association stratified by each year of age (from 18 to 100 years) did not reveal considerable loss of information by age stratification into four age categories (fig. S1. Moreover, the analysis of interaction suggested age to be an effect modifier (all p for interaction <0.001). Similar observations were made for the association of MCC with age-dependent in-hospital mortality: With increasing MCC, the younger age groups approximate the mortality rates of the ≥80-year-old cases, whereas at the age of ≥80 in-hospital mortality rate increased only slightly with growing MCC (see fig. 4A). The p-values for trend were <0.001 for all age groups.
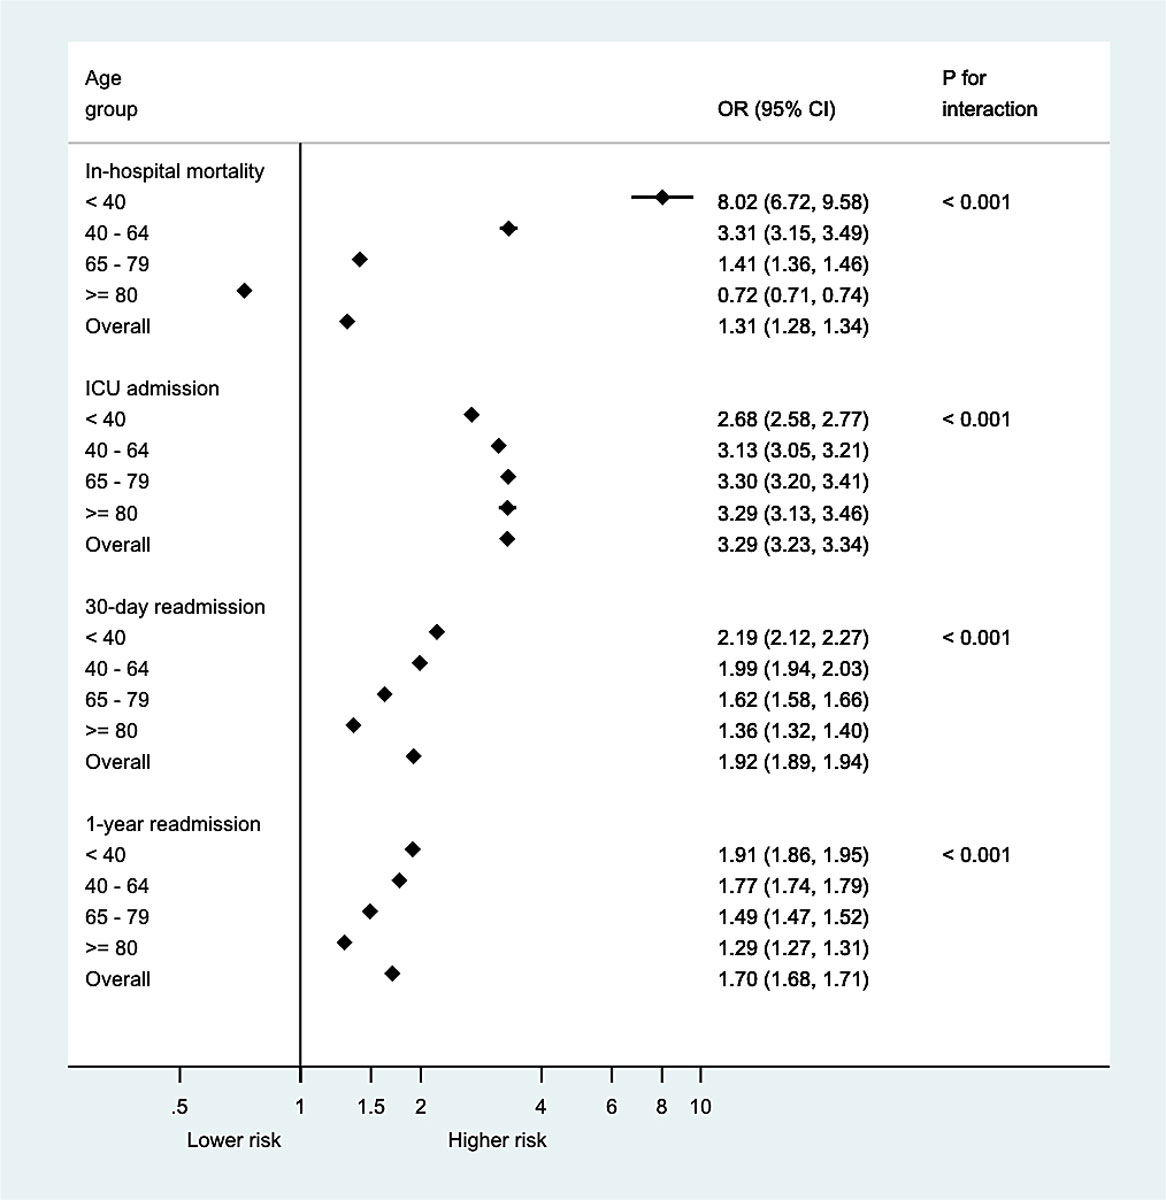
Figure 3 Odds ratios of primary and secondary outcomes, applicable for multimorbid cases, non-multimorbid cases served as reference. CI = confidence interval; OR = odds ratio.
Of all cases included, 9.6% had at least one transfer to an ICU; 10.9% of multimorbid cases were admitted to an ICU during a hospitalisation, whereas this was the case in only 4.6% of hospitalisations without multimorbidity (table S1). The odds for an ICU admission were lowest in the youngest multimorbid cases, with an adjusted OR of 2.68 (95% CI 2.58 to 2.77) compared with non-multimorbid cases below 40 years, and increased with age. The highest odds of ICU admission were in the two oldest age groups of the multimorbid: 65–79- and ≥80-year-olds, with adjusted OR 3.30, 95% CI 3.20 to 3.41 and adjusted OR 3.29, 95% CI 3.13 to 3.46, respectively (fig. 3). The Breslow-Day test supported age as an effect modifier.
Overall all-cause 30-day and 1-year readmission rates were 11.5% and 35.9%, respectively. We found higher all-cause readmission rates in multimorbid cases than in cases without multimorbidity, namely 12.7% versus 7.0% for 30-day all-cause readmissions, and 38.7% versus 24.9% for 1-year all-cause readmissions (table S1). The odds for a 30-day readmission were highest in the youngest multimorbid cases (adjusted OR 2.19, 95% CI 2.12 to 2.27) compared with non-multimorbid cases aged below 40 years. The odds decreased with growing age and were lowest in multimorbid cases above 80 years (adjusted OR 1.36, 95% CI, 1.32 to 1.40). Similarly, the odds for 1-year readmission were highest in multimorbid cases below 40 years of age (OR 1.91, 95% CI 1.86 to 1.95) and the lowest (OR 1.29, 95% CI 1.27 to 1.31) in the oldest age-group of multimorbid cases (fig. 3). The p-value for interaction supported age as an effect modifier.
The overall LOS was 8.1 days (standard deviation [SD] 13.4) with a prolonged overall LOS (8.9 days, SD 13.9) in cases with multimorbidity compared with non-multimorbid cases (4.7 days, SD 10.7) (table S1). The adjusted overall LOS in case of multimorbidity was 2.7 days (95% CI, 2.6 to 2.7) longer compared to the non-multimorbid patients. Relevant modification by age was confirmed by a p-value for interaction <0.001, ranging from +2.5 days (95% CI 2.4 to 2.6) in the oldest age group to +3.2 days (95% CI 3.1 to 3.2) in 65–79-year-olds (table S2]).
Figure 4 (B–E) shows the associations of the MCC with secondary outcomes stratified by age groups.
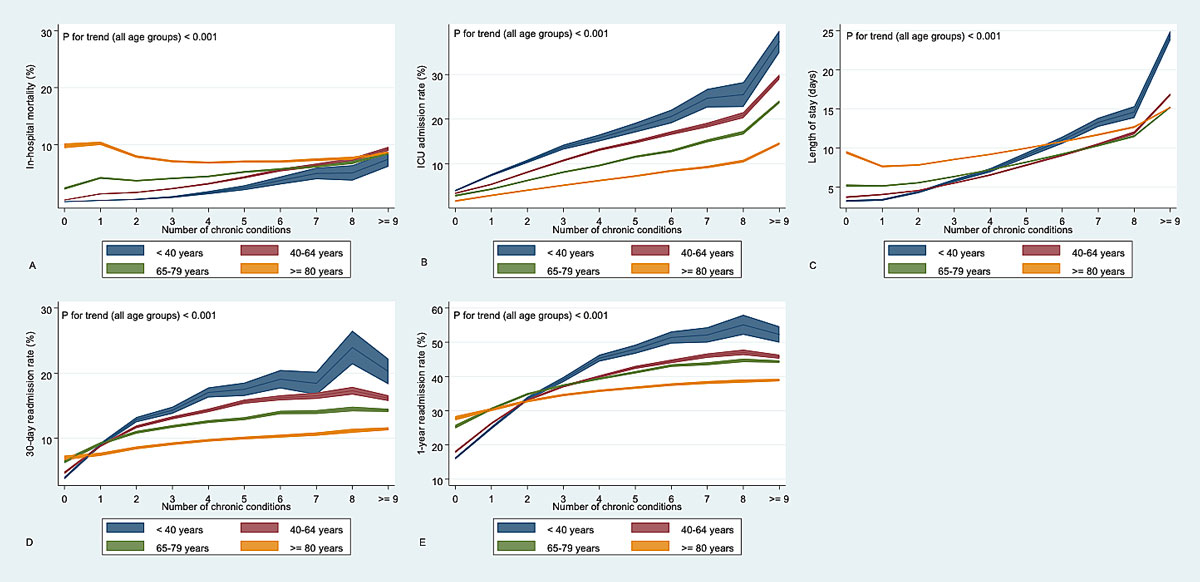
Figure 4 Odds-adjusted predictive margins for primary (A) and secondary outcomes (B-E) stratified by age groups.
This large population-based cohort study revealed two major findings. First, more than three quarters of the medical hospitalisations presented with multimorbidity, with an increasing tendency over the six years analysed, as well as with increasing age. Second, in-hospital mortality, ICU admission, LOS, and 30-day and 1-year readmission rates were higher in multimorbid cases compared with non-multimorbid cases. Importantly, younger multimorbid cases faced higher odds of increased in-hospital mortality and readmission compared with elderly ones.
Previous studies found comparable prevalence rates of multimorbidity. Sixty-seven percent of Medicare beneficiaries were found to be multimorbid (defined as ≥2 chronic conditions based on the US Department of Health and Human Services Framework), with a similar increase in multimorbidity with increasing age [3]. A recent Swiss medical inpatient cohort – including tertiary care patients only – reported a 79% multimorbidity rate, with the CCI used to define chronic conditions as in our study. However, the study stratified the chronic conditions into further comorbidity categories using the Clinical Classification Software [17]. A smaller Swiss cohort study revealed a prevalence of multimorbidity between 46.5% and 96.5%, using three different definitions of multimorbidity (≥2 diagnoses, ≥2 diagnoses from different ICD-10 chapters, ≥2 conditions defined by Charlson/Deyo) and three different data sources [15]. This wide range of prevalence becomes even more obvious when international data including further settings and definitions are compared (7.9 to 96.5%) [8, 12, 18–22]. Although increasing age was consistently associated with higher rates of multimorbidity, the extent varied in previous investigations [3, 23–26]. These heterogeneous findings emphasise the need for benchmarking and standardised methods to achieve greater comparability and allow surveillance of potential preventive and solution-oriented measures.
Our study, however, addressed the main prerequisites by using standardised definitions of multimorbidity, including all chronic conditions according to the CCI, a tool especially created for standardised research. This allowed a reduction of selection bias and analysis of comprehensive, population-based data. By inclusion of in-hospital medical cases we improved specificity, thus creating homogeneity and comparability among the investigated index hospitalisations. Furthermore, we included only hospitalisations after 31 December 2011 in our study, as a new reimbursement and coding system based on diagnosis-related group (SwissDRG) was comprehensively introduced in 2012 across Switzerland, providing a highly accurate coding standard. We observed a continuous increase in prevalence of multimorbidity in the 6-year study period, in line with previous observational studies [24, 27–31]. Nonetheless, the impact of the implementation of the Swiss-DRG reimbursement system at the beginning of the study needs to be taken into account when interpreting the increase in multimorbidity. The discharge record-based reimbursement system comes with a financial incentive for more comprehensive coding. However, we found no studies investigating the influence of newly established reimbursement systems on the prevalence of multimorbidity, except for the fact that the Charlson Comorbidity Index slightly increased after SwissDRG implementation, from 1.4 to 1.6 [32]. Nevertheless, trained medical coders supervised by independent auditors enable a high quality of coding throughout Swiss hospitals and thereby enhance the quality of the collected data. Furthermore, the increase was steady by approximately 1% per year over the 6-year study period (fig. S2 in the appendix) and not limited to the first years after the implementation. Additionally, the impact of changes in coding habits of medical coders over the 6 years, the physicians’ heterogeneous awareness of multimorbidity and intensified diagnostic measures as part of continuous improvement in medical care on the increased rate of multimorbidity remains unclear.
Analyses were adjusted for previous hospitalisations even though they may be considered a surrogate marker for multimorbidity. The adjustment for previous hospitalisations aimed to diminish the cumulative effect of considering every rehospitalisation of the same patient in the analysis. In addition, analyses were not adjusted for the number or clusters of chronic conditions, as these are a defining characteristic of multimorbidity, which itself is the variable of interest.
Evidence of the age-dependent association of multimorbidity with healthcare outcomes is scarce, whereas findings of higher mortality rates in multimorbid cases are common [33–35]. We found a marked age dependence. Whereas younger multimorbid cases faced almost eight-fold odds of in-hospital mortality compared with non-multimorbid cases in the same age category, multimorbidity seemed to have no harmful, and even a beneficial, impact on hospital mortality in cases of multimorbidity above 80 years. A study on the place of death in Switzerland found that the majority of the >80-year-olds died in long-term care facilities (n = 992), whereas fewer people died in the hospital or at home [36]. Therefore, multimorbid patients in need of long-term care are less likely to die in a hospital but rather in a long-term care facility. Furthermore, a “survivor effect” is suspected in the multimorbid elderly, which also could be associated with lower in-hospital mortality rates [37]. One recent smaller study did not find a beneficial association of multimorbidity and mortality in patients above 90 years of age; however, this study’s conclusion was limited to a few cases, chronic conditions were based on self-reports and did not undergo a standardised evaluation [38]. The association of considerably higher mortality rates in younger multimorbid patients with a continuous decrease of risk with increasing age is remarkable and was also shown in various other population-based studies [39–41]. These studies differed in methodology, though. For example, a study from Canada defined multimorbidity as at least 3 out of 17 chronic conditions and was based on administrative healthcare data including out- and inpatient settings [41]. Nevertheless, this association implies that multimorbidity does not only lead to greater healthcare utilisation and costs, but also to a higher risk of death at a younger age.
We reported higher LOS in multimorbid cases by about 2.7 days with a small effect modification by age. This finding is in accordance with previous results from an analysis of elderly community-dwelling individuals [26]. In line with existing literature, 30-day, and 1-year readmission rates were observed more frequently in the case of multimorbidity, increasing with each additional chronic condition [42, 43]. However, no comparable data were found showing the same weakening association of multimorbidity with LOS and readmission rates with increasing age, as seen in this study. More restricted therapy strategies in the elderly, and thus higher out-of-hospital mortality rates with fewer readmissions could be jointly responsible for this observation [43]. In summary, it remains unclear whether improved care for younger multimorbid patients may reduce in-hospital mortality, LOS and readmission rates. Nevertheless, considering the potential clinical benefit, further investigation is essential to understand the impact of age-dependent multimorbidity on healthcare outcomes.
Additionally, specific conditions in multimorbid patients, such as depression, were shown to be independently associated with higher readmission rates and increased LOS [44]. Investigating and addressing such decisive conditions or clusters of conditions in multimorbid patients, has potential to lower adverse outcomes and thereby healthcare expenditures.
These data have to be interpreted in the context of the study design. First, using administrative data is prone to information bias, as hospitalisations will be selected according to the ICD-10 codes with the risk of misclassification and underreporting of diagnoses. Furthermore, because of administrative restrictions, there was no information on out-of-hospital mortality available. Second, we did not have severity estimates of the hospitalised cases. Third, the non-experimental, observational design of our study limits the ability to establish a firm causal link. Furthermore, we did not conduct a sub-analysis to identify conditions or clusters of conditions that are associated with a change in odds of the investigated outcomes. Fourth, since we do not have information about clinical appearance and laboratory parameters, we were unable to account for unmeasured residual confounding.
Because of the growing importance of implications of multimorbidity to healthcare, patients, economy and politics, international benchmarking should be established to facilitate public health surveillance and research. This study used standardised methods to analyse population-based, comprehensive data and demonstrated an increase of hospitalisations with multimorbidity across all age categories over the study period. Hospital multimorbidity is associated with worse healthcare outcomes; to a strongest extent in younger multimorbid cases. More research is needed to explore potential benefits of preventive measures and a more comprehensive care, especially for younger multimorbid inpatients.
We extend our thanks to the Bundesamt für Statistik (BFS) of Switzerland for the acquisition and provision of data.
Equally contributing first authors
This study was funded by the Swiss National Science Foundation (SNF, National Research Program (NRP 74) 407440_167376), the research council (Grant 1410.000.086) and the “Wissenschaft & Weiterbildung” (W&W) Fonds (140.000.495) of the Kantonsspital Aarau AG, and the “Hugo und Elsa Isner Foundation” of the Argovian Department of Health and Social Affairs [45]. Representatives of the funding agencies were not involved in the design and conduct of the study; collection, management, analysis, and interpretation of the data; preparation, review, or approval of the manuscript; and decision to submit the manuscript for publication.
The authors of this manuscript declare no competing financial interests exist. All authors have completed the ICMJE uniform disclosure form at www.icmje.org/coi_disclosure.pdf.
1 Thorpe KE , Ogden LL , Galactionova K . Chronic conditions account for rise in Medicare spending from 1987 to 2006. Health Aff (Millwood). 2010;29(4):718–24. doi:.https://doi.org/10.1377/hlthaff.2009.0474
2 Cassell A , Edwards D , Harshfield A , Rhodes K , Brimicombe J , Payne R , et al. The epidemiology of multimorbidity in primary care: a retrospective cohort study. Br J Gen Pract. 2018;68(669):e245–51. doi:.https://doi.org/10.3399/bjgp18X695465
3 Salive ME . Multimorbidity in older adults. Epidemiol Rev. 2013;35(1):75–83. doi:.https://doi.org/10.1093/epirev/mxs009
4 Kernick D , Chew-Graham CA , O’Flynn N . Clinical assessment and management of multimorbidity: NICE guideline. Br J Gen Pract. 2017;67(658):235–6. doi:.https://doi.org/10.3399/bjgp17X690857
5 Kingston A , Robinson L , Booth H , Knapp M , Jagger C ; MODEM project. Projections of multi-morbidity in the older population in England to 2035: estimates from the Population Ageing and Care Simulation (PACSim) model. Age Ageing. 2018;47(3):374–80. doi:.https://doi.org/10.1093/ageing/afx201
6World Health Organization. World Health Report 2008: Primary health care: Now more than ever. Geneva: World Health Organization; 2008.
7National Institute for Health and Care Excellence. Multimorbidity: clinical assessment and management. Published September 2016. Available from: https://www.nice.org.uk/guidance/ng56/chapter/Recommendations.
8 Barnett K , Mercer SW , Norbury M , Watt G , Wyke S , Guthrie B . Epidemiology of multimorbidity and implications for health care, research, and medical education: a cross-sectional study. Lancet. 2012;380(9836):37–43. doi:.https://doi.org/10.1016/S0140-6736(12)60240-2
9 Parekh AK , Goodman RA . The HHS Strategic Framework on multiple chronic conditions: genesis and focus on research. J Comorb. 2013;3(2):22–9. doi:.https://doi.org/10.15256/joc.2013.3.20
10 Lewis C , Wallace E , Kyne L , Cullen W , Smith SM . Training doctors to manage patients with multimorbidity: a systematic review. J Comorb. 2016;6(2):85–94. doi:.https://doi.org/10.15256/joc.2016.6.87
11 Valderas JM , Starfield B , Sibbald B , Salisbury C , Roland M . Defining comorbidity: implications for understanding health and health services. Ann Fam Med. 2009;7(4):357–63.
12 Wolff JL , Starfield B , Anderson G . Prevalence, expenditures, and complications of multiple chronic conditions in the elderly. Arch Intern Med. 2002;162(20):2269–76. doi:.https://doi.org/10.1001/archinte.162.20.2269
13 Vogeli C , Shields AE , Lee TA , Gibson TB , Marder WD , Weiss KB , et al. Multiple chronic conditions: prevalence, health consequences, and implications for quality, care management, and costs. J Gen Intern Med. 2007;22(S3, Suppl 3):391–5. doi:.https://doi.org/10.1007/s11606-007-0322-1
14Healthcare Cost and Utilization Project. Chronic Condition Indicator (CCI) for ICD-10-CM (beta version). 2018. Available from: www.hcup-us.ahrq.gov/toolssoftware/chronic_icd10/chronic_icd10.jsp
15 Schneider F , Kaplan V , Rodak R , Battegay E , Holzer B . Prevalence of multimorbidity in medical inpatients. Swiss Med Wkly. 2012;142:w13533.
16Switzerland Federal Statistical Office. Die Bevölkerung der Schweiz 2017. Available from: https://www.bfs.admin.ch/bfs/en/home/statistics/population/effectif-change.assetdetail.6606496.html. Accessed 2020 April 21.
17 Aubert CE , Fankhauser N , Marques-Vidal P , Stirnemann J , Aujesky D , Limacher A , et al. Patterns of multimorbidity in internal medicine patients in Swiss university hospitals: a multicentre cohort study. Swiss Med Wkly. 2019;149:w20094. doi:.https://doi.org/10.4414/smw.2019.20094
18 Clerencia-Sierra M , Calderón-Larrañaga A , Martínez-Velilla N , Vergara-Mitxeltorena I , Aldaz-Herce P , Poblador-Plou B , et al. Multimorbidity Patterns in Hospitalized Older Patients: Associations among Chronic Diseases and Geriatric Syndromes. PLoS One. 2015;10(7):e0132909.
19 Agborsangaya CB , Ngwakongnwi E , Lahtinen M , Cooke T , Johnson JA . Multimorbidity prevalence in the general population: the role of obesity in chronic disease clustering. BMC Public Health. 2013;13(1):1161. doi:.https://doi.org/10.1186/1471-2458-13-1161
20 Fitzgerald G , Gallagher P , O’Shea F . Multimorbidity is Common in Axial Spondyloarthropathy and is Associated with Worse Disease Outcomes: Results from the ASRI cohort. J Rheumatol. 2020;47(2):218–26. doi:. https://doi.org/10.3899/jrheum.181415
21 McDaid O , Hanly MJ , Richardson K , Kee F , Kenny RA , Savva GM . The effect of multiple chronic conditions on self-rated health, disability and quality of life among the older populations of Northern Ireland and the Republic of Ireland: a comparison of two nationally representative cross-sectional surveys. BMJ Open. 2013;3(6):e002571. doi:.https://doi.org/10.1136/bmjopen-2013-002571
22 Stanley J , Semper K , Millar E , Sarfati D . Epidemiology of multimorbidity in New Zealand: a cross-sectional study using national-level hospital and pharmaceutical data. BMJ Open. 2018;8(5):e021689. doi:.https://doi.org/10.1136/bmjopen-2018-021689
23 Excoffier S , Herzig L , N’Goran AA , Déruaz-Luyet A , Haller DM . Prevalence of multimorbidity in general practice: a cross-sectional study within the Swiss Sentinel Surveillance System (Sentinella). BMJ Open. 2018;8(3):e019616. doi:.https://doi.org/10.1136/bmjopen-2017-019616
24 Hu RH , Hsiao FY , Chen LJ , Huang PT , Hsu WW . Increasing age- and gender-specific burden and complexity of multimorbidity in Taiwan, 2003-2013: a cross-sectional study based on nationwide claims data. BMJ Open. 2019;9(6):e028333. doi:.https://doi.org/10.1136/bmjopen-2018-028333
25 Nicholson K , Terry AL , Fortin M , Williamson T , Bauer M , Thind A . Prevalence, characteristics, and patterns of patients with multimorbidity in primary care: a retrospective cohort analysis in Canada. Br J Gen Pract. 2019;69(686):e647–56. doi:.https://doi.org/10.3399/bjgp19X704657
26 Bähler C , Huber CA , Brüngger B , Reich O . Multimorbidity, health care utilization and costs in an elderly community-dwelling population: a claims data based observational study. BMC Health Serv Res. 2015;15(1):23. doi:.https://doi.org/10.1186/s12913-015-0698-2
27 van Oostrom SH , Gijssen R , Stirbu I , Korevaar JC , Schellevis FG , Picavet HSJ , et al. [Time trends in prevalence of chronic diseases and multimorbidity not only due to aging: data from general practices and health surveys]. Ned Tijdschr Geneeskd. Article in Dutch. 2017;161:D1429.
28 Lebenbaum M , Zaric GS , Thind A , Sarma S . Trends in obesity and multimorbidity in Canada. Prev Med. 2018;116:173–9. doi:.https://doi.org/10.1016/j.ypmed.2018.08.025
29 Koné Pefoyo AJ , Bronskill SE , Gruneir A , Calzavara A , Thavorn K , Petrosyan Y , et al. The increasing burden and complexity of multimorbidity. BMC Public Health. 2015;15(1):415. doi:.https://doi.org/10.1186/s12889-015-1733-2
30 Tetzlaff J , Muschik D , Epping J , Eberhard S , Geyer S . Expansion or compression of multimorbidity? 10-year development of life years spent in multimorbidity based on health insurance claims data of Lower Saxony, Germany. Int J Public Health. 2017;62(6):679–86. doi:.https://doi.org/10.1007/s00038-017-0962-9
31 Feely A , Lix LM , Reimer K . Estimating multimorbidity prevalence with the Canadian Chronic Disease Surveillance System. Health Promot Chronic Dis Prev Can. 2017;37(7):215–22. doi:.https://doi.org/10.24095/hpcdp.37.7.02
32 Kutz A , Gut L , Ebrahimi F , Wagner U , Schuetz P , Mueller B . Association of the Swiss Diagnosis-Related Group Reimbursement System With Length of Stay, Mortality, and Readmission Rates in Hospitalized Adult Patients. JAMA Netw Open. 2019;2(2):e188332. doi:.https://doi.org/10.1001/jamanetworkopen.2018.8332
33 Kaur P , Saxena N , You AX , Wong RCC , Lim CP , Loh SY , et al. Effect of multimorbidity on survival of patients diagnosed with heart failure: a retrospective cohort study in Singapore. BMJ Open. 2018;8(5):e021291. doi:.https://doi.org/10.1136/bmjopen-2017-021291
34 Charlson ME , Pompei P , Ales KL , MacKenzie CR . A new method of classifying prognostic comorbidity in longitudinal studies: development and validation. J Chronic Dis. 1987;40(5):373–83. doi:.https://doi.org/10.1016/0021-9681(87)90171-8
35 Moore BJ , White S , Washington R , Coenen N , Elixhauser A . Identifying Increased Risk of Readmission and In-hospital Mortality Using Hospital Administrative Data: The AHRQ Elixhauser Comorbidity Index. Med Care. 2017;55(7):698–705. doi:.https://doi.org/10.1097/MLR.0000000000000735
36 Fischer S , Bosshard G , Zellweger U , Faisst K . Der Sterbeort: ?Wo sterben die Menschen heute in der Schweiz?? [Place of death: “Where do people die in Switzerland nowadays?”]. Z Gerontol Geriatr. 2004;37(6):467–74. Article in German. doi:.https://doi.org/10.1007/s00391-004-0216-3
37 Murphy TE , Han L , Allore HG , Peduzzi PN , Gill TM , Lin H . Treatment of death in the analysis of longitudinal studies of gerontological outcomes. J Gerontol A Biol Sci Med Sci. 2011;66A(1):109–14. doi:.https://doi.org/10.1093/gerona/glq188
38 Halonen P , Raitanen J , Jämsen E , Enroth L , Jylhä M . Chronic conditions and multimorbidity in population aged 90 years and over: associations with mortality and long-term care admission. Age Ageing. 2019;48(4):564–70. doi:.https://doi.org/10.1093/ageing/afz019
39 Singh K , Patel SA , Biswas S , Shivashankar R , Kondal D , Ajay VS , et al. Multimorbidity in South Asian adults: prevalence, risk factors and mortality. J Public Health (Oxf). 2019;41(1):80–9. doi:.https://doi.org/10.1093/pubmed/fdy017
40 Jani BD , Hanlon P , Nicholl BI , McQueenie R , Gallacher KI , Lee D , et al. Relationship between multimorbidity, demographic factors and mortality: findings from the UK Biobank cohort. BMC Med. 2019;17(1):74. doi:.https://doi.org/10.1186/s12916-019-1305-x
41 Ryan BL , Allen B , Zwarenstein M , Stewart M , Glazier RH , Fortin M , et al. Multimorbidity and mortality in Ontario, Canada: A population-based retrospective cohort study. J Comorb. 2020;10:2235042X2095059. doi:.https://doi.org/10.1177/2235042X20950598
42 Aubert CE , Schnipper JL , Fankhauser N , Marques-Vidal P , Stirnemann J , Auerbach AD , et al. Patterns of multimorbidity associated with 30-day readmission: a multinational study. BMC Public Health. 2019;19(1):738. doi:.https://doi.org/10.1186/s12889-019-7066-9
43 Librero J , Peiró S , Ordiñana R . Chronic comorbidity and outcomes of hospital care: length of stay, mortality, and readmission at 30 and 365 days. J Clin Epidemiol. 1999;52(3):171–9. doi:.https://doi.org/10.1016/S0895-4356(98)00160-7
44 Beeler PE , Cheetham M , Held U , Battegay E . Depression is independently associated with increased length of stay and readmissions in multimorbid inpatients. Eur J Intern Med. 2020;73:59–66. doi:.https://doi.org/10.1016/j.ejim.2019.11.012
45 Kutz A , Koch D , Conca A , Baechli C , Haubitz S , Regez K , et al. Integrative hospital treatment in older patients to benchmark and improve outcome and length of stay - the In-HospiTOOL study. BMC Health Serv Res. 2019;19(1):237. doi:.https://doi.org/10.1186/s12913-019-4045-x
Table S1Unadjusted estimates for in-hospital mortality, intensive care unit (ICU) admission, length of hospital stay and readmission rates.
| Outcome | ≤1 chronic condition | Multimorbidity | Overall | p-value |
| N | 450,470 | 1,769,530 | 2,220,000 | |
| In-hospital mortality, n (%) | ||||
| Overall | 12,459 (2.8) | 97,269 (5.5) | 109,728 (4.9) | <0.001 |
| <40 years | 153 (0.1) | 972 (1.4) | 1125 (0.6) | |
| 40–64 years | 1690 (1.0) | 16,374 (3.7) | 18,064 (3.0) | |
| 65–79 years | 3621 (3.6) | 35,373 (5.4) | 38,994 (5.2) | |
| ≥80 years | 6995 (10.0) | 44,550 (7.4) | 51,545 (7.7) | |
| ICU admission, n (%) | ||||
| Overall | 20,922 (4.6) | 192,916 (10.9) | 213,838 (9.6) | <0.001 |
| <40 years | 6824 (6.2) | 10,149 (14.1) | 16,973 (9.3) | |
| 40–64 years | 8512 (5.0) | 59,837 (13.6) | 68,349 (11.2) | |
| 65–79 years | 3941 (4.0) | 77,565 (11.8) | 81,506 (10.8) | |
| ≥80 years | 1645 (2.4) | 45,365 (7.5) | 47,010 (7.0) | |
| Length of stay (days), mean (SD) | ||||
| Overall | 4.7 (10.7) | 8.9 (13.9) | 8.1 (13.4) | <0.001 |
| <40 years | 3.2 (4.7) | 7.0 (21.4) | 4.7 (14.1) | |
| 40–64 years | 3.8 (7.5) | 7.4 (14.5) | 6.4 (13.0) | |
| 65–79 years | 5.2 (10.2) | 8.6 (12.1) | 8.2 (11.9) | |
| ≥80 years | 8.7 (19.8) | 10.5 (14.0) | 10.3 (14.7) | |
| 30-day all-cause readmission (%) | ||||
| Overall | 31,556 (7.0) | 224,362 (12.7) | 255,918 (11.5) | <0.001 |
| <40 years | 6409 (5.8) | 11,024 (15.4) | 17,433 (9.6) | |
| 40–64 years | 11,682 (6.8) | 63,864 (14.5) | 75,546 (12.4) | |
| 65–79 years | 8260 (8.3) | 87,650 (13.4) | 95,910 (12.7) | |
| ≥80 years | 5205 (7.5) | 61,824 (10.2) | 67,029 (10.0) | |
| 1-year all-cause readmission (%) | ||||
| Overall | 112,283 (24.9) | 685,163 (38.7) | 797,446 (35.9) | <0.001 |
| <40 years | 22,087 (20.1) | 28,227 (39.3) | 50,314 (27.7) | |
| 40–64 years | 39,733 (23.3) | 173,441 (39.5) | 21,3174 (34.9) | |
| 65–79 years | 29,484 (29.6) | 264,769 (40.4) | 294,253 (39.0) | |
| ≥80 years | 20,979 (30.0) | 218,726 (36.2) | 239,705 (35.6) | |
Table S2Multivariable regression analysis for length of hospital stay.
| Length of stay (days) | Multivariable regression | ||
|---|---|---|---|
| Age group | Coef. (95% confidence interval) | p-value | p-value for interaction |
| <40 years | 3.1 (3.0–3.2) | <0.001 | <0.001 |
| 40–64 years | 3.0 (3.0–3.1) | <0.001 | |
| 65–79 years | 3.2 (3.1–3.2) | <0.001 | |
| ≥80 years | 2.5 (2.4–2.6) | <0.001 | |
| Overall | 2.7 (2.6–2.7) | <0.001 |
Length of stay was adjusted for age, sex, nationality, hospital size (number of hospital beds), hospital teaching status (affiliation to university), type and date (month and year) of admission, number of previous hospitalisations within the dataset and insurance class (private, semiprivate or general sector).
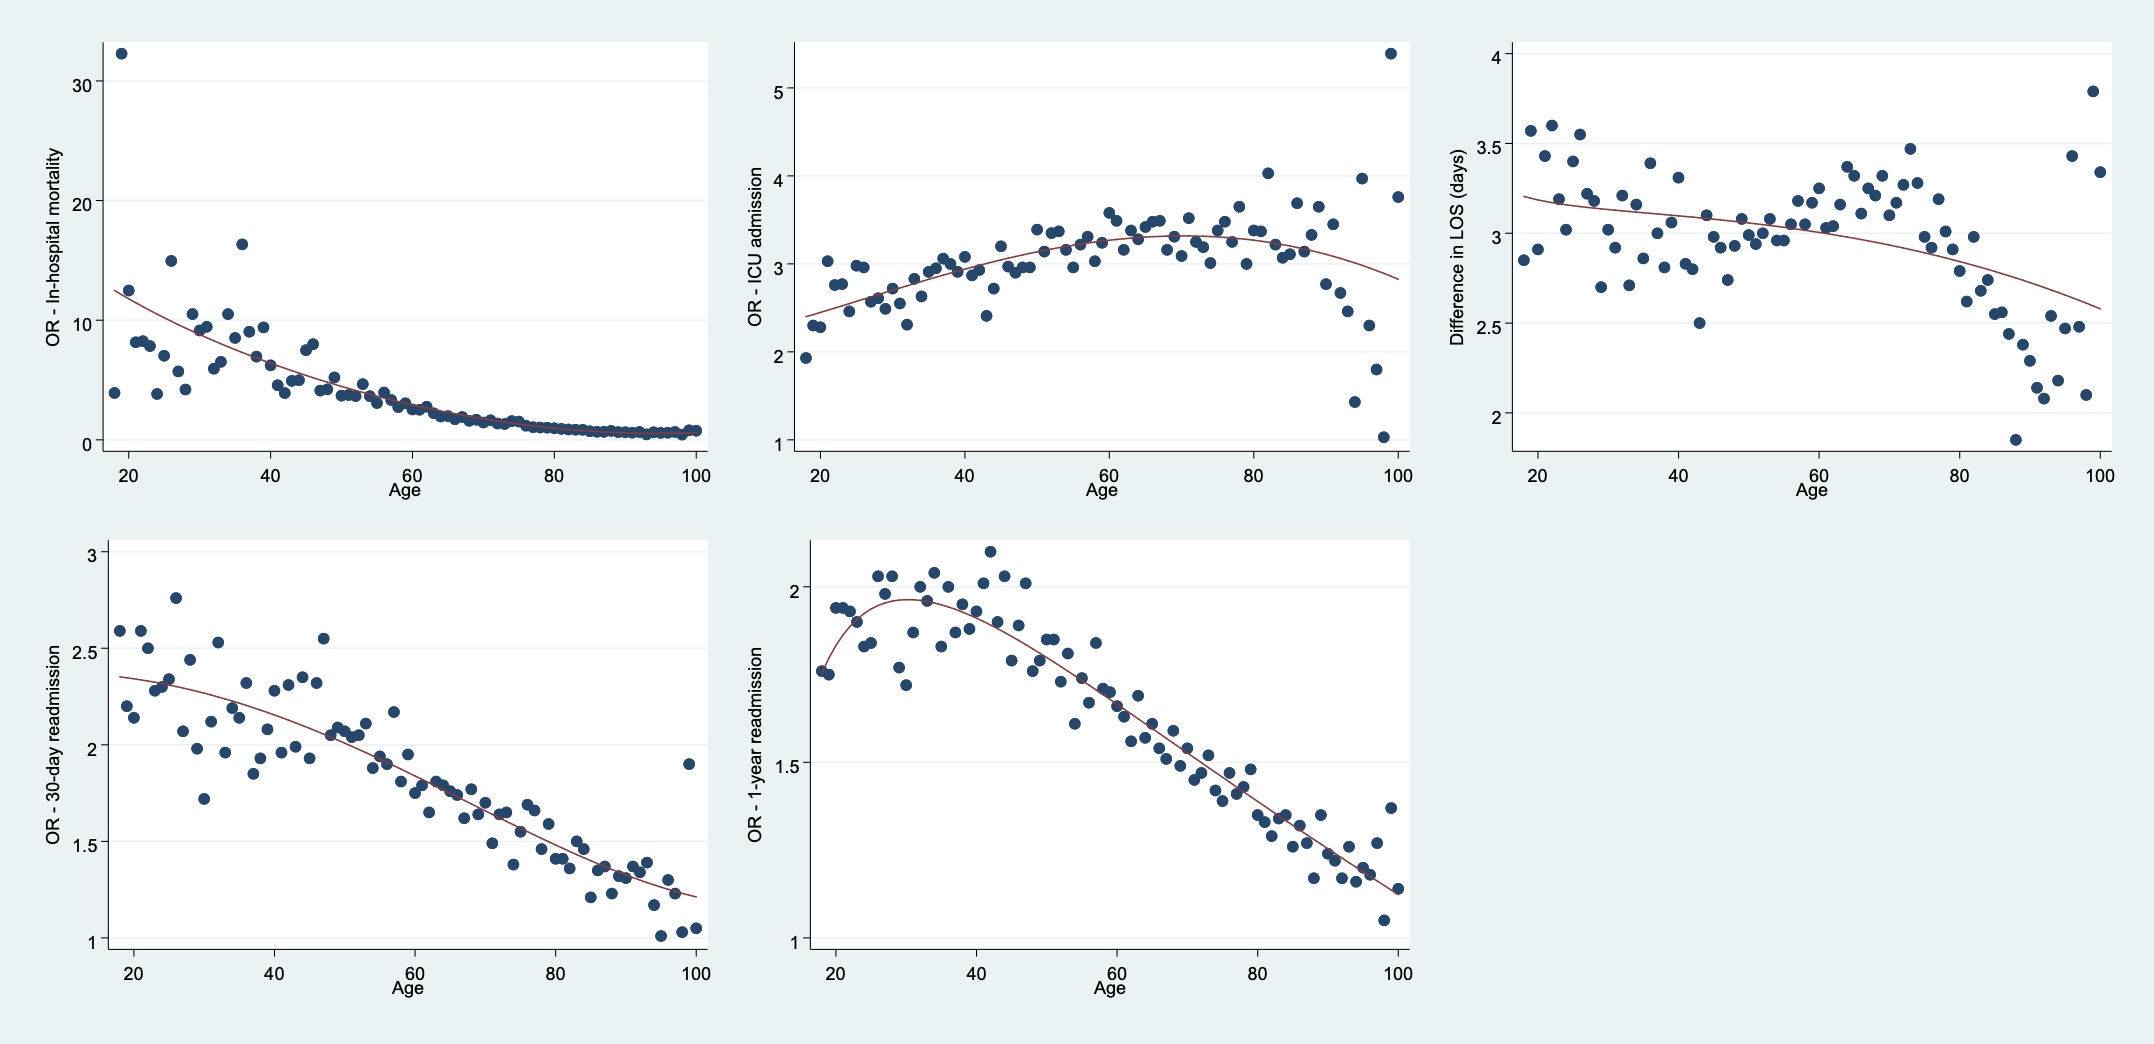
Figure S1 Age-dependent primary and secondary outcome analyses (odds ratios) on a continuous scale.
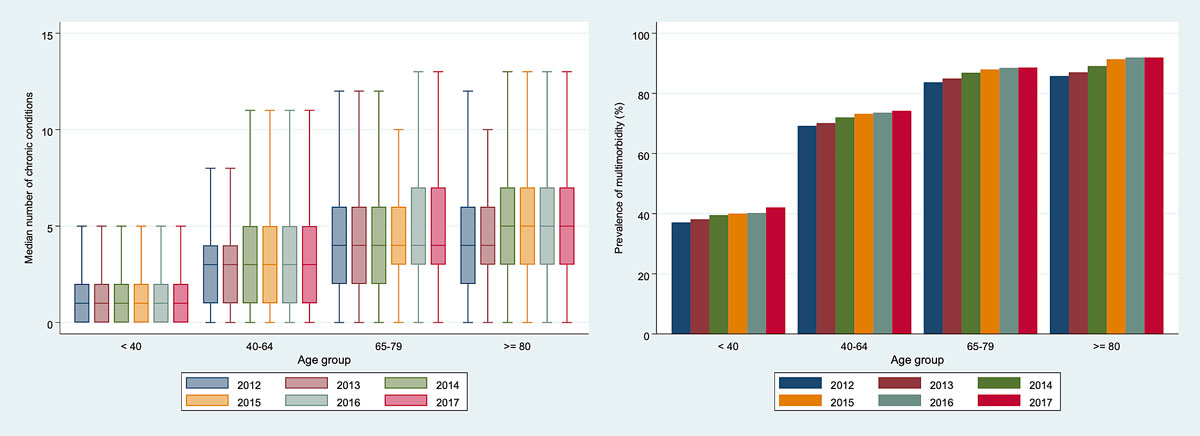
Figure S2 Time-dependent median number of chronic conditions and prevalence of multimorbidity stratified by age.