RheumaTool, a novel clinical decision support system for the diagnosis of rheumatic diseases, and its first validation in a retrospective chart analysis
DOI: https://doi.org/10.4414/smw.2020.20369
Hannes
Aldera, Christian
Marxb, Johann
Steurerc, Maria M.
Wertlic d, Pius
Korner-Nievergelte, Giorgio
Tamborrinif, Thomas
Langeneggerg, Andrina
Eichholzera, Michael
Andorb, Andreas
Krebsa, Beat A.
Michelh, Lukas
Wildii
a UniversitätsSpital Zürich, Rheumatology, Switzerland
b Rheumatologie im Zürcher Oberland, Uster, Switzerland
c Horten Centre for patient-oriented research and knowledge transfer, UniversitätsSpital Zürich, Zurich, Switzerland
d Department of General Internal Medicine, Bern University Hospital, University of Bern, Switzerland
e oikostat GmbH, Ettiswil, Switzerland
f Ultraschallzentrum Rheumatologie, Basel, Switzerland
g Zuger Kantonsspital, Rheumatology, Baar, Switzerland
h RheumaClinic Bethanien, Zurich, Switzerland
i Kantonsspital Winterthur, Rheumatology, Winterthur, Switzerland
Summary
AIMS
RheumaTool is a clinical decision support system designed to support the diagnostic process in rheumatology by presenting a differential diagnosis list after the input of clinical information. The objective of this study was to evaluate the performance of RheumaTool in detecting the correct diagnosis in referrals to a rheumatology clinic.
METHODS
In this retrospective chart analysis, data were gathered from patients with musculoskeletal complaints and an uncertain diagnosis who were referred to a Swiss tertiary rheumatology outpatient clinic. Data were entered into RheumaTool in a standardised fashion, while the principal diagnoses in the medical reports were blinded. RheumaTool’s output was compared to the correct diagnoses, established either by widely accepted diagnostic criteria or through the expert consensus of independent rheumatologists. Diagnostic precision, the primary endpoint, was defined as the proportion of correctly diagnosed cases among all cases.
RESULTS
One hundred and sixty cases with 46 different diseases were included in this analysis. RheumaTool correctly diagnosed 40% (95% confidence interval 32.4–48.1) of all cases. In 63.8% (95% confidence interval 55.7–71.1), the correct diagnosis was present in a differential diagnosis list consisting of a median of two diagnoses.
CONCLUSION
In this first validation, RheumaTool provides a useful list of differential diagnoses. However, there is not sufficient diagnostic reliability for unfiltered data entry, especially in patients with multiple concomitant musculoskeletal disorders. This must be taken into account when using RheumaTool.
Introduction
With increasing technical means to describe pathology in rheumatic diseases and tremendous advances in therapeutic strategies, establishing a correct diagnosis as a basis for providing the best available therapy has become more and more complicated. Health information technology already allows better adherence to guidelines, enhances disease surveillance and decreases medication errors [1]. In rheumatology, machine learning methods support patients’ self-management and help predict disease flares or mortality [2–4]. Artificial intelligence software packages designed to integrate clinical information and perform complex diagnostic evaluations or to propose therapeutic options, so-called clinical decision support systems, are gradually becoming available [5, 6].
In a systematic review published in 2014, 25 computer-based systems for diagnostic support in rheumatology were identified. Nineteen of the identified systems were validated, some of which showed promising results. However, no article was found reporting on a clinical decision support system used in clinical routine. The validation processes varied highly regarding the endpoint and the gold standard with which the systems’ outputs were compared [7]. Including this review and our further Medline search with the additional medical subject heading term "decision support systems, clinical", last run on 13 May 2020, we found seven clinical decision support systems with wide disease spectrums covering ten or more rheumatic diseases (15170 diseases). The major characteristics of these clinical decision support systems are summarised in table S1 in appendix 1. In all these studies, the percentage of correctly diagnosed cases was chosen as an endpoint, and this ranged from 48 to 89% [8–14]. Only H. J. Bernelot Moens and J. K. van der Korst also presented the sensitivity and specificity of their investigated system, which covered only 15 diseases [12].
RheumaTool (RT) is a new, web-based decision support system designed at the University Hospital of Zürich (USZ), Switzerland by board-certified rheumatologists with many years of clinical experience. RT aims to support rheumatologists and general practitioners in the diagnostic process by presenting, based on the patient’s disease characteristics, a differential diagnosis list, and by proposing further diagnostic tests that may help the decision making process.
The goal of this study was to demonstrate the precision of RT in detecting the correct diagnosis in real-life clinical cases and to identify areas of improvement. During this study, a validation method for clinical decision support systems was developed that allows the investigation of a representative population which includes rare diseases and that uses an accurate gold standard to compare RT’s output with.
Materials and methods
RheumaTool
In a web-based search tool, RT provides roughly 1000 disease characteristics for selection, including the patient’s history, physical examination, laboratory results and imaging, with a focus on inflammatory musculoskeletal conditions with arthritis or arthralgia. According to the literature, or to expert consensus if literature was lacking, the developers assigned values for sensitivity, and specificity if applicable, to each disease characteristic in RT’s database for 98 rheumatic diseases. They also added values for the prevalence of each disease. After a minimum of five disease characteristics have been chosen, RT lists all 98 diagnoses according to their probability based on the sensitivity and specificity values of the provided disease characteristics. Prevalence is considered when diagnoses show identical probabilities. Diagnoses are assigned to one of four categories: the first category contains the best-ranked diagnosis only, the second category contains those that are one to 100 times less likely compared to the best-ranked diagnosis, the third category contains those 101 to 333 times less likely, and the fourth category contains all other diagnoses (more than 333 times less likely). The number of diagnoses in each category and their ratio reflect the precision of the result. The smaller the number of diagnoses in the first and second categories (highest probability) and the higher the number in the fourth category (lowest probability), the better the precision of the result. As a secondary output, RT proposes additional testing to support the diagnostic process, e.g., anti-CCP testing to investigate for rheumatoid arthritis. An updated version of RheumaTool is freely available at www.rheumatool.ch.
Participants
Medical records of consecutive referrals to the Department of Rheumatology, USZ from 1 January 2013 until 17 May 2013 were screened with the aim of reaching the predefined case number of 150. Cases were included if the reason for referral was an uncertain diagnosis or unclear musculoskeletal complaints. Only medical reports of the first assessment after referral which contained, as their principal diagnosis, one of the 98 diagnoses considered by RT were included. Cases in which the musculoskeletal complaint remained unclear despite further diagnostic testing and which therefore could not be assigned to a diagnosis were excluded, as were cases in which the medical report did not provide enough information for at least five of the disease characteristics in the RT database.
Because a short window of inclusion might not identify rare diseases, a list of 30 mandatory diseases was established prior to the analysis. These diseases were considered to be particularly relevant in clinical practice and essential for a thorough validation. If a mandatory disease was missing, the search period was extended by five years, to from January 2008, exclusively to include that missing rare disease in the sample. For the extended search, a computer-based search was used instead of manual screening of every first consultation. The computer-based search scanned all rheumatological reports from the extended time period for these missing rare diseases. Then, first consultations were selected manually. The detailed eligibility criteria and the list of mandatory diseases can be found in the online supplementary material.
Validation method
The diagnostic precision of RT was assessed at two different time points. Time point A was at the end of the first consultation at the outpatient rheumatology clinic of the USZ, when only information from the medical history, physical exam and previous laboratory or imaging results provided by the referring physician was available. Time point B was when the first medical report, detailing the first consultation, additional diagnostic work-up and follow-up consultations, was written.
In order to estimate the diagnostic precision, we had to determine the correct diagnoses (reference diagnoses) that served as comparators for the RT results. The reference diagnosis was confirmed either by disease criteria sets (DCS) or by expert consensus. The diagnosis in the medical report at time point B was accepted as the reference diagnosis when the corresponding DCS were fulfilled. Expert consensus was used to establish the reference diagnosis if DCS were not available or when the DCS were not met. Figure 1 depicts this process. The expert team consisted of two rheumatologists (MA and AK) with 9 and 17 years of experience as board-certified rheumatologists and who were not involved in the development of RT. Only DCS proposed by recognized societies in the field of rheumatology were used. If there were multiple criteria sets for a disease, the most recent was used. The reference diagnoses were determined before and independently of the data entry into RT and its output. A list of the applied DCS can be found in the online supplementary material.
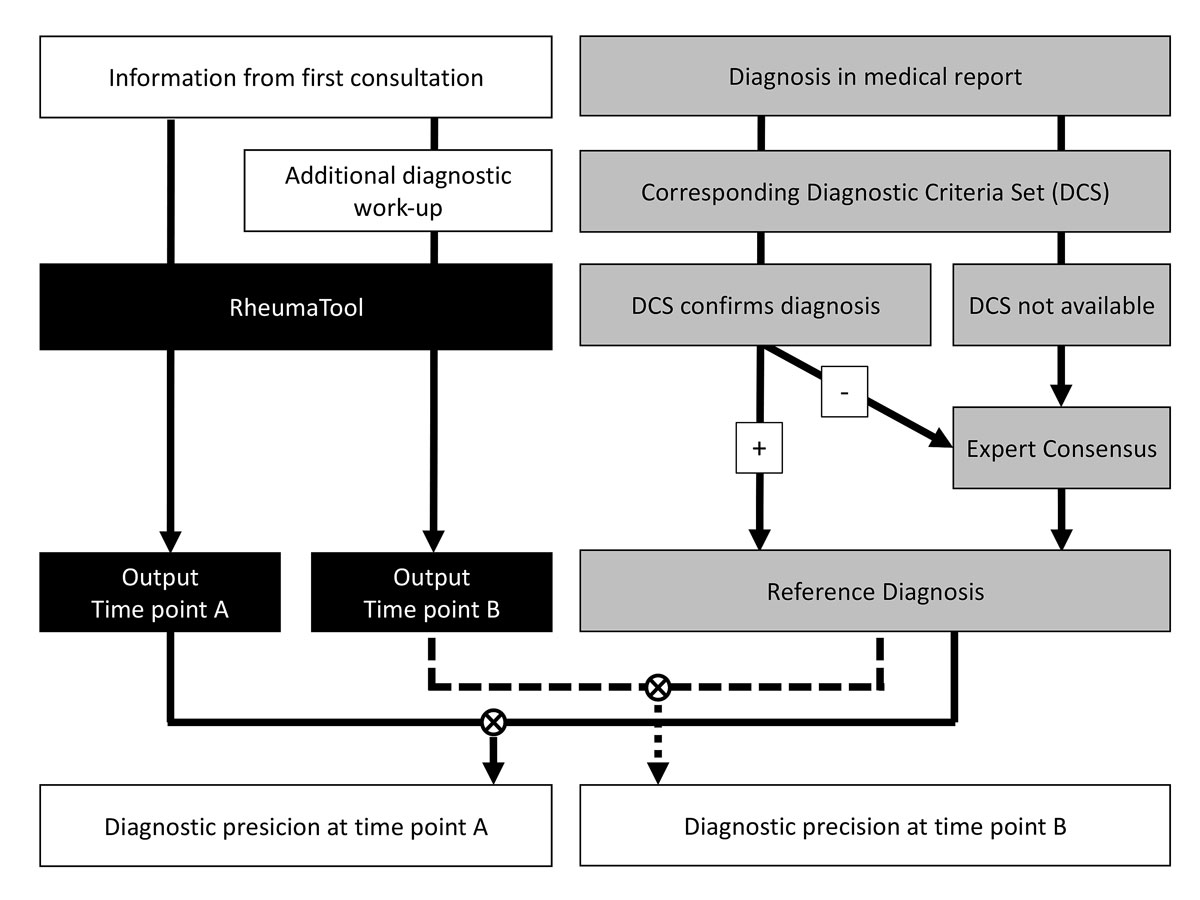
Figure 1 RheumaTool was validated at two time points: time point A, when only information from the first consultation was used, and time point B, when data from the additional diagnostic work-up were also considered. The correct diagnosis (reference diagnosis) was established either by disease criteria sets (DCS) or through the consensus of two independent, experienced rheumatologists. The output of RT was then compared to the reference diagnosis at both time points A and B.
For each included case, the first medical report after the first consultation and the results of the diagnostic work-up mentioned in this report were collected, anonymized and blinded (by HA) for the process of determining the reports’ principal diagnoses. For time point A, the additional diagnostic work-up was also blinded. The data entry into RT was performed by a medical student (AE) who had no access to the patient files or the reports’ principal diagnoses. Data from time point A were completely entered for all cases before AE gained access to the data from time point B. Only pathological findings were entered into RT, as intended. The chosen disease characteristics and RT’s lists of differential diagnoses were collected for every case at both time points A and B.
Analysis
RT was validated for its diagnostic precision, which was defined as the proportion of correctly diagnosed cases among all cases, according to Rodrıguez-Gonzalez and colleagues [15]. This is the most frequently chosen endpoint in validations of clinical decision support systems in rheumatology [7]. Cases were regarded as correctly diagnosed if the reference diagnosis matched RT’s output. The primary endpoint was the diagnostic precision at time point B when only the diagnosis in the first probability category was considered as RT’s output. Secondary endpoints consisted of the following: the diagnostic precision at time point A when only the diagnosis in the first probability category was considered, the diagnostic precision at time point A when all diagnoses in the first and second probability categories combined were considered, and the diagnostic precision at time point B when all diagnoses in the first and second probability categories combined were considered. Additional secondary endpoints were the number of diagnoses in each probability category, the number of patient characteristics entered which matched one of the disease characteristics in RT’s database, and the number of patient characteristics without matching disease characteristics in RT’s database.
The sample size calculation was based on the primary endpoint. We anticipated a diagnostic precision of 90%, with a precision of 0.1 as the 95% confidence interval (CI). This results in a minimum sample size of n = 0.9 × (1 − 0.9)/(0.1/4)2 = 144 patients. Accordingly, we planned to screen referrals until we reached 150 included cases. All statistical analyses were conducted using R version 3.6.0 (R Foundation for Statistical Computing, Vienna, Austria).
The local ethics committee (Swiss Ethics Committees on research involving humans) approved this study (BASEC-Nr 2015-00014).
All patients provided written informed consent for the further use of coded personal data for research purposes.
Results
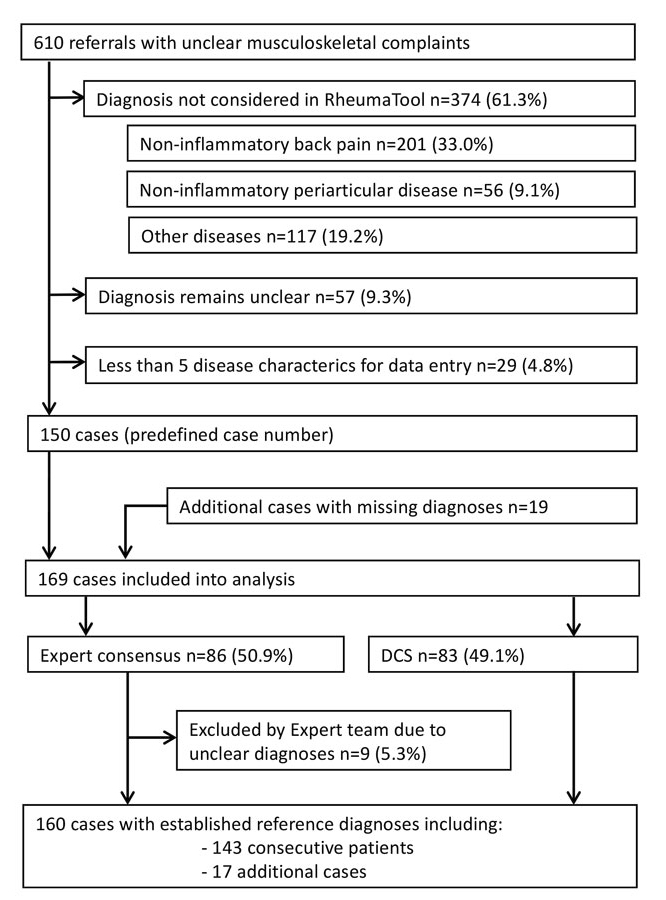
We screened 610 consecutive referrals and were able to include 150 cases. Four hundred and sixty (75.4%) cases had to be excluded overall. Three hundred and seventy-four (61.3%) cases were excluded because the principal diagnosis in the medical report was not considered in RT (non-inflammatory back pain: 201 (33.0%) cases; localised non-inflammatory periarticular disease, such as tendinopathy, bursitis, enthesopathy or periostitis: 56 (9.1%) cases; and other diseases, for example osteomalacia, thromboangiitis obliterans or soft tissue infection: 117 (19.2%)). A list of the diagnoses not considered by RT is shown in the online supplementary material. The diagnosis remained unclear at the end of the first assessment in 57 (9.3%) cases, and 29 (4.8%) cases did not provide enough information for five disease characteristics. Since some predefined mandatory diseases were missing in the initial selection process, the search period was extended and 19 additional cases with missing diseases were added. Consequently, 169 cases were included in the analysis. The expert team had to establish the reference diagnosis in 86 (50.9%), more than half, of the included cases. Nine (5.3%) cases, including two additional cases, were rated unclear by the expert team and were also excluded. The expert team accepted the diagnosis in the medical report as the reference diagnosis in 68 (40.2%) cases. In nine (5.3%) cases, the diagnosis in the medical report was regarded as incorrect and the reference diagnosis was newly established based on consensus. In the final selection, the reference diagnoses for 160 cases (72.7% women, mean age 50.2 years, standard deviation 14.7) were used to approximate the diagnostic precision of RT. Figure 2 depicts the case selection.
These 160 included cases covered 46 different diseases. The most common reference diagnoses were connective tissue diseases and vasculitides (31.3%), followed by spondylarthritis (25.6%). The rest consisted of osteoarthritis (12.5%), rheumatoid arthritis (8.1%), crystal arthropathies (5.0%), infectious arthritis (0.6%) and other diseases (16.9%).
The amount of data entered into RT depended on the extent of the medical report and whether the information in the medical report could be matched with a disease characteristic in RT’s database. The median number of entered disease characteristics per case at time points A and B, as well as the number of characteristics in the medical report that did not match any of the corresponding disease characteristics in RT’s database, are shown in the upper part of table 1. The median number of diagnoses in each of the four probability categories of the differential diagnosis lists proposed by RT is presented in the lower part of table 1.
Table 1 Data entry into RT and its output.
|
Data entry into RT
|
Time point A
|
Time point B
|
| Patient characteristics entered with matching disease characteristic in RT’s database |
16.5 (IQR 12–24.5) |
20 (IQR 15–29) |
| Patient characteristics without matching disease characteristic in RT’s database |
4.5 (IQR 3–8) |
6 (IQR 3–8.25) |
|
Differential diagnosis lists generated by RT
|
| Diagnoses in 1st and 2nd categories |
3 (IQR 2–5) |
2 (IQR 1–4) |
| Diagnoses in 3rd category |
0 (IQR 0–2) |
0 (IQR 0–2) |
| Diagnoses in 4th category |
96 (IQR 93–97) |
96 (IQR 94–97) |
The diagnostic precision was calculated for two scenarios: at time point A and at time point B. The reference diagnosis corresponded to the first listed diagnosis (first probability category) in 38.8% (95% CI 31.3–46.8) of cases at time point A and in 40% (95% CI 32.4–48.1) of cases at time point B. The reference diagnosis corresponded to a diagnosis that was listed in either the first or second probability category in 58.8% (95% CI 50.7–66.4) of cases at time point A and in 63.8% (95% CI 55.7–71.1) of cases at time point B. Table 2 shows the varying diagnostic precision between different disease groups, although the small number of cases did not allow deep analysis.
Table 2 Diagnostic precision of RT at time point B.
|
Number of cases
|
1st category
(correct/total cases)
|
1st or 2nd category
(correct/total cases)
|
| All diseases |
160 (100%) |
40% (64/160)*
[CI 32.4–48.1]†
|
63.8% (102/160)
[CI 55.7–71.1]†
|
| Osteoarthritis |
20 (12.5%) |
30% (6/20) |
50% (10/20) |
| Rheumatoid arthritis |
12 (8.1%) |
58.3% (7/12) |
75% (9/12) |
| Connective tissue diseases and vasculitides |
50 (31.3%) |
42% (21/50) |
64% (32/50) |
| Spondylo-arthritides |
41 (25.6%) |
51.2% (21/41) |
80.5% (33/41) |
| Crystal arthropathies |
8 (5.0%) |
50% (4/8) |
75% (6/8) |
| Infectious arthritis |
1 (0.6%) |
0% (0/1) |
100% (1/1) |
| Various |
28 (16.9%) |
17.9% (5/28) |
39.3% (11/28) |
Discussion
There are three main results of this study. First, RT identified the correct diagnosis in patients referred to a tertiary rheumatology outpatient clinic with unclear musculoskeletal complaints at a comparable rate to other published clinical decision support systems in rheumatology [8–14]. Second, RT performed similarly at first consultation and after further diagnostic testing was available, mainly due to there being only a few additional investigations in our sample. Third, fields of improvement for RT were detected.
RT showed the reference diagnosis in the first or second probability category at time point B in 63.8% of cases, while the median number of diagnoses in both categories combined was two (interquartile range 1–4), compared to a median of 96 diagnoses in categories three and four combined. Hence, RT presented the correct diagnosis within a very short differential diagnosis list in roughly two thirds of cases. Looking at the already mentioned seven comparable clinical decision support systems in rheumatology with reported precisions ranging from 48 to 89%, the diagnostic precision demonstrated by RT seems to be similar [8–14]. Since some of these authors regarded the calculated diagnosis as correct if the correct diagnosis was shown in a hypothesis list of several diagnoses, the diagnostic precision of RT for the first and second probability categories (63.8%) should be used as a comparator [8, 10, 13]. However, the decision support systems mentioned are too heterogeneous for a direct comparison; nor are they freely available for a head-to-head study.
The diagnostic precision of a clinical decision support system is not the only indicator of clinical success. Georges Bordage interviewed internists asking why they had missed diagnoses in the past year. The most often stated reason was “it never crossed my mind” [16]. Hence, a clinical decision support system could lead the physician to the correct diagnosis, even though the correct diagnosis does not appear at the top of the list, just by mentioning the diagnosis within a manageable differential diagnosis list or by initiating further investigations [17].
RT performed with a similar precision at both time points, suggesting that RT can be of assistance at any time in the diagnostic process and that it would perform well in a general practitioner setting. The only slightly higher number of disease characteristics available at time point B (a median of 20 compared to a median of 16.5 at time point A) did not improve the diagnostic precision substantially, perhaps because the disease characteristics were already well documented at the time of referral to a tertiary center. Hence, further testing increased the diagnostic precision at time point B by only five percent compared to that at time point A, although the 95% CIs overlapped.
The clinical applicability of RT could be extended by adding more diseases. Looking at the case selection, causes of mechanical back pain and periarthropathies could be such candidates. Although the small number of cases did not allow any direct comparison between the different disease groups, we could identify a trend. Diseases without inflammatory arthritides, such as osteoarthritis and connective tissue diseases, tended to be diagnosed correctly at a lower rate. Therefore, adjustment of RT’s algorithm regarding non-inflammatory joint findings could improve its diagnostic precision.
There are three reasons why RT did not perform as well as we anticipated in our sample size calculation. First, RT struggled with cases in which several rheumatic diseases existed in the same case simultaneously. RT’s algorithm is designed to match all complaints to a single disease. Of the 58 cases in which the reference diagnosis was shown in the third or fourth probability categories at time point B, 42 (72.4%) had at least two rheumatic diagnoses in the medical report. A future validation in a patient care setting, where the physician focuses on the major complaint and chooses the input accordingly, should reduce the problem of overlapping diseases. Second, RT was designed with a focus on inflammatory arthritis, which might explain the lower precision in osteoarthritis and connective tissue diseases and vasculitides not affecting the joints. The third cause lies in our validation method. The standardised entry into RT caused a high degree of nonspecific and irrelevant inputs, which could be reduced by the exclusion of disease characteristics describing pre-existing musculoskeletal diseases. The standardised entry guarantees the reproducibility of our study but yields the lowest possible precision in the case of unfiltered data entry by physicians with little experience in musculoskeletal disease.
Validation methods for clinical decision support systems have been discussed thoroughly, but there is not yet a widely accepted standard [7, 18–21]. Miller proposed different study designs according to the level of system maturity [19]. During development, a retrospective case analysis can assess feasibility, performance and reliability. Then, before clinical introduction, the system should be tested in the context the system was designed for in a prospective analysis.
In this article, a first-step validation method to identify fields of improvement for a clinical decision support system is presented. The standardised data entry ensures reproducibility and the use of DCS guarantees validity, while the consensus of the expert team allows the inclusion of early stage diseases in which DCS may not yet be fulfilled because of their low sensitivity. The combination of consecutive case selection with the predefined addition of a few cases with rare diseases allowed testing on a representative sample while investigating a wide spectrum of the RT’s knowledge base, including rare diseases.
Limitations
Although the reference diagnoses were verified using diagnostic criteria sets or the consensus of experts, the validity of the reference diagnoses, and therefore the precision of RT, cannot be fully established. As the reference diagnosis in half of the cases had to be established by the expert team, the performance of the tool greatly depends on the diagnostic accuracy of the experts. This may have had an impact on the tool’s performance. The test population was small, and additional studies are needed to evaluate the utility of RT. This should be done through a larger prospective study, and ultimately through a case-control trial. Furthermore, there is a selection bias since we selected only cases with diagnoses represented in the RT database, and these were tested only in patients referred to a tertiary centre. This led to a high percentage of inflammatory diseases in the study population. The usefulness of RT and the generalisability of our findings must be assessed in other patient populations, such as patients seeking care at general practitioners’ offices. Despite their relevance and the extension of the search period, Takayasu’s arteritis, juvenile idiopathic arthritis and eosinophilic granulomatosis with polyangiitis could not be included in this study. Even in the extended search period, no cases with these diseases could be identified due to their low prevalence and our strict inclusion criteria.
Conclusion
The diagnostic decision support system RT showed good diagnostic precision at different time points in the diagnostic process, comparable to previous studies. The precision was substantially limited by concurrent multiple musculoskeletal diseases and the non-filtered data entry. Potential for improvement could be identified, such as the inclusion of certain additional diagnoses and the adjustment of the algorithm to improve the diagnosis of diseases without inflammatory arthritides. Finally, RT cannot currently be viewed as a perfectly reliable diagnostic tool, but rather as an assistance in the process of establishing a differential diagnosis. Future validations in a clinical setting will explore this role more accurately.
Appendix 1 Supplementary information
Inclusion criteria
Exclusion criteria
List of mandatory diseases in alphabetical order
Diseases not covered by RheumaTool's algorithm in alphabetical order
The DCS used for establishing the reference diagnosis
Diagnoses of all 160 cases included in the analysis
Table S1
References
The appendix is available as a separate file at https://smw.ch/article/doi/smw.2020.20369.
Availability of data and material
All data relevant to the study are included in the article or uploaded as supplementary information.
Code availability
The code for RheumaTool is proprietary and not available.
Author contributions
HA, LW, JS, MMW, PKN and UH designed the protocol. AE, HA, MA and AK acquired the data. UH and HA performed the analyses. HA and LW drafted and revised the manuscript. All authors participated in the interpretation of the results and in the critical revision of the manuscript.
References
1
Chaudhry
B
,
Wang
J
,
Wu
S
,
Maglione
M
,
Mojica
W
,
Roth
E
, et al.
Systematic review: impact of health information technology on quality, efficiency, and costs of medical care. Ann Intern Med. 2006;144(10):742–52. doi:.https://doi.org/10.7326/0003-4819-144-10-200605160-00125
2IBM. O’Toole L. Versus Arthritis, Launching a cognitive virtual assistant to provide personalised support 2019. [cited 2019 Sept 26]. Available from: https://www.ibm.com/case-studies/versus-arthritis?mhsrc=ibmsearch_a&mhq=versus%20arthritis
3
Gossec
L
,
Guyard
F
,
Leroy
D
,
Lafargue
T
,
Seiler
M
,
Jacquemin
C
, et al.
Detection of flares by decrease in physical activity, collected using wearable activity trackers, in rheumatoid arthritis or axial spondyloarthritis: an application of Machine-Learning analyses in rheumatology. Arthritis Care Res (Hoboken). 2019;71(10):1336–43. doi:.https://doi.org/10.1002/acr.23768
4
Lezcano-Valverde
JM
,
Salazar
F
,
León
L
,
Toledano
E
,
Jover
JA
,
Fernandez-Gutierrez
B
, et al.
Development and validation of a multivariate predictive model for rheumatoid arthritis mortality using a machine learning approach. Sci Rep. 2017;7(1):10189. doi:.https://doi.org/10.1038/s41598-017-10558-w
5
Hunt
DL
,
Haynes
RB
,
Hanna
SE
,
Smith
K
. Effects of computer-based clinical decision support systems on physician performance and patient outcomes: a systematic review. JAMA. 1998;280(15):1339–46. doi:.https://doi.org/10.1001/jama.280.15.1339
6
Beeler
PE
,
Bates
DW
,
Hug
BL
. Clinical decision support systems. Swiss Med Wkly. 2014;144:w14073 .
7
Alder
H
,
Michel
BA
,
Marx
C
,
Tamborrini
G
,
Langenegger
T
,
Bruehlmann
P
, et al.
Computer-based diagnostic expert systems in rheumatology: where do we stand in 2014?
Int J Rheumatol. 2014;2014:672714. doi:.https://doi.org/10.1155/2014/672714
8
Leitich
H
,
Kiener
HP
,
Kolarz
G
,
Schuh
C
,
Graninger
W
,
Adlassnig
KP
. A prospective evaluation of the medical consultation system CADIAG-II/RHEUMA in a rheumatological outpatient clinic. Methods Inf Med. 2001;40(3):213–20. doi:.https://doi.org/10.1055/s-0038-1634168
9
Godo
L
,
de Mántaras
RL
,
Puyol-Gruart
J
,
Sierra
C
. Renoir, Pneumon-IA and Terap-IA: three medical applications based on fuzzy logic. Artif Intell Med. 2001;21(1-3):153–62. doi:.https://doi.org/10.1016/S0933-3657(00)00080-4
10
Athreya
BH
,
Cheh
ML
,
Kingsland
LC, 3rd
. Computer-assisted diagnosis of pediatric rheumatic diseases. Pediatrics. 1998;102(4):E48. doi:.https://doi.org/10.1542/peds.102.4.e48
11
Schewe
S
,
Schreiber
MA
. Stepwise development of a clinical expert system in rheumatology. Clin Investig. 1993;71(2):139–44. doi:.https://doi.org/10.1007/BF00179995
12
Moens
HJ
,
van der Korst
JK
. Development and validation of a computer program using Bayes’s theorem to support diagnosis of rheumatic disorders. Ann Rheum Dis. 1992;51(2):266–71. doi:.https://doi.org/10.1136/ard.51.2.266
13
Schewe
S
,
Herzer
P
,
Krüger
K
. Prospective application of an expert system for the medical history of joint pain. Klin Wochenschr. 1990;68(9):466–71. doi:.https://doi.org/10.1007/BF01648900
14
Fries
JF
. Experience counting in sequential computer diagnosis. Arch Intern Med. 1970;126(4):647–51. doi:.https://doi.org/10.1001/archinte.1970.00310100093011
15
Rodríguez-González
A
,
Torres-Niño
J
,
Mayer
MA
,
Alor-Hernandez
G
,
Wilkinson
MD
. Analysis of a multilevel diagnosis decision support system and its implications: a case study. Comput Math Methods Med. 2012;2012:367345. doi:.https://doi.org/10.1155/2012/367345
16
Bordage
G
. Why did I miss the diagnosis? Some cognitive explanations and educational implications. Acad Med. 1999;74(10, Suppl):S138–43. doi:.https://doi.org/10.1097/00001888-199910000-00065
17
Braithwaite
RS
,
Scotch
M
. Using value of information to guide evaluation of decision supports for differential diagnosis: is it time for a new look?
BMC Med Inform Decis Mak. 2013;13(1):105. doi:.https://doi.org/10.1186/1472-6947-13-105
18
Hripcsak
G
,
Wilcox
A
. Reference standards, judges, and comparison subjects: roles for experts in evaluating system performance. J Am Med Inform Assoc. 2002;9(1):1–15. doi:.https://doi.org/10.1136/jamia.2002.0090001
19
Miller
RA
. Evaluating evaluations of medical diagnostic systems. J Am Med Inform Assoc. 1996;3(6):429–31. doi:.https://doi.org/10.1136/jamia.1996.97084516
20
Ammenwerth
E
,
Nykänen
P
,
Rigby
M
,
de Keizer
N
. Clinical decision support systems: need for evidence, need for evaluation. Artif Intell Med. 2013;59(1):1–3. doi:.https://doi.org/10.1016/j.artmed.2013.05.001
21
Berner
ES
. Diagnostic decision support systems: how to determine the gold standard?
J Am Med Inform Assoc. 2003;10(6):608–10. doi:.https://doi.org/10.1197/jamia.M1416