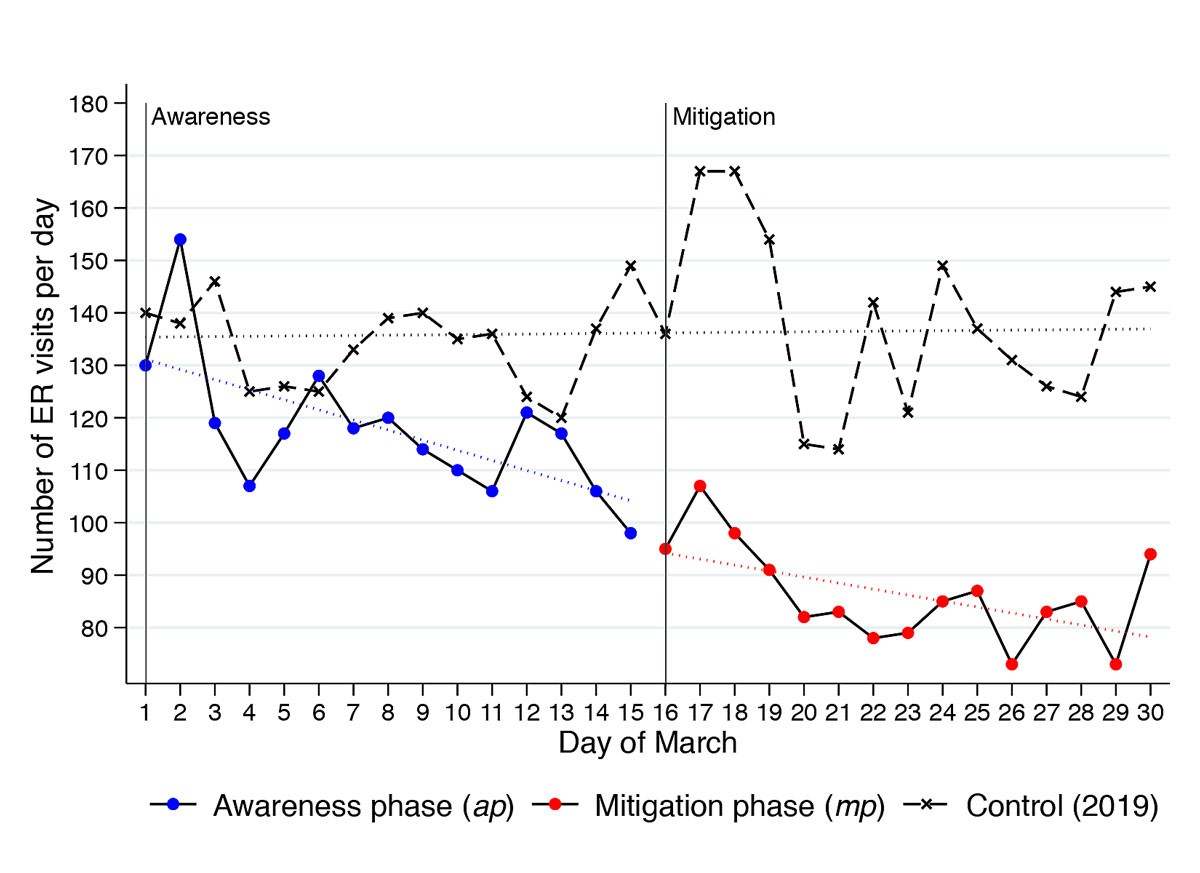
Figure 1 Total number of patients per day during different phases of the COVID-19 pandemic in March 2020 compared to the control group in March 2019. A linear fit of each scatter plot is shown in dotted lines.
DOI: https://doi.org/10.4414/smw.2020.20331
While COVID-19 significantly overburdens emergency rooms (ERs) and hospitals in affected areas [1], ERs elsewhere report a marked decrease in patient numbers [2]. This observation has led to concerns that critically ill patients may seek medical attention either not at all or not in a timely manner [2]. As a result, the largest university hospital in Europe – the Charité Berlin – recently called on heart attack and stroke patients to seek immediate medical assistance if symptoms occur [3]. Our aim was to empirically investigate the assumption that patients with urgent problems currently avoid the ER and to determine which patient groups have the greatest share in the decline in patient numbers, in order to facilitate potential interventions.
The university hospital ER in Bern, the capital of Switzerland, provided retrospective electronic health records for this exploratory study. In 2019, this ER cared for over 50,000 adult patients across all branches of medicine, excluding paediatric patients, who are treated in a children’s hospital close by. Every Swiss citizen has health insurance and may seek ER care when needed. Early in the pandemic, we installed a COVID-19 test centre next to the ER, in which a SARS-CoV-2 nasopharyngeal swab of people in good general condition was performed if test criteria were fulfilled. However, people who needed a physician were treated directly in our ER.
Data were extracted for three periods: first, the awareness phase (ap) from the publication of the national government initiative “How to protect ourselves” on 1 March 2020 to the lockdown of the country on 16 March; second, the mitigation phase (mp) from 16–30 March; finally, patients presenting in March 2019 were used as a control group. The mitigation measures introduced in mid-March 2020 included the closure of schools, restaurants, borders and system irrelevant facilities. Furthermore, the federal government advised the population to stay at home apart from food purchasing and physician consultations.
For all phases, the following data were extracted from the ER’s electronic health system (E-Care, ED 2.1.3.0, Turnhout, Belgium): (i) patient characteristics (sex and age) and (ii) consultation characteristics (the triage status, chief complaints, the discharge diagnosis field of the medical ER report in full-text and the discharge procedure [hospitalisation, ER death, discharge]).
Triage status is assessed routinely for all patients by specially trained nurses using the Swiss triage scale [4], including documentation of the chief complaint. Triage categories 1 (life-threatening problem that requires an immediate start of treatment) to 3 (acute problem, start of treatment within 30 minutes) are defined as urgent. Semi-urgent problems (4) should be treated within 2 hours and non-urgent problems (5) may wait longer than 2 hours before further work-up.
The chief complaints were categorised into different groups (see appendix 1).
Specific diagnoses reflecting critical illness, namely cerebrovascular insult (CVI), myocardial infarction, aortic dissection, ileus, sepsis, pulmonary embolism, polytrauma, ER death and return of spontaneous circulation (ROSC) after cardiopulmonary arrest, were determined using a validated full-text diagnosis parser. The parser was validated through comparison of 500 manually coded, randomly selected full-text diagnoses. The inter-rater agreement was assessed using Gwet’s AC, the recommended measure to assess low prevalence outcomes [5]. Gwet’s AC was >0.9, indicating a “very good” agreement [6].
To overcome the problem of lack of power, a composite outcome critical illness was computed, which is defined as the presence of any of the specific diagnoses and no documented ambulant discharge. Missing data were rated as the absence of the variable of interest, such that if a diagnosis was not documented, it was not present. All consultations were treated as independent observations.
Changes in patient numbers over time were illustrated by determining the number of ER consultations per day in the three periods, together with a linear fit.
For each variable, the following measures were obtained: (i) the absolute numbers in the ap and mp, (ii) an absolute number and accompanying 95% confidence interval (CI) in the control phase through a bootstrap-approach by random selection of 15 days out of all days in March 2019 and recording the numbers in this subset – a procedure we repeated 100 times – to provide an estimate for the magnitude of natural fluctuation, and (iii) the relative risk, the odds of an event in the ap or mp compared with the control phase (March 2019). The geometric mean ratio (GMR) between the phases was calculated for the continuous outcome age. For all odds ratios (ORs) and GMRs a 95% CI and a p-value was determined. A p-value of <0.05 was considered significant.
The competent ethics committee of the Canton of Berne deemed this study a quality evaluation and exempts from full ethical review (Req-2020-00382).
In the three periods, a total of 7143 patients (ap n = 1765; mp n = 1293; March 2019 n = 4085) were treated. We found a 24.9% (42.5%) decline in the number of patients presenting during the ap (mp) compared with the control group (fig. 1), a significant decline (F = 54.86, df = 56, r2 = 0.75).
Figure 1 Total number of patients per day during different phases of the COVID-19 pandemic in March 2020 compared to the control group in March 2019. A linear fit of each scatter plot is shown in dotted lines.
Table 1 shows the frequency of the studied variables in the different periods, as well as the relative risks of an event in the mp or ap compared with the control phase.
Table 1 Patient characteristics by period, compared with the control group.
| March 2020 (COVID-19) | March 2019 | ||||
|---|---|---|---|---|---|
|
Awareness phase
(n = 1765) |
Mitigation phase
(n = 1293) |
Control (15-day)
(n = 2043, mean) |
|||
| Abs. no. | Risk (95% CI)* | Abs. no. | Risk (95% CI)* |
Abs. no.
(95% CI)† |
|
| Sex, male | 1011 | 1.02 (0.91–1.14) | 710 | 0.92 (0.81–1.05) | 1157 (1077–1237) |
| Age group, years | |||||
| 18–24 | 235 | 146 | 270 (221–319) | ||
| 25–44 | 554 | 420 | 576 (503–649) | ||
| 45–64 | 489 | 375 | 592 (539–645) | ||
| >65 | 483 | 0.99 (0.96–1.02) | 349 | 1.00 (0.97–1.03) | 569 (514–624) |
| Triage | |||||
| Life-threatening | 138 | 0.99 (0.81–1.22) | 124 | 1.24 (1.00–1.55) | 142 (111–173) |
| High urgent | 478 | 1.05 (0.92–1.19) | 383 | 1.19 (1.03–1.36) | 520 (466–574) |
| Urgent | 963 | 0.90 (0.81–1.01) | 698 | 0.88 (0.78–1.00) | 1166 (1072–1260) |
| Semi-urgent | 151 | 1.24 (1.01–1.53) | 77 | 0.84 (0.65–1.09) | 153 (118–188) |
| Non-urgent | 27 | 1.01 (0.64–1.59) | 9 | 0.45 (0.23–0.92) | 21 (6–36) |
| Chief complaint | |||||
| Trauma | 204 | 0.87 (0.73–1.03) | 138 | 0.79 (0.65–0.96) | 274 (236–312) |
| Musculoskeletal | 96 | 0.86 (0.68–1.10) | 53 | 0.64 (0.47–0.87) | 148 (122–174) |
| Gastrointestinal | 109 | 0.74 (0.59–0.92) | 85 | 0.79 (0.62–1.01) | 160 (129–191) |
| Respiratory | 99 | 1.66 (1.28–2.16) | 134 | 3.23 (2.53–4.13) | 79 (54–104) |
| Neurological | 197 | 0.87 (0.73–1.03) | 149 | 0.90 (0.74–1.09) | 249 (213–285) |
| Cardiovascular | 164 | 1.11 (0.91–1.35) | 117 | 1.08 (0.86–1.34) | 180 (153–207) |
| Genitourinary | 47 | 0.91 (0.65–1.28) | 35 | 0.93 (0.63–1.36) | 57 (39–75) |
| Ear/nose/throat/eye | 177 | 0.77 (0.64–0.92) | 138 | 0.82 (0.67–1.00) | 238 (189–287) |
| Discharge diagnosis | |||||
| CVI/TIA | 68 | 1.15 (0.86–1.55) | 63 | 1.48 (1.09–2.00) | 77 (59–95) |
| STEMI/NSTEMI | 13 | 0.70 (0.37–1.30) | 18 | 1.33 (0.76–2.31) | 22 (11–33) |
| Aortic dissection | 4 | 0.54 (0.18–1.62) | 6 | 1.12 (0.44–2.84) | 8 (0–16) |
| Ileus | 2 | 0.36 (0.08–1.58) | 6 | 1.46 (0.55–3.85) | 10 (5–15) |
| Sepsis | 15 | 1.02 (0.55–1.88) | 15 | 1.40 (0.76–2.58) | 17 (7–27) |
| Pulmonary embolism | 6 | 0.51 (0.21–1.24) | 8 | 0.94 (0.42–2.06) | 15 (5–25) |
| Polytrauma | 7 | 1.68 (0.75–3.77) | 9 | 0.95 (0.39–2.30) | 10 (1–19) |
| ER death | 5 | 3.87 (0.92–16.2) | 7 | 7.41 (1.91–28.7) | 2 (0–5) |
| ROSC or ER death | 11 | 1.50 (0.70–3.21) | 13 | 2.43 (1.18–5.02) | 7 (0.2–14) |
| Critically ill‡ | 105 | 1.00 (0.79–1.27) | 116 | 1.56 (1.24–1.96) | 127 (99–154) |
| Discharge at home | 1118 | 1.08 (0.96–1.21) | 782 | 0.96 (0.84–1.09) | 1212 (1102–1322) |
| Hospital admission | 509 | 0.88 (0.78–1.00) | 401 | 0.98 (0.86–1.12) | 641 (579–703) |
Abs. no. = absolute number; CI = confidence interval; CVI = cerebrovascular insult; ER = emergency room; (N)STEMI = (non) ST-elevation myocardial infarction; ROSC = return of spontaneous circulation; TIA = transient ischaemic attack * Geometric mean ratio (95% confidence interval) for continuous variables, odds ratio (95% CI) for binary variables, control group as baseline; significant associations (p <0.05) marked in bold. † The absolute numbers with accompanying CIs are obtained by bootstrapping (choosing 15 days of March 2019 randomly and calculating the absolute number) with 100 replications. ‡ One of the listed discharge diagnoses and no documented ambulant discharge.
Semi-urgent triage was associated and hospital admission negatively associated with the ap. The risk of presenting with a respiratory complaint increased in the ap. Patients during the mp were triaged significantly more urgently, were less likely to present for muscular-skeletal or traumatic chief complaints and more likely to present for respiratory reasons. Patients presenting during the mp were more likely to be critically ill and had higher odds of admission after cardiopulmonary resuscitation with ROSC or/and death in the ER.
The absolute number of all specified diagnoses except for ER death and ROSC or ER death in both the ap and the mp was smaller than the bootstrapped mean of a 15-day control period in March 2019. Most of the absolute numbers in ap and mp were within the 95% CI of the bootstrapped mean. Significantly fewer patients had ileus as discharge diagnosis in the ap and more patients died in the ER in both the ap and mp. None of the ER deaths, but three of the patients with ROSC after cardiovascular resuscitation, were thought to be due to hypoxaemia possibly related to COVID-19.
The absolute numbers for the studied characteristics in the three phases as well as the relative change in the absolute numbers for the COVID-19 phases compared with the mean of the first and second halves of March 2019 are shown in table S1 in appendix 1. There was an increase of 233% and 367% (ap and mp, respectively) of ER death, and of 29% and 53% in patients with ROSC or ER death, compared with the control period in 2019. Apart from polytrauma, with an increase of 5% in the mp phase, all other critical discharge diagnoses decreased. For instance, the incidence of myocardial infarction and CVI decreased in the mp by about 16% and 8%, respectively, for instance.
The decrease in patients we observed during the time of COVID-19 was of similar magnitude to the reductions reported elsewhere [2]. As expected, more patients presented with respiratory chief complaints.
Various factors may explain the observed decline in patient numbers [7]. First, fewer patients require emergency care (e.g., due to a reduction in activities that result in trauma or muscular-skeletal problems) or, second, patients with minor complaints opt for self-care. A third potential reason may be that patients who in fact should present, do not (e.g., for fear of cross-infection with the novel coronavirus). Our data suggest that all these effects occur. Furthermore, our data were consistent with two studies published very recently [8, 9].
Giamello et al. analysed discharge diagnoses of ER patients in Italy during the COVID-19 pandemic using a similar design to the present study. They found a significant decline – up to 68% reduction compared with one year before –in the number of ER patients. Patients presenting with non-urgent problems such as lower back pain and general malaise, as well as trauma patients, consulted significantly less often. However, they also found a significant decrease (45%) of patients with acute coronary syndrome and concluded that patients’ avoidance of the ER during a pandemic may lead to higher morbidity and mortality caused by other diagnoses, such as myocardial infarction, that are not related to the pandemic [8].
In our study, relative reductions were found in all critical diagnoses studied apart from ROSC after cardiopulmonary reanimation and ER death. However, apart from ER death, most of the numbers were within the 95% CIs of the absolute numbers for the control group. One possible explanation for why our numbers did not reach significance regarding myocardial infarction is that the decline in patients in our study was less extreme than in the ER studied in Italy, where mitigation measures were stricter than in Switzerland.
Baldi and colleagues found a 58% increase of out-of-hospital cardiac arrests in four provinces of the Lombardy region, Northern Italy [9]. In 22.6% of these, no relation to the COVID-19 outbreak was found, which might indicate that people did not seek emergency care at the appropriate time.
Our study was limited to a single centre and to a short observation period. Furthermore, as with all retrospective study, it was prone to information bias. However, this bias was likely to be distributed equally in the different phases, thus it would lead to non-differential error. The lack of power to detect a possible present significant difference in some of the categories due to a small sample size and the shortness of the phases studied (15 days) was a further limitation. Last, we did not correct for multiple testing and handled multiple consultations of the same patient as independent observations.
In conclusion, barriers to seeking emergency care during the COVID-19 pandemic may lead to higher morbidity and mortality. Healthcare authorities and hospitals must ensure low barriers to treatment and business as usual for patients with chronic or acute on chronic illnesses. Additionally, patients must be informed and be aware of the importance of seeking emergency healthcare at appropriate times, independently of an ongoing pandemic.
* Aronsky D, Kendall D, Merkley K, James BC, Haug PJ. A comprehensive set of coded chief complaints for the emergency department. Acad Emerg Med Off J Soc Acad Emerg Med. 2001;8(10):980–9.
Table S1 Absolute numbers of characteristics in the three studied phases and relative differences of the awareness respectively mitigation phases and the control phase.
| Awareness phase | Mitigation phase | Average 2 weeks March 2019 | |||||
|---|---|---|---|---|---|---|---|
| Abs. no. | Abs. diff. | Rel. diff. | Abs. no. | Abs. diff. | Rel. Diff. | Abs. no. | |
| Sex, male | 1011 | −152 | −13.0% | 710 | −453 | −38.9% | 1163 |
| Age group, years | |||||||
| 18–24 | 235 | −50 | −17.5% | 146 | −139 | −48.8% | 285 |
| 25–44 | 554 | −51 | −8.4% | 420 | −185 | −30.5% | 605 |
| 45–64 | 489 | −92 | −15.8% | 375 | −206 | −35.4% | 581 |
| >65 | 483 | −88 | −15.3% | 349 | −222 | −38.8% | 571 |
| Triage | 0 | ||||||
| Life-threatening | 138 | −23 | −14.0% | 124 | −37 | −22.7% | 161 |
| High urgent | 478 | −57 | −10.7% | 383 | −152 | −28.4% | 535 |
| Urgent | 963 | −204 | −17.5% | 698 | −469 | −40.2% | 1167 |
| Semi-urgent | 151 | 8 | 5.6% | 77 | −66 | −46.2% | 143 |
| Non-urgent | 27 | −4 | −12.9% | 9 | −22 | −71.0% | 31 |
| Chief complaint | |||||||
| Trauma | 204 | −64 | −23.9% | 138 | −130 | −48.5% | 268 |
| Musculoskeletal | 96 | −32 | −24.7% | 53 | −75 | −58.4% | 128 |
| Gastrointestinal | 109 | −58 | −34.7% | 85 | −82 | −49.1% | 167 |
| Respiratory | 99 | 29 | 40.4% | 134 | 64 | 90.1% | 71 |
| Neurological | 197 | −62 | −23.9% | 149 | −110 | −42.5% | 259 |
| Cardiovascular | 164 | −185 | −53.0% | 117 | −232 | −66.5% | 349 |
| Genitourinary | 47 | −13 | −21.0% | 35 | −25 | −41.2% | 60 |
| Ear/nose/throat/eye | 177 | −83 | −31.8% | 138 | −122 | −46.8% | 260 |
| Discharge diagnosis | |||||||
| CVI/TIA | 68 | −1 | −0.7% | 63 | −6 | −8.0% | 69 |
| STEMI/NSTEMI | 13 | −9 | −39.5% | 18 | −4 | −16.3% | 22 |
| Aortic dissection | 4 | −5 | −52.9% | 6 | −3 | −29.4% | 9 |
| Ileus | 2 | −5 | −69.2% | 6 | −1 | −7.7% | 7 |
| Sepsis | 15 | −2 | −11.8% | 15 | −2 | −11.8% | 17 |
| Pulmonary embolism | 6 | −8 | −55.6% | 8 | −6 | −40.7% | 14 |
| Polytrauma | 7 | −2 | −16.7% | 9 | 1 | 5.9% | 9 |
| ER death | 5 | 4 | 233.3% | 7 | 6 | 366.7% | 2 |
| ROSC or ER death | 11 | 3 | 29.4% | 13 | 5 | 52.9% | 9 |
| Critically ill* | 105 | −17 | −13.6% | 116 | −6 | −4.5% | 122 |
| Discharge at home | 1118 | −139 | −11.1% | 782 | −475 | −37.8% | 1257 |
| Hospital admission | 509 | −134 | −20.8% | 401 | −242 | −37.6% | 643 |
Abs. diff. = absolute difference; Abs. no. = absolute number; CI = confidence interval; CVI = cerebrovascular insult; ER = emergency room; (N)STEMI = (non) ST-elevation myocardial infarction; Rel. diff. = relative difference; ROSC = return of spontaneous circulation; TIA = transient ischaemic attack * One of the listed discharge diagnoses and no documented ambulant discharge.
No financial support and no other potential conflict of interest relevant to this article were reported.
1 Grasselli G , Pesenti A , Cecconi M . Critical Care Utilization for the COVID-19 Outbreak in Lombardy, Italy: Early Experience and Forecast During an Emergency Response. JAMA. 2020;323(16):1545. doi:.https://doi.org/10.1001/jama.2020.4031
2 Thornton J . Covid-19: A&E visits in England fall by 25% in week after lockdown. BMJ. 2020;369:m1401. doi:.https://doi.org/10.1136/bmj.m1401
3Schlaganfall- und Herzpatienten zu Untersuchungen aufgerufen. Deutsches Ärzteblatt. Published 2020 March 30. https://www.aerzteblatt.de/nachrichten/111482/Schlaganfall-und-Herzpatienten-zu-Untersuchungen-aufgerufen
4 Rutschmann OT , Hugli OW , Marti C , Grosgurin O , Geissbuhler A , Kossovsky M , et al. Reliability of the revised Swiss Emergency Triage Scale: a computer simulation study. Eur J Emerg Med. 2018;25(4):264–9. Published online February 14, 2017. doi:.https://doi.org/10.1097/MEJ.0000000000000449
5 Gwet KL . Computing inter-rater reliability and its variance in the presence of high agreement. Br J Math Stat Psychol. 2008;61(1):29–48. doi:.https://doi.org/10.1348/000711006X126600
6 Wongpakaran N , Wongpakaran T , Wedding D , Gwet KL . A comparison of Cohen’s Kappa and Gwet’s AC1 when calculating inter-rater reliability coefficients: a study conducted with personality disorder samples. BMC Med Res Methodol. 2013;13(1):61. doi:.https://doi.org/10.1186/1471-2288-13-61
7Krumholz HM. Where Have All the Heart Attacks Gone? The New York Times. https://www.nytimes.com/2020/04/06/well/live/coronavirus-doctors-hospitals-emergency-care-heart-attack-stroke.html. Published 2020 April 6. Accessed 2020 April 8.
8 Giamello JD , Abram S , Bernardi S , Lauria G . The emergency department in the COVID-19 era. Who are we missing? Eur J Emerg Med. 2020;27(4):305–6. doi:.https://doi.org/10.1097/MEJ.0000000000000718
9 Baldi E , Sechi GM , Mare C , Canevari F , Brancaglione A , Primi R , et al.; Lombardia CARe Researchers. Out-of-Hospital Cardiac Arrest during the Covid-19 Outbreak in Italy. N Engl J Med. 2020;NEJMc2010418. doi:.https://doi.org/10.1056/NEJMc2010418
Contributed equally
No financial support and no other potential conflict of interest relevant to this article were reported.