COVID-19 infectivity profile correction
DOI: https://doi.org/10.4414/smw.2020.20336
Peter
Ashcrofta, Jana S.
Huismana, Sonja
Lehtinena, Judith A.
Boumana, Christian L.
Althausb, Roland R.
Regoesa, Sebastian
Bonhoeffera
aInstitute of Integrative Biology, ETH Zurich,
bInstitute of Social and Preventive Medicine,
COVID-19 infectivity profile correction
Introduction
While investigating the results of “Temporal dynamics in viral shedding and transmissibility of COVID-19” [1], we found an erroneous step in the likelihood calculation, which is cause for concern. The consequence of this error is that two data-points are dropped from the calculation, without any explicit mention of this in the text of the manuscript. The inclusion of these data-points results in an infectiousness profile that is substantially different from the one shown in figure 1C of the original publication. As a result, infectiousness starts significantly before the reported 2.3 days before the onset of symptoms. We still find, however, a presymptomatic infection fraction of ~45%, in agreement with the conclusion of He et al. [1]. Given that the estimate of 2.3 days of infectiousness before symptom onset is highly relevant to the implementation of contact tracing, we believe it is of very high importance to clarify this situation. Our reanalysis suggests that tracing contacts of infected index cases as far back as 2 or 3 days before symptom onset in the index case might not be sufficient to find all secondary cases. In addition, we remark on a less consequential issue with the normalisation of the likelihood, which awards higher weight to transmission pairs with more uncertain symptom onset times of the index case, but does not affect the results significantly. Due to the central position this study currently has in the field, there is a high probability that these errors are propagated in future studies. Therefore, a fast response to this issue is crucial. We note that detecting this issue was only possible thanks to the availability and accessibility of the code and data that accompany the publication.
In this viewpoint article, we address the following three points:
- The infectivity profile is computed without erroneously dropping data-points and we compare this corrected profile with the published profile;
- Confidence intervals (CIs) via likelihood profiling are provided for the infectivity profile;
- An issue relating to the normalisation of the likelihood over serial interval ranges is discussed.
Results
The infectivity profile, p(t), describes the infectiousness of an individual at a time t relative to the onset of their symptoms. When this is convolved with an incubation period distribution g(t) from Li et al. [2], one recovers the serial interval distribution, describing the time between symptom onsets in a transmission pair. This approach was used in He et al. [1], with a fixed incubation period distribution and empirical serial interval distribution, to infer the infectivity profile for COVID-19.
The optimisation procedure maximises the likelihood of observing the empirical serial interval distribution under a model, which is specified by the parameters of the infectivity profile. This profile is parametrised as a shifted gamma distribution. Full details of this procedure can be found in He et al. [1].
In the fitting procedure used in the manuscript Fig1c_Rscript.R (available at https://github.com/ehylau/COVID-19), the following condition is used in the return line of the likelihood function:
return(-sum(lli[!is.infinite(lli)]))
This condition will erroneously drop any data-point that has a probability of zero (and hence a log-probability of −∞) under the current model parameters. As the optimisation is initiated with a shift value of 2.5 days, two data-points (54 and 68) are dropped from the beginning of the fit procedure. This then leads to an erroneous maximum likelihood infectiousness profile, which is displayed in figure 1C of the original manuscript [1]. Initiating the fitting procedure at shift of 4 days shows convergence to a very different optimum infectiousness profile.
Here we used an adaptive grid search algorithm to scan the three-dimensional parameter space of the shifted gamma distribution that describes the infectiousness profile. We computed the log-likelihood with and without the return condition in the likelihood function at each point in parameter space to construct likelihood surfaces. The maximum likelihood parameter values that we found are enumerated in table 1. We see that they are substantially different depending on whether the data-points are included or not.
Table 1 Maximum likelihood parameter estimates based on our adaptive grid search approach using the method of He et al. [1] and the corrected computation.
|
Parameter
|
He et al.
|
Corrected
|
| Shape |
1.56250 |
97.18750 |
| Rate |
0.53125 |
3.71875 |
| Shift |
2.12500 |
25.62500 |
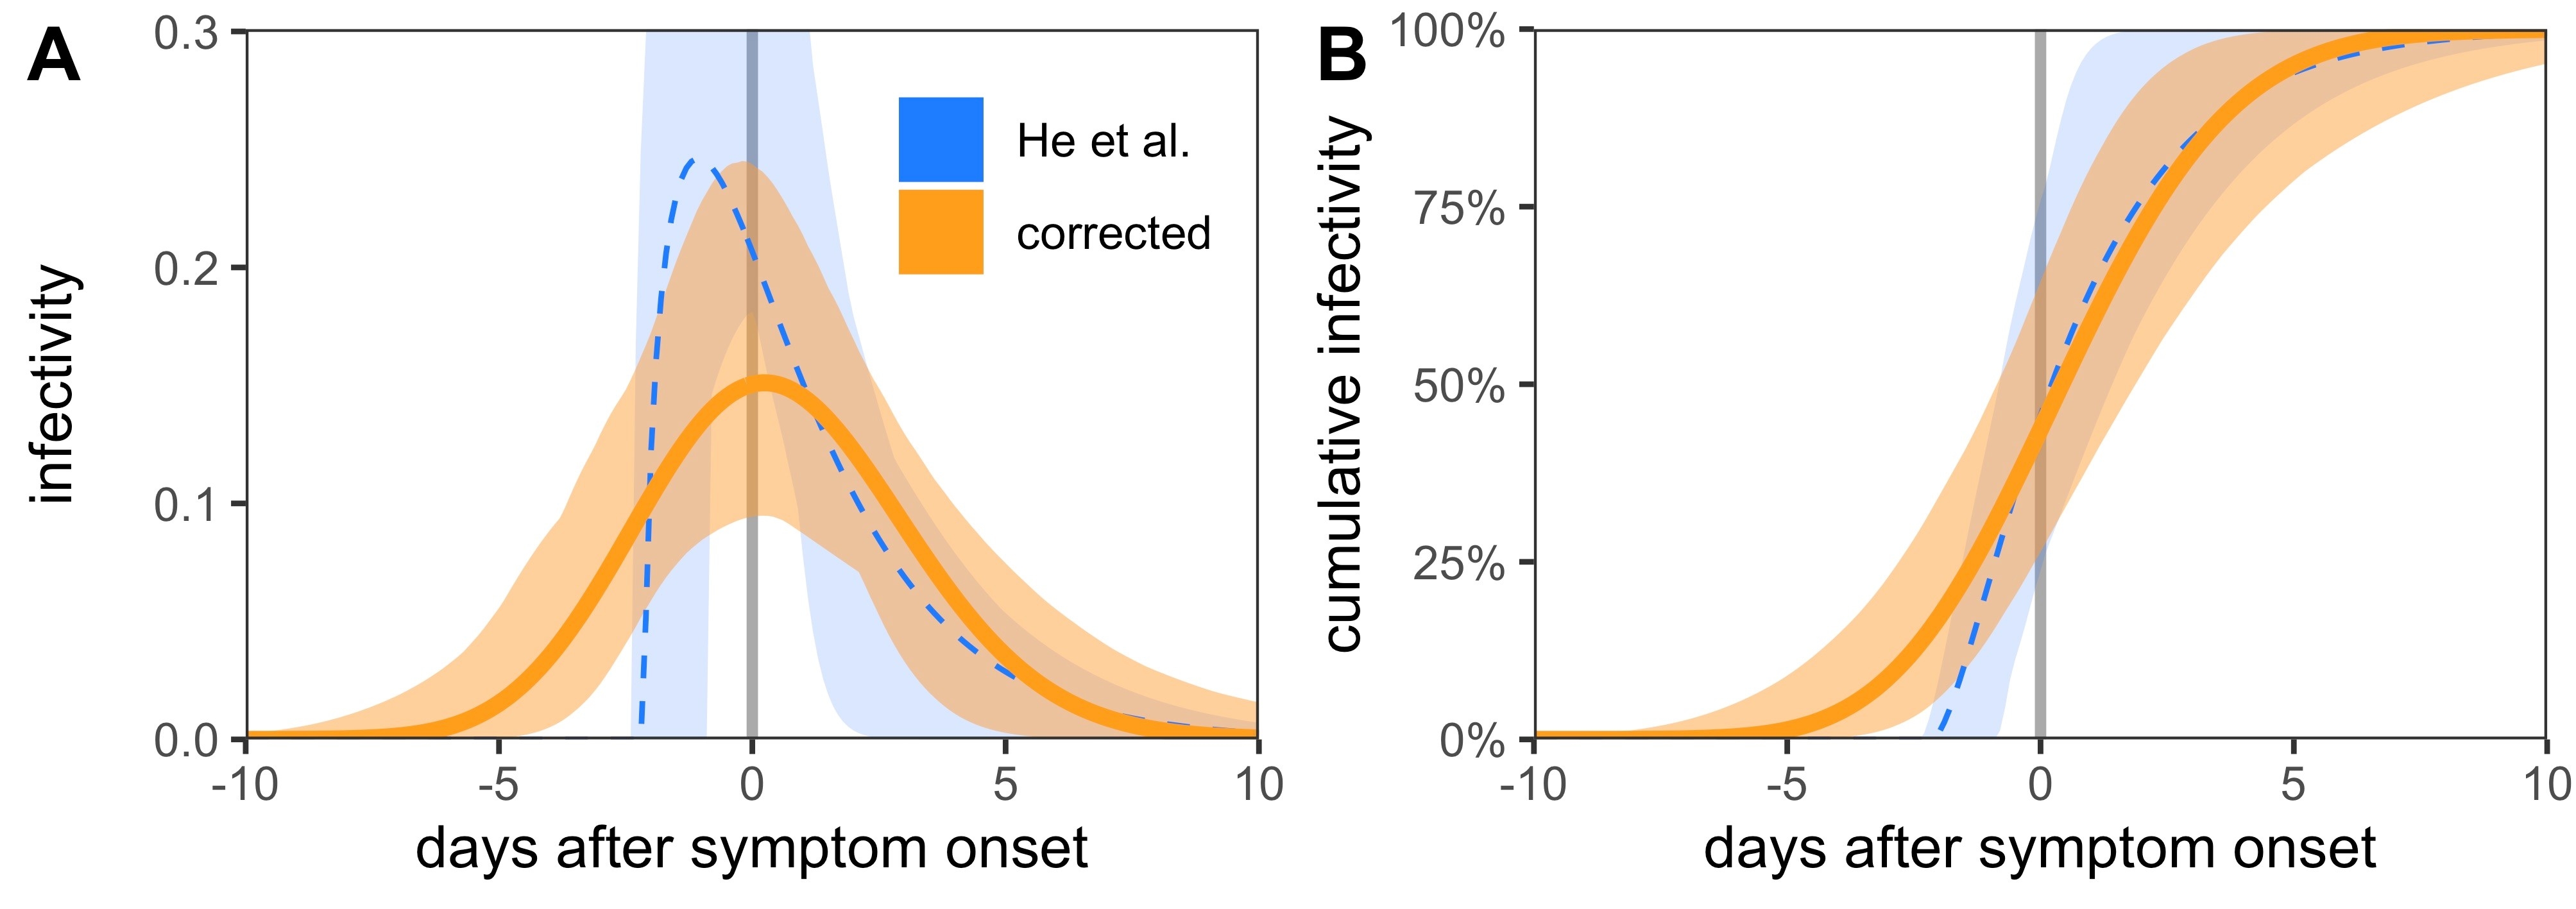
We constructed confidence intervals around the distribution via likelihood ratio tests, compared with the maximum likelihood estimate (also known as likelihood profiling). This led to the optimum infectivity profiles and confidence intervals shown in figure 1. We also found a presymptomatic infection fraction of 45.6% (95% CI 23.8–75.8%) using the He et al. [1] method and 43.7% (95% CI 26.4–64.5%) using the corrected profile.
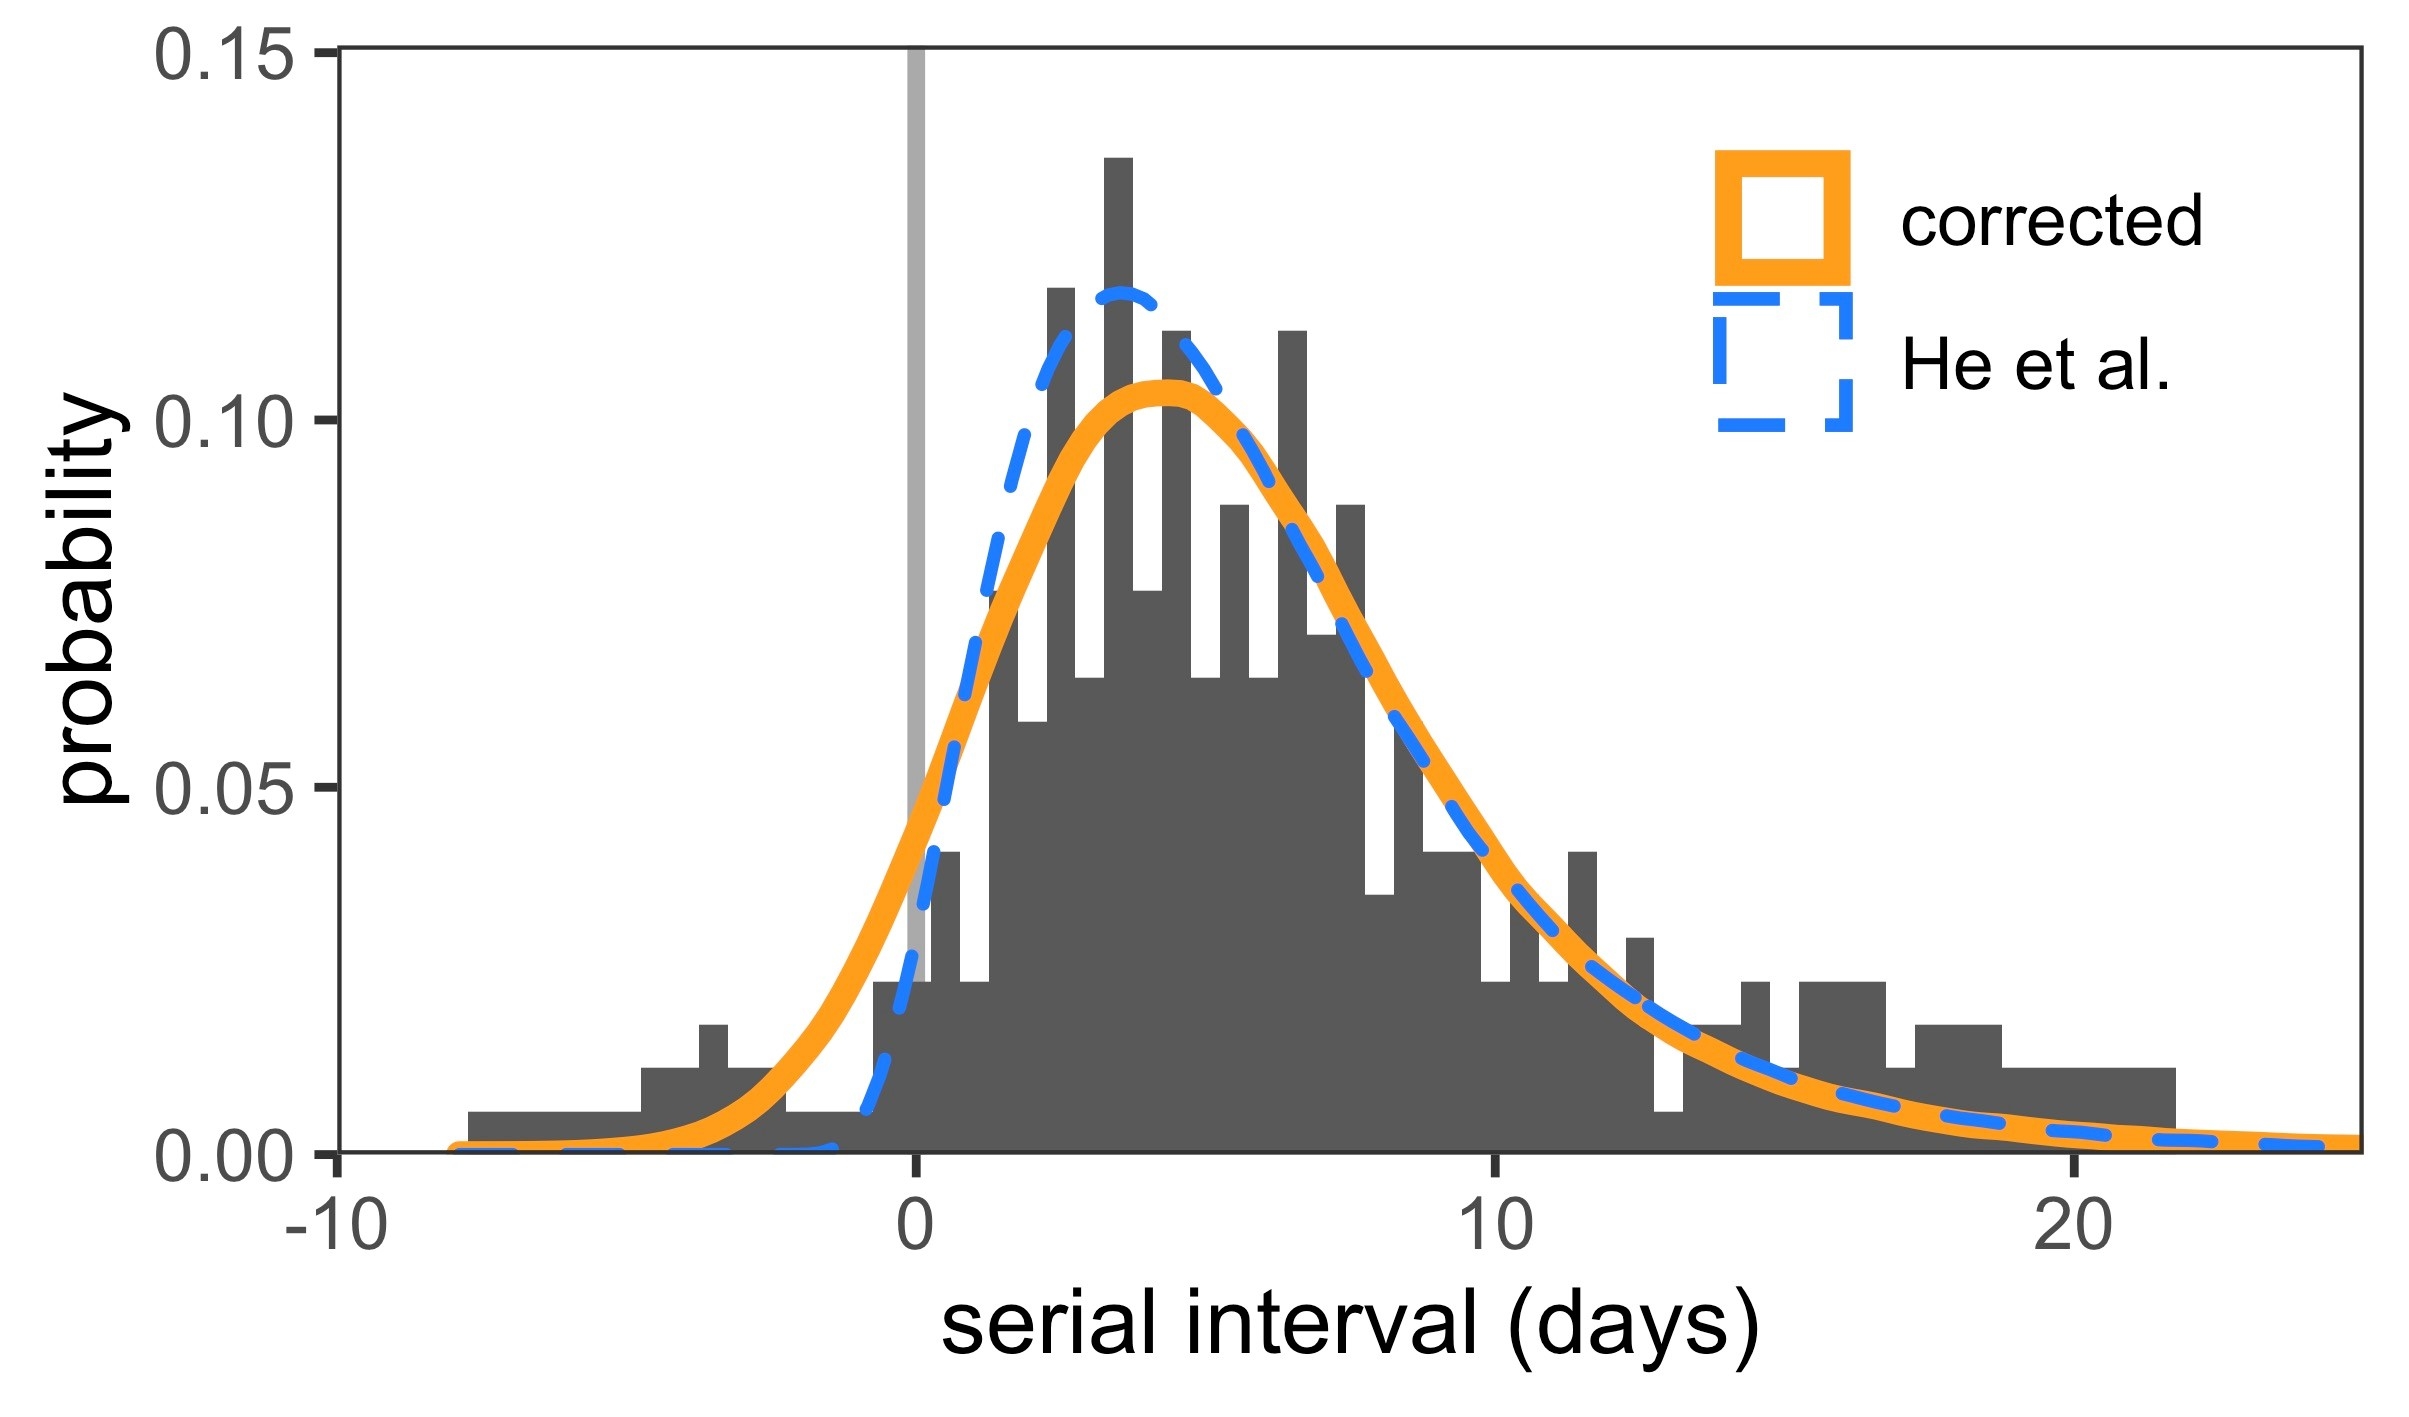
The correct optimum fits in figure 1 are smoother than the ones that drop the data-points. Although there is some asymmetry in the fits within the confidence interval, the correct optimum solution has a very large shape parameter and approaches a normal distribution. We also used these fitted distributions to reconstruct serial intervals (fig. 2), the distribution of which is broader when all data-points are taken into account.
To further quantify the difference between the published and corrected infectivity profiles, we used an example based on contact tracing. We used the infectivity profiles to answer the following question: What fraction of presymptomatic infections are traced if we look back days from symptom onset? Formally, this fraction is defined as
These values are enumerated in table 2. We saw that whereas the published infectivity profile suggests 98% of presymptomatic infections occur within 2 days before symptom onset, the corrected distribution suggests only 61% of presymptomatic infections will be traced. Thus the published profile overestimated the efficacy of contact tracing, whereas the corrected distribution tells us we need to look back at least 4 days to catch 90% of presymptomatic infections.
Table 2 The fraction of presymptomatic infections that are traced if we look back days from symptom onset using the published and corrected infectivity profiles. The computed quantity f(t) is described in equation (1). Values in parentheses represent 95% confidence intervals of f(t) when accounting for the uncertainty in the infectivity profiles.
|
Time (days)
|
He et al.
|
Corrected
|
| 1 |
50% (37–100%) |
33% (19–51%) |
| 2 |
98% (87–100%) |
61% (40–83%) |
| 3 |
100% (100–100%) |
80% (57–96%) |
| 4 |
100% (100–100%) |
91% (71–99%) |
| 5 |
100% (100–100%) |
97% (82–100%) |
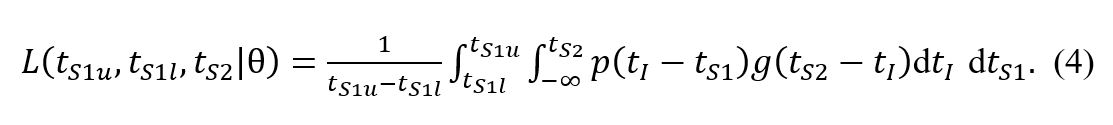
A second less consequential problem in the methodology of He et al. [1] is that a normalisation factor is missing in the likelihood function when considering transmission pairs with serial interval estimates specified by a range. Ignoring this normalisation awards higher weight to transmission pairs with more uncertain symptom onset times of the index case.
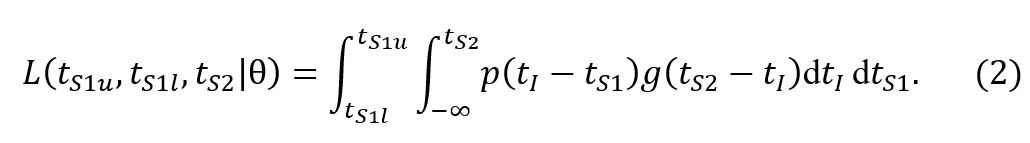
Concretely, the probability under model ϴ to observe a window of symptom onset of the index case (tS
1
l
, tS
1
u
) and symptom onset in the secondary case on day tS
2 is defined in the original manuscript as
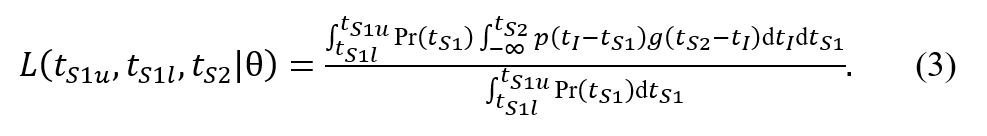
where p(t) is the infectivity profile and g(t) is the incubation period distribution. The outer integral over the symptom onset window of the index case should include an accompanying probability to observe the onset time tS
1, Pr(tS
1) thus
Assuming a uniform distribution for Pr(tS
1), this simplifies to
Inclusion of this normalisation has no effect on the location of the optimum fit or the construction of confidence intervals using our method, as the normalisation factors combine multiplicatively as a prefactor. However, these full details should have been included in the optimisation procedure.
Footnote
The code used to generate our results is archived at https://zenodo.org/badge/latestdoi/278170144.
References
1
He
X
,
Lau
EHY
,
Wu
P
,
Deng
X
,
Wang
J
,
Hao
X
, et al.
Temporal dynamics in viral shedding and transmissibility of COVID-19. Nat Med. 2020;26(5):672–5. doi:.https://doi.org/10.1038/s41591-020-0869-5
2
Li
Q
,
Guan
X
,
Wu
P
,
Wang
X
,
Zhou
L
,
Tong
Y
, et al.
Early Transmission Dynamics in Wuhan, China, of Novel Coronavirus-Infected Pneumonia. N Engl J Med. 2020;382(13):1199–207. doi:.https://doi.org/10.1056/NEJMoa2001316