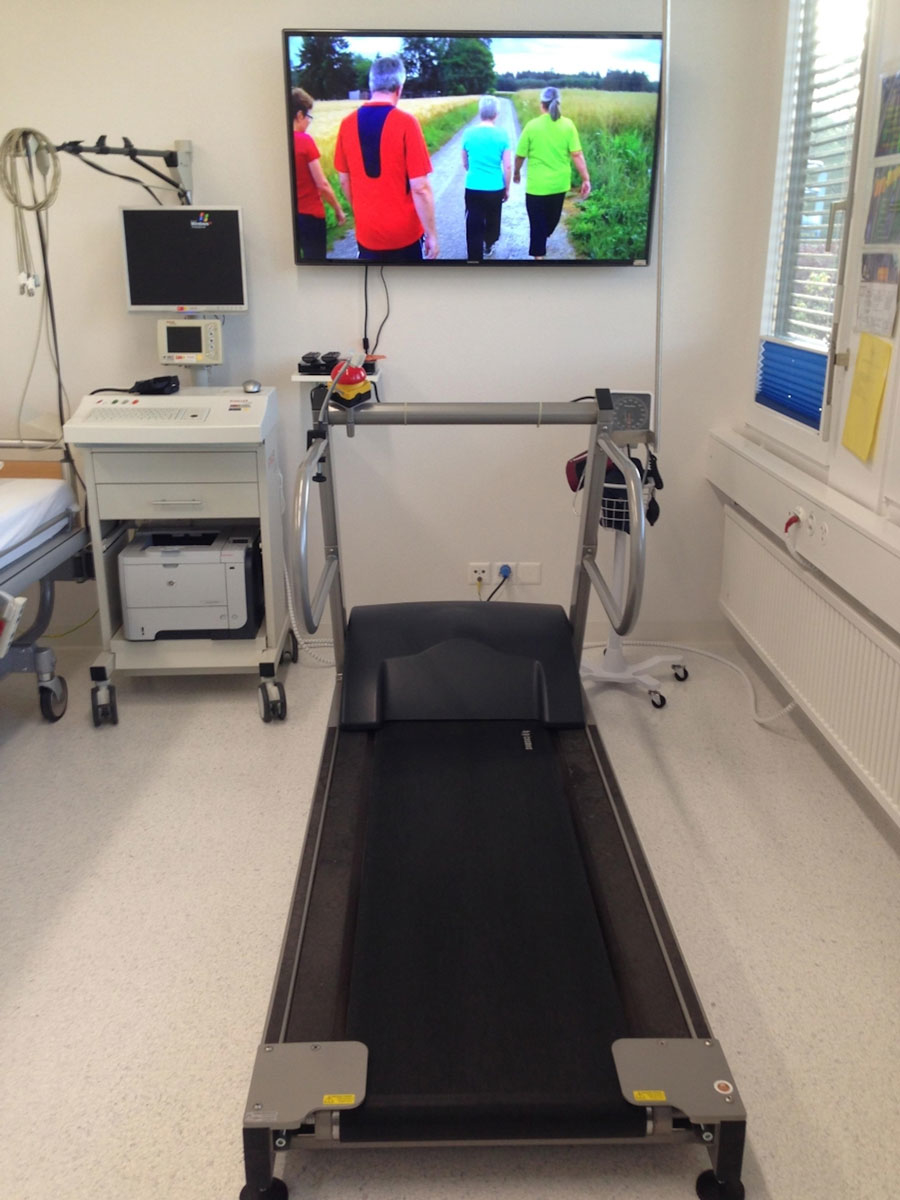
Figure 1 The treadmill positioned in front of a screen showing a scene from the video.
DOI: https://doi.org/10.4414/smw.2020.20287
Exercise testing is a frequently performed diagnostic test to evaluate symptoms, exercise tolerance or blood pressure response and to gauge the prognosis of selected patients (European Society for Cardiology [ESC] Chronic Coronary Syndrome Guidelines 2019 Class I recommendation [1]). It can also be used to evaluate the probability of the presence of coronary artery disease if no imaging methods are available (ESC Chronic Coronary Syndrome Guidelines 2019 Class IIb recommendation [1]). Exercise testing is a strong and independent predictor of all-cause and cardiovascular mortality [2–7]. It is widely used, inexpensive, and a negative test result may, in selected patient populations, render further invasive diagnostic tests like coronary angiography unnecessary [8].
However, the diagnostic accuracy of exercise stress testing varies and is dependent on the achievement of an adequate level of stress. Currently, a heart rate of at least 85% of the age-predicted maximum heart rate is considered an appropriate and required threshold for attaining an adequate level of stress [9, 10]. Furthermore, the maximum exercise capacity derived from exercise tests is a powerful predictor of cardiovascular events [2–5, 11]. Studies have demonstrated that patients with higher exercise workloads show a decreased mortality, irrespective of age and gender [2]. The exercise capacity is an even better predictor of all cause-mortality than established cardiovascular risk factors like pack-years of smoking, history of congestive heart failure or myocardial infarction [2].
Exercise testing is highly dependent on the patient’s cooperation. Thus, different types of patient encouragement have been tested in various studies. Verbal encouragement is one possibility to increase a patient’s motivation. Studies have shown that verbal motivation during exercise testing leads to higher maximum exercise levels [12], longer distances, higher final heart rates [13] and longer exercise durations, as well as more pleasure and intensity [14]. Other studies have examined the effect of exercising in a group at moderate intensities. It has been suggested that exercising with a group results in better adherence [15] and longer exercise durations [16]. Sometimes, however, it might be difficult to find a matching exercise partner. A virtually presented partner could lead to better persistence in exercise training [17].
In light of this evidence, we examined the effect of a virtual walking group on treadmill exercise testing. Usually patients exercise alone, supervised by medical staff. The hypothesis of our study was that a virtual walking group would have a favourable impact on the performance and comfort of patients.
Between June and September 2014, patients were assessed for eligibility. Eligible participants were adults, either hospitalised or outpatients, at a Swiss teaching hospital with an indication for exercise treadmill testing. Every consecutive patient in this time period who did not meet the exclusion criteria and gave their informed consent was included in the trial. Exclusion criteria were any criteria presenting a contraindication for exercise testing and the physical inability to perform an exercise treadmill test.
Patients were 1:1 randomised centrally into two groups using a randomisation table. Group A performed an exercise treadmill test while watching a virtual walking group (video group), while group B watched a static image during exercise (control group). All patients with stress test interruption due to exhaustion were included in the statistical analysis. Patients with stress test interruption due to other reasons (such as chest pain or ST-segment changes) were excluded from the analysis, as we assumed that their test results would not be susceptible to being improved by encouragement.
The study protocol was approved by the local ethics committee. All patients gave their written informed consent. The trial was registered post-hoc under the trial ID NCT03704493.
The primary endpoints were the achieved percentage of age-predicted exercise capacity, calculated as metabolic equivalents (METs) and the subjective perceived level of comfort. Secondary endpoints were the achieved percentage of the age-predicted maximum heart rate (HRmax), the exercise duration, the number of patients with a peak rate pressure product (RPP) above 30,000 and the subjective closeness to their physical limits achieved.
Exercise testing was performed by attending cardiologists after a standard 12-lead electrocardiogram (ECG) and after blood pressure at rest was recorded. The exercise test was performed on a Schiller MTM-1500 med treadmill (SCHILLER Reomed AG, Dietikon, Switzerland) using a ramp protocol. The protocol consisted of one minute of walking at 1.2km/h without a gradient to allow the patients to get used to walking on a treadmill. Afterwards, the speed and gradient were increased gradually every three minutes, as shown in table 1.
Table 1 Details of the ramp exercise protocol used. After the first minute, the speed and gradient of the treadmill was increased gradually.
| Stage | Duration (min) | Speed (km/h) | Gradient (%) |
|---|---|---|---|
| 1 | 01:00 | 1.2 | 0.0 |
| 2 | 03:00 | 2.0 | 8.0 |
| 3 | 03:00 | 3.0 | 12.0 |
| 4 | 03:00 | 3.0 | 18.0 |
| 5 | 03:00 | 4.0 | 22.0 |
| 6 | 03:00 | 5.0 | 22.0 |
| 7 | 03:00 | 6.0 | 22.0 |
| 8 | 03:00 | 7.0 | 22.0 |
Patients were monitored continuously with a 12-lead ECG (Schiller CS-200) and blood pressure was measured every two minutes (Schiller BP-200 plus). All patients were verbally encouraged to perform to their maximum.
Exercise termination criteria included significant symptoms, ECG signs of myocardial ischemia (horizontal ST-segment depression of more than 3 mm in at least three adjacent ECG leads or ST-segment elevation of more than 1 mm in a non-infarct lead without an abnormal Q wave), a decrease in systolic blood pressure of at least 10 mm Hg, systolic blood pressure higher than 250/120 mm Hg, higher graded arrhythmias and the patient’s request to stop.
The maximum age-predicted heart rate was calculated from the equation HRmax = 220 − age. The age-predicted maximum exercise capacity was calculated in METs using the treadmill controller system. The RPP was determined as the product of maximum heart rate (in bpm) and maximum blood pressure (in mm Hg). The achieved METs were calculated by the treadmill system using the following formulas:
which are the accepted formulas of the America College of Sports Medicine’s Metabolic Calculations Handbook [18].
The peer intervention consisted of a video showing a walking group. The patients in the video group watched it on a screen (Samsung LED 55”) on the wall in front of the treadmill during exercise treadmill testing, as shown in figure 1. The video showed five amateur walkers walking on a path along woods and fields, giving the patient the perspective of a person walking with the group, as shown in figure 2 and video 1. Sometimes all five walkers are seen in the video; sometimes one or two walkers are only partly seen or are disappearing sideways from the video, giving the viewer the impression of walking within the group. The walking speed of the people in the video correlated with the walking speed of the treadmill. The control group saw a static image of lavender flowers.
Figure 1 The treadmill positioned in front of a screen showing a scene from the video.
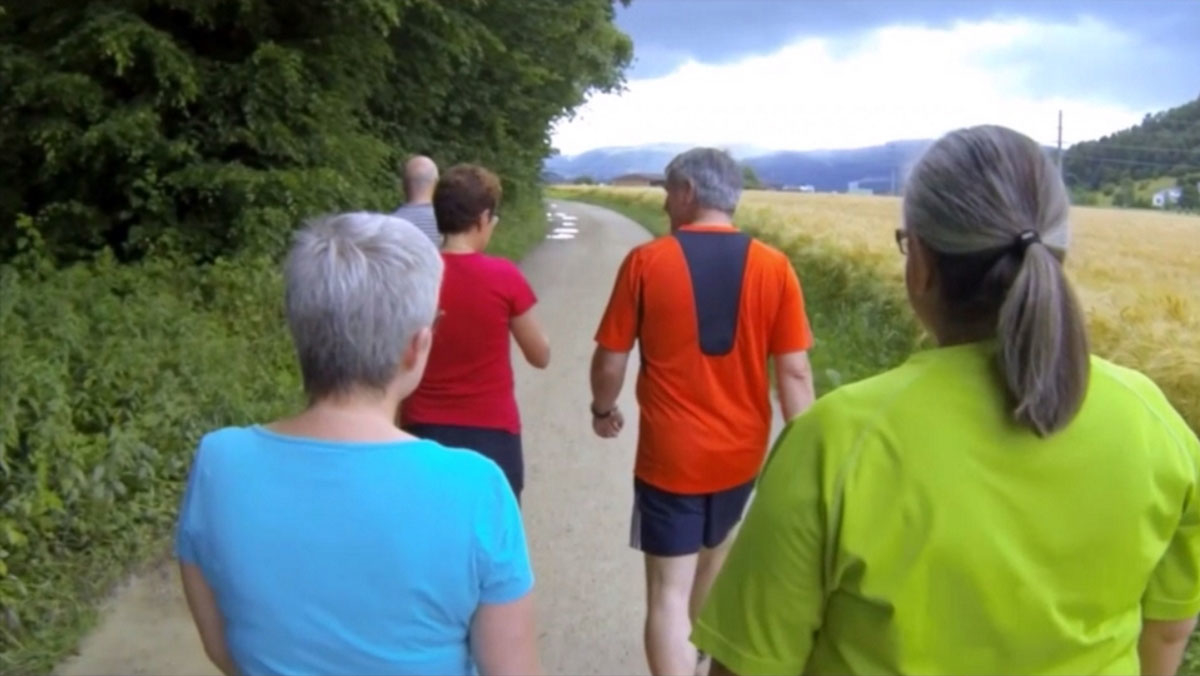
Figure 2 A scene from the video shows the group of five amateur runners, giving the patient the perspective of a person walking within the group.
You will find the video in our channel at Vimeo.
After the exercise test, patients were asked to score their perceived comfort level and their subjective level of physical exertion achieved during the test on a 10-point scale.
Statistical analysis was done using PRISM 6 (GraphPad Software). Student’s t-test was used to compare normally distributed data; a Wilcoxon-Mann-Whitney test was performed to compare non-normal data. To test for significant differences in categorical variables between the groups, Pearson’s chi-square test was used. Between-group differences were considered significant if p ≤0.05.
The study flow chart is shown in figure 3. Of the 109 patients assessed for eligibility, 108 patients were enrolled in the study and randomised. One patient was excluded before randomisation because of recent abdominal surgery. Forty-three patients in both groups ended the test because of exhaustion and were included in the final study analysis. In the video group, six patients were excluded because of chest pain, one because of significant ST-segment changes, one because of severe hypertension and three patients because of leg weakness. In the control image group, one patient had to be excluded because of missing exercise testing data, in one patient the reason for test interruption was not specified, seven patients ended the test due to chest pain and one patient because of a decrease in systolic blood pressure and leg weakness. Thirty-eight in the video group and 36 in the control group were patients of the outpatient clinic. Baseline characteristics were evenly distributed between both groups (table 2).

Figure 3 Flow diagram of the patient enrolment, allocation and analysis.
Table 2 Baseline characteristics of the patients.
| Characteristics |
Video group
(n = 43) |
Image group
(n = 43) |
p-value |
|---|---|---|---|
| Age, yr. | 60.6 ± 16.3 | 60.4 ± 15.1 | 0.97 |
| Female sex, n (%) | 13 (30.2) | 12 (27.9) | 0.81 |
| BMI, kg/m2 | 27.0 ± 4.2 | 27.1 ± 5.1 | 0.89 |
| Medical history, n (%) | |||
| – CAD | 13 (30.2) | 9 (20.9) | 0.32 |
| – Hypertension | 23 (53.5) | 23 (53.5) | 1 |
| – Diabetes mellitus | 2 (4.6) | 6 (13.9) | 0.14 |
| – Pacemaker | 4 (9.3) | 2 (4.6) | 0.40 |
| – LVEF, %* | 61 ± 5.4 | 58 ± 8.8 | 0.05 |
| Medication, n (%) | |||
| – Beta-blocker | 15 (34.8) | 20 (46.5) | 0.27 |
| – Aspirin | 15 (34.8) | 15 (34.8) | 1 |
| – ACE inhibitor or ARB | 17 (39.5) | 25 (58.1) | 0.08 |
| – Statin | 18 (41.8) | 16 (37.2) | 0.66 |
| Smoking, n (%) | |||
| – Never smoked | 27 (62.8) | 31 (72.1) | 0.36 |
| – Current smoker | 15 (34.9) | 11 (25.6) | 0.35 |
| – Former smoker | 1 (0.02) | 1 (0.02) | 1 |
| Exercise testing | |||
| – Maximum age-predicted heart rate, beats/min | 159.0 ± 16.6 | 158.9 ± 15.0 | 0.99 |
| – Age-predicted peak METs | 7.6 ± 1.3 | 7.7 ± 1.4 | 0.56 |
| Outpatient, n (%) | 38 (88.4) | 36 (83.7) | 0.54 |
| Inpatient, n (%) | 5 (11.6) | 7 (16.3) | 0.54 |
ACE = angiotensin-converting enzyme; ARB = angiotensin receptor blocker; BMI = body mass index; CAD = coronary artery disease; LVEF = left ventricular ejection fraction; METs = metabolic equivalents. Plus-minus values are means ± standard deviations. * LVEF was available for 34 patients in each group.
The main study results are shown in table 3. The patients in the video group performed significantly better and achieved a higher exercise capacity (percentage of age-predicted peak METs) compared to the image group (148.6 ± 32.0% vs 135.0 ± 28.9%, p = 0.041). Moreover, the patients in the video group scored significantly higher levels of comfort on the 10-point scale compared to those in the image group (8.4 ± 1.4 vs 7.5 ± 1.7, p = 0.011).
Table 3 Results.
| Results | Video group (n=43) | Image group (n=43) | p-value |
|---|---|---|---|
| Primary endpoints | |||
| Percentage of age-predicted peak METs, % | 149 ± 32 | 135 ± 29 | 0.041 |
| Level of comfort | 8.4 ± 1.4 | 7.5 ± 1.7 | 0.011* |
| Secondary endpoints | |||
| >85% of age-predicted maximum heart rate, n (%) | 38 (88%) | 33 (77%) | 0.155 |
| Exercise duration, min:sec | 11:12 ± 02:54 | 08:54 ± 02:39 | <0.001 |
| Peak RPP ≥30,000, n (%) | 27 (63%) | 21 (49%) | 0.192 |
| Subjective closeness to physical limits achieved | 8.9 ± 0.8 | 8.1 ± 1.5 | 0.005* |
METs = metabolic equivalents; RPP = peak rate pressure product Values are means ± standard deviations. Percentage of age-predicted METs refers to the percentage of the age-predicted peak METs achieved by the participants. Student’s t-test was used to compare normally distributed data; a Wilcoxon-Mann-Whitney test was performed to compare non-normal data. To test for significant differences in categorical variables between the groups, Pearson’s chi-square test was used. Between-group differences were considered significant if p ≤0.05. * indicates non-normally distributed data.
Further analysis showed that patients in the video group exercised for significantly longer. The average test duration was 11:12 ± 2:54 min in the video group versus 8:54 ± 2:39 min in the image group (p <0.001). The analysis of the questionnaire showed significantly higher subjective closeness to their physical limits in the video group (8.9 ± 0.8 vs 8.1 ± 1.5, p = 0.005). There was no difference in the number of patients who reached a peak rate pressure product above 30,000 (27 patients in the video vs 21 in the image group, p = 0.19). Thirty-eight patients in the video group (88%) and 33 patients in the image group (77%) achieved heart rates above 85% of the age-predicted maximum (p = 0.26).
The aim of this randomised controlled trial was to examine the effect of a virtual walking group in exercise treadmill testing on the performance and comfort of patients. We showed that patients watching a virtual walking group while exercising on a treadmill achieved significantly higher exercise capacity, performed for longer, felt more comfortable and achieved higher self-rated closeness to their physical limits than patients looking at a static image. This demonstrates the potential impact of a virtual walking group in treadmill exercise testing and its potential to increase test validity.
Exercise testing is a well-established tool to evaluate heart conditions and is a strong and independent predictor of all-cause and cardiovascular mortality [2–7]. In the new ESC guidelines for Chronic Coronary Syndromes, exercise testing now has a class IIb recommendation for the evaluation of possible coronary artery disease, but it is still widely used for assessing symptoms, blood pressure response and exercise tolerance [1]. Exercise testing is, in contrast to many other diagnostic tests, an inexpensive, widely available, non-invasive technique, and is often well appreciated by patients, which emphasises its importance in clinical practice.
In order to improve the sensitivity of the test, patients should receive an adequate level of exercise stress, commonly measured using the achieved heart rate as a percentage of the age-predicted maximum. These peak exercise parameters depend on the patient’s motivation and on the examining health professional encouraging the patient [19]. Often, patients do not reach their maximum performance level because of a lack of “adequate” motivation.
Our study showed that the intervention of presenting a video during cardiac exercise testing, giving the patient the impression of exercising within a group, may lead to higher performance (14% higher age-predicted peak METs) and longer exercise duration (more than two minutes). Therefore, the video intervention may improve the sensitivity of cardiac exercise testing. This is especially relevant for the evaluation of coronary artery disease, where adequate cardiac exercise stress is needed to provoke electrocardiographic or clinical signs of ischemia.
In the questionnaire, patients in the video group rated their subjective levels of physical exertion achieved as significantly higher. High levels of subjective physical exertion indicate that patients have exceeded the ventilatory threshold and have performed to their individual maximum [20]. This may further support our hypothesis that the video intervention can lead to a higher validity of the test results. Interestingly, although the patients in the video group performed for longer and achieved higher subjective and objective performance levels, they also felt more comfortable during the test.
No differences in the achieved percentage of age-predicted heart rate or the number of patients with a high peak rate pressure product were found, which might be due to the fact that all patients achieved relatively high percentages of age-predicted heart rate. Heart rate increases almost linearly with exercise intensity, but the slope flattens close to the maximum heart rate.
Our findings are in line with previous studies which assessed the effects of encouragement and distraction during exercise testing. Older trials led to the assumption that at least part of muscle fatigue is developed within the central nervous system by showing that mental activity or cheering can diminish the feeling of muscle fatigue [21, 22]. Previously established linking models describe the relationship between attention focus and physical effort, showing that at low exercise intensities the attention focus can be either associative (focusing on bodily sensations) or dissociative (focusing on other tasks not related to the physical activity) [23, 24]. Music and video can thus lead to a more dissociative attention focus during physical exercise and lower ratings of perceived exertion [25]. These findings were more pronounced at low and moderate exercise intensities, whereas at high exercise intensities physiological signals seem to predominate the attention focus [24]. However, Chow et al. showed that a combination of video and music leads to lower ratings of perceived exertion even at high exercise intensities [25]. In this trial, the perceived attention focus was not rated by the patients. Nevertheless, it is likely that the shown video led to some kind of distraction and reduced potential discomfort during the exercise test, as shown by the higher comfort ratings of the patients in the video group.
Other studies have assessed the effects of group-based exercise programs in different settings. It has been shown that adults who exercised in a group-based exercise program did so for a longer time than adults who exercised alone [16, 26]. This group motivation effect may be attributable to social interaction taking place. However, even virtually presented exercise partners have a positive impact on the performance and persistence of patients during physical activity. Studies have demonstrated that an internet partner leads to longer exercise durations [27] and a virtually presented partner in an exergame improves patients’ persistence [17]. Harden et al. stated that “the group” as a specific mode of intervention is efficient in most populations and settings [28]. It must be noted that these trials assessed group effects in training sessions, which might differ from maximum exercise testing. However, exercising in a group can support feelings of competence and relatedness and thereby contribute to one’s intrinsic motivation. Moreover, walking together has an element of companionship [29] and increases the participant’s feeling of safety [30]. A slightly superior partner can lead to longer exercise durations, which is explained by the participant’s attempts to match or exceed the performances of their more capable partner [31]. The video gives the patient the impression of exercising as part of a group, which could generate the ambition of keeping up with the other athletes, thereby leading to higher performance. Also, the video might have made verbal encouragement easier, as it was possible, for example, to encourage the patient to keep walking/running until the house seen in the distance.
The psychological and motivational effects of a video giving the patient the impression of exercising within a group were not assessed in this trial and should be examined in future research.
There are some limitations regarding our study. It is a single centre study with a small sample size. A formal sample size calculation was not done, as recruitment of all eligible patients during the predefined study period was planned. A double-blinded study design was not possible, because of the visible screen and the fact that the examiner has to be close to the patient. However, all examiners were instructed to always encourage the patient to perform to their maximum irrespective of the study group. The patients in our study achieved rather high percentage METs, which could indicate a selection bias towards fit or motivated patients. Furthermore, it is unclear whether the examiners encouraged the patients more than usual, knowing that the exercise test was part of a trial. Nevertheless, comparing the baseline characteristics of our patients with data from the Swiss “Gesundheitsstatistik 2019” [32] and the Swiss Heart Foundation 2016 [33], our patient population seems to have similar characteristics to the same age group among the general population, except for a higher percentage of patients with hypertension. In this trial, subjective outcome measures were assessed. There is no well-validated tool for the assessment of subjective ratings. However, a 10-point scale is a widely used and accepted rating tool.
In conclusion, a virtually presented exercise group during exercise treadmill testing may lead to higher achieved exercise levels and longer test durations and may thereby improve the validity of the test results. Furthermore, a virtually presented walking group may be an easy and cost-efficient way to enhance patient comfort during exercise testing. The results of this small, open-label study need to be confirmed in a larger trial.
We would like to thank Dr Silke Küest, Dr Beatrice Hirt-Moch and Dr Isabel Hertrich, who performed some of the exercise stress tests. We also thank the “Alte Kantonsschule Aarau” for their help and support within the high school project. We are grateful to the Department of Medicine, which allowed this study to be performed and provided personal and infrastructural support.
No financial support for this article was reported.
JB reports grants from the Swiss National foundation for Science and the Swiss Heart Foundation.
1 Knuuti J , Wijns W , Saraste A , Capodanno D , Barbato E , Funck-Brentano C , et al.; ESC Scientific Document Group. 2019 ESC Guidelines for the diagnosis and management of chronic coronary syndromes. Eur Heart J. 2020;41(3):407–77. doi:.https://doi.org/10.1093/eurheartj/ehz425
2 Myers J , Prakash M , Froelicher V , Do D , Partington S , Atwood JE . Exercise capacity and mortality among men referred for exercise testing. N Engl J Med. 2002;346(11):793–801. doi:.https://doi.org/10.1056/NEJMoa011858
3 Kligfield P , Lauer MS . Exercise electrocardiogram testing: beyond the ST segment. Circulation. 2006;114(19):2070–82. doi:.https://doi.org/10.1161/CIRCULATIONAHA.105.561944
4 Gulati M , Black HR , Shaw LJ , Arnsdorf MF , Merz CN , Lauer MS , et al. The prognostic value of a nomogram for exercise capacity in women. N Engl J Med. 2005;353(5):468–75. doi:.https://doi.org/10.1056/NEJMoa044154
5 Gulati M , Pandey DK , Arnsdorf MF , Lauderdale DS , Thisted RA , Wicklund RH , et al. Exercise capacity and the risk of death in women: the St James Women Take Heart Project. Circulation. 2003;108(13):1554–9. doi:.https://doi.org/10.1161/01.CIR.0000091080.57509.E9
6 Wei M , Kampert JB , Barlow CE , Nichaman MZ , Gibbons LW , Paffenbarger RS, Jr , et al. Relationship between low cardiorespiratory fitness and mortality in normal-weight, overweight, and obese men. JAMA. 1999;282(16):1547–53. doi:.https://doi.org/10.1001/jama.282.16.1547
7 Blair SN , Kohl HW, 3rd , Paffenbarger RS, Jr , Clark DG , Cooper KH , Gibbons LW . Physical fitness and all-cause mortality. A prospective study of healthy men and women. JAMA. 1989;262(17):2395–401. doi:.https://doi.org/10.1001/jama.1989.03430170057028
8 Montalescot G , Sechtem U , Achenbach S , Andreotti F , Arden C , Budaj A , et al., Document Reviewers. 2013 ESC guidelines on the management of stable coronary artery disease: the Task Force on the management of stable coronary artery disease of the European Society of Cardiology. Eur Heart J. 2013;34(38):2949–3003. doi:.https://doi.org/10.1093/eurheartj/eht296
9 Gibbons RJ , Balady GJ , Bricker JT , Chaitman BR , Fletcher GF , Froelicher VF , et al., American College of Cardiology/American Heart Association Task Force on Practice Guidelines. Committee to Update the 1997 Exercise Testing Guidelines. ACC/AHA 2002 guideline update for exercise testing: summary article. A report of the American College of Cardiology/American Heart Association Task Force on Practice Guidelines (Committee to Update the 1997 Exercise Testing Guidelines). J Am Coll Cardiol. 2002;40(8):1531–40. doi:.https://doi.org/10.1016/S0735-1097(02)02164-2
10 Bourque JM , Holland BH , Watson DD , Beller GA . Achieving an exercise workload of > or = 10 metabolic equivalents predicts a very low risk of inducible ischemia: does myocardial perfusion imaging have a role? J Am Coll Cardiol. 2009;54(6):538–45. doi:.https://doi.org/10.1016/j.jacc.2009.04.042
11 Ekelund LG , Haskell WL , Johnson JL , Whaley FS , Criqui MH , Sheps DS . Physical fitness as a predictor of cardiovascular mortality in asymptomatic North American men. The Lipid Research Clinics Mortality Follow-up Study. N Engl J Med. 1988;319(21):1379–84. doi:.https://doi.org/10.1056/NEJM198811243192104
12 Andreacci JL , LeMura LM , Cohen SL , Urbansky EA , Chelland SA , Von Duvillard SP . The effects of frequency of encouragement on performance during maximal exercise testing. J Sports Sci. 2002;20(4):345–52. doi:.https://doi.org/10.1080/026404102753576125
13 Neto JMD , Silva FB , de Oliveira ALB , Couto NL , Dantas EHM , de Luca Nascimento MA . Effects of verbal encouragement on performance of the multistage 20 m shuttle run. Acta Scientiarum Health Science. 2015;37:25–30. doi:https://doi.org/10.4025/actascihealthsci.v37i1.23262
14Schmidt RA, Lee TD. Motor learning and performance. Fifth edition. Leeds: Human Kinetics; 2014.
15 Burke SM , Carron AV , Eys MA , Ntoumanis N , Estabrooks PA . Group versus individual approach? A meta-analysis of the effectiveness of interventions to promote physical activity. Sport Exerc Psychol Rev. 2006;2:19–35.
16 Firestone MJ , Yi SS , Bartley KF , Eisenhower DL . Perceptions and the role of group exercise among New York City adults, 2010-2011: an examination of interpersonal factors and leisure-time physical activity. Prev Med. 2015;72:50–5. doi:.https://doi.org/10.1016/j.ypmed.2015.01.001
17 Feltz DL , Irwin B , Kerr N . Two-player partnered exergame for obesity prevention: using discrepancy in players’ abilities as a strategy to motivate physical activity. J Diabetes Sci Technol. 2012;6(4):820–7. doi:.https://doi.org/10.1177/193229681200600413
18Glass S, Dwyer GB; the America College of Sports Medicine. ACSM'S metabolic calculations handbook. Philaddelphia, PA: Lippincott Williams & Wilkins; 2007.
19 Clark AL , Poole-Wilson PA , Coats AJ . Effects of motivation of the patient on indices of exercise capacity in chronic heart failure. Br Heart J. 1994;71(2):162–5. doi:.https://doi.org/10.1136/hrt.71.2.162
20 Fletcher GF , Balady GJ , Amsterdam EA , Chaitman B , Eckel R , Fleg J , et al. Exercise standards for testing and training: a statement for healthcare professionals from the American Heart Association. Circulation. 2001;104(14):1694–740. doi:.https://doi.org/10.1161/hc3901.095960
21 Asmussen E , Mazin B . Recuperation after muscular fatigue by “diverting activities”. Eur J Appl Physiol Occup Physiol. 1978;38(1):1–7. doi:.https://doi.org/10.1007/BF00436747
22 McNair PJ , Depledge J , Brettkelly M , Stanley SN . Verbal encouragement: effects on maximum effort voluntary muscle action. Br J Sports Med. 1996;30(3):243–5. doi:.https://doi.org/10.1136/bjsm.30.3.243
23Tenenbaum G. A social-cognitive perspective of perceived exertion and exertion tolerance. Handbook of sport psychology 2001; 2: 810–820.
24 Rejeski WJ . Perceived exertion: An active or passive process? J Sport Exerc Psychol. 1985;7:371–8.
25 Chow EC , Etnier JL . Effects of music and video on perceived exertion during high-intensity exercise. J Sport Health Sci. 2017;6(1):81–8. doi:.https://doi.org/10.1016/j.jshs.2015.12.007
26 Yokoyama N , Nisijima T , Maeda S , Kuno S , Ajisaka R , Matsuda M . Effect Of Exercise Program Participation On Personal Factors Of Exercise Adherence Promotion In Middle-Aged And Elderly Subjects. Japanese Journal of Physical Fitness and Sports Medicine. 2003;52(Supplement):249–57. doi:.https://doi.org/10.7600/jspfsm1949.52.Supplement_249
27 Irwin BC , Feltz DL , Kerr NL . Silence is golden: effect of encouragement in motivating the weak link in an online exercise video game. J Med Internet Res. 2013;15(6):e104. doi:.https://doi.org/10.2196/jmir.2551
28 Harden SM , McEwan D , Sylvester BD , Kaulius M , Ruissen G , Burke SM , et al. Understanding for whom, under what conditions, and how group-based physical activity interventions are successful: a realist review. BMC Public Health. 2015;15(1):958. doi:.https://doi.org/10.1186/s12889-015-2270-8
29 Doughty K . Walking together: the embodied and mobile production of a therapeutic landscape. Health Place. 2013;24:140–6. doi:.https://doi.org/10.1016/j.healthplace.2013.08.009
30 Mason OJ , Holt R . Mental health and physical activity interventions: a review of the qualitative literature. J Ment Health. 2012;21(3):274–84. doi:.https://doi.org/10.3109/09638237.2011.648344
31Stroebe W, Diehl M, Abakoumkin G. Social compensation and the Köhler effect: Toward a theoretical explanation of motivation gains in group productivity. In: Witte EH, Davis JH (Eds.), Understanding group behavior. Vol. 2. Small group processes and interpersonal relations. New Jersey: Lawrence Erlbaum Associates; 1996. p 37–65.
32Andreani T, Marquis JF. Gesundheitsstatistik 2019. https://www.bfs.admin.ch/bfsstatic/dam/assets/10227275/master [Cited 29 2020 April 29].
33Zellweger U, Bopp M. Zahlen und Daten über Herz-Kreislauf-Krankheiten in der Schweiz, (2016). https://www.swissheart.ch/fileadmin/user_upload/Swissheart/Bilder_Inhalt/5.0_Ueber_uns/5.1_Aufgaben_u_Aktivitaeten/HerzStatistik.pdf.
No financial support for this article was reported.
JB reports grants from the Swiss National foundation for Science and the Swiss Heart Foundation.