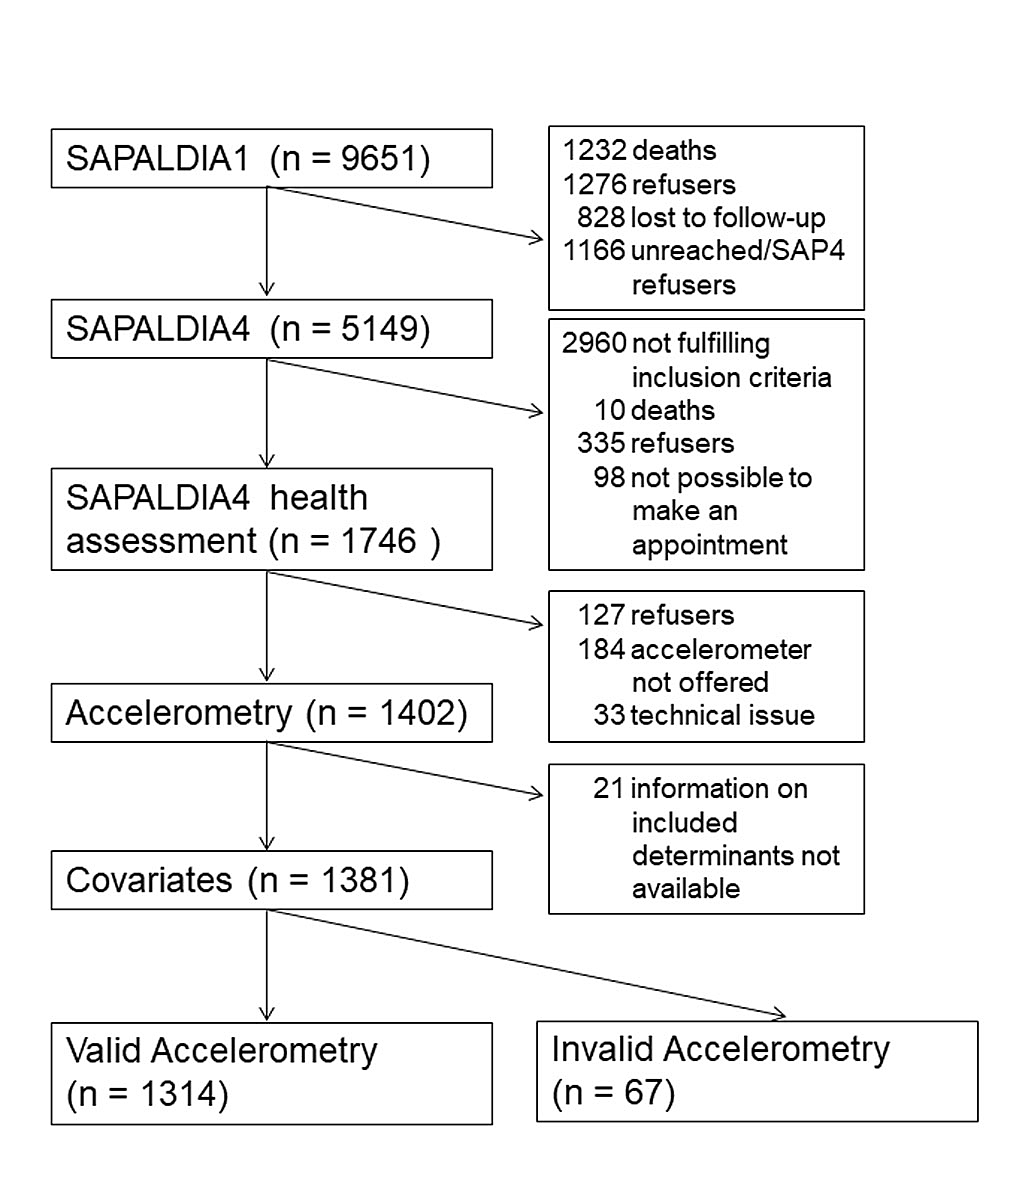
Figure 1 Participation from SAPALDIA1 to the current accelerometry study among participants aged 52+ at SAPALDIA4 (1991–2018).
DOI: https://doi.org/10.4414/smw.2020.20266
becoming active
becoming inactive
Body Mass Index
light physical activity
moderate physical activity
moderate-to-vigorous physical activity
non-communicable disease: PA = physical activity
remaining active
remaining inactive
Swiss Cohort on Air Pollution And Lung and Heart Disease In Adults
sedentary behaviour
uncertainty interval
vigorous physical activity
In Switzerland, non-communicable diseases (NCDs) accounted for 90.2% (95% uncertainty interval [UI] 89.9–90.5%) of deaths in 2017 [1]. The most important, but not modifiable, risk factor for NCDs is the ageing of the population; the latter accounted for 19.5% (95% UI 17.3–22.0%) more deaths between 2006 and 2016 [2]. Several personally and not personally modifiable risk factors, such as dietary risks, tobacco consumption, air pollution, and low physical activity (PA), as well as excess weight also contribute to NCD risk and are important targets for primary prevention [2].
Low PA is of particular interest as people can be positively encouraged to engage in a health promoting behaviour, whereas for most other NCD determinants recommendations go in the direction of prohibition. Remaining physically active reduces all-cause mortality [3]. Physical inactivity increases the risk of several diseases, such as type 2 diabetes [4], cardiovascular disease [5] and chronic obstructive pulmonary disease [6], as well as mental disorders such as depression [7]. Sedentary behaviour (SB) is increasingly recognised as having adverse health effects even in people who engage in moderate and vigorous levels of PA [8]. Most importantly and of particular relevance for the older part of populations, SB has been shown to have a negative impact on frailty in elderly [9] and on all-cause as well as cardiovascular mortality [10].
Effective PA promotion relies on an in-depth understanding of the distribution of PA and SB in population subgroups. So far, several studies have looked at correlates of PA and SB in older adults. As a first limitation, most of them were of cross-sectional design [11]. Cohort studies are of great value for studying longitudinal course and persistency of lifestyle patterns, as it is ultimately the chronicity of lifestyle that influences health and disease. Cohort studies also help to identify life course periods such as retirement [12] where people are particularly susceptible to decreasing PA or receptive to increasing PA. These studies then also help to identify determinants of temporal PA changes [13]. A second limitation of many studies was their relying on self-reported PA and SB. The validity of self-reported observations is hampered by recall bias, social desirability and the lack of precision in rating PA intensities. These problems are likely leading to an overestimation of vigorous PA (VPA) [14]. Therefore, objectively measured PA and SB is a reliable alternative. Finally, PA differs between [15] and also within countries and cultures [16], making it difficult to transfer observed PA patterns from one country to another.
There is a lack of knowledge about objectively measured PA patterns in older Swiss adults and little is known about the existence of subgroups at increased risk of inactivity. According to the Swiss Health Survey, 76% of Swiss residents above 15 years of age reported sufficient activity according to Swiss recommendations for subjectively assessed PA [17]. In the subgroup of persons 55 years and older, the percentage meeting these recommendations ranged from 58% in 75+-year-old females to 82% in 65- to 74-year-old males [18]. The above studies relied on self-reported PA, for which the Swiss PA recommendations advise spending at least 150 minutes per week in moderate PA (MPA) or 75 minutes in VPA [19]. Despite being developed on the basis of self-reported data, these recommendations are also widely used in accelerometer studies [20–22].
Therefore, general population data including objectively measured PA data collected in the context of the SAPALDIA cohort was applied to (a) investigate the distribution of mean minutes spent in different PA levels including SB in the older part of the Swiss population and subgroups thereof; (b) understand to what degree these population groups meet Swiss recommendations for PA; and (c) test if self-reported PA patterns over a period of 10 years are predicting objectively measured PA 7 years later. SAPALDIA participants come from different geographical and cultural contexts in Switzerland. Cultural differences in Switzerland are related to the three language regions, but could also refer to different lifestyles and attitudes [23].
This study was embedded into the Swiss Cohort on Air Pollution And Lung and Heart Disease In Adults (SAPALDIA). SAPALDIA was initiated in 1991, when random samples of persons aged 18 to 60 were selected from population registries in eight geographically and culturally different Swiss regions (Basel, Wald, Davos, Lugano, Montana, Payerne, Aarau, Geneva) [24]. Baseline participants (SAPALDIA1; n = 9651) were invited for follow-up interviews and examinations three times for SAPALDIA2 in 2001/2002 (n = 8047), SAPALDIA3 in 2010/2011 (n = 6088), and SAPALDIA4 in 2017/2018 (n = 5149). In the third follow-up (SAPALDIA4), participants aged 52 years and older were invited for a 52+ health assessment. The 52+ participants were also invited to wear an accelerometer for at least 8 days prior to the health assessment. 1746 participants underwent a 52+ health assessment at a local study centre and 1402 52+ participants also completed the accelerometer data collection.
The SAPALDIA cohort study protocol complies with the Declaration of Helsinki. All participants provided written informed consent at each survey. Ethical approval was obtained from the Ethics Committee northwest/central Switzerland (EKNZ) as lead agents (EKNZ PB_2016-02348) as well as from the respective regional ethics committees.
The main outcomes of the study were the minutes per day spent in the different PA levels, including SB, which were objectively measured using the accelerometer model ActiGraph wGT3X-BT. ActiGraph accelerometers measure on three axes with a dynamic range of ± 8 G [25]. In this study, only data from the vertical axis were analysed for reasons of comparability with published studies [20, 26]. The data was measured by a 12 bit analogue to a digital converter at a rate of 30 Hz [25]. The participants were instructed to wear the accelerometer on the right hip either above or below their clothes during the daytime over a period of 8 days. Participants were instructed not to wear the device while performing water activities, such as taking a shower or swimming. Participants filled in a diary during the time that they were wearing the accelerometer, indicating particular periods when the device was not worn. ActiLife software (v6.13.3) was used to extract and score data recorded with an epoch time of 5 seconds. A non-wear period was defined as zero counts for 60 minutes with a tolerance of 2 minutes [27]. For scoring of PA, different cut offs were defined, based on Troiano et al. [28] as depicted in table 1. Accelerometry data was considered valid for days where the accelerometer was worn for at least 10 hours [28] and for participants providing data for at least four valid days with a minimum of three weekdays and a minimum of one weekend day as recommended by Trost et al. [30].
Table 1 Definition of cut offs used for physical activity intensities.
| Intensity | Counts per minute | Metabolic equivalent of task | Activity example |
|---|---|---|---|
| Sedentary | 0–99 | >1.5 | Sitting |
| Light | 100–2019 | 1.5–3 | Casual walking* |
| Moderate | 2020–5998 | 3–5.99 | Brisk walking* |
| Vigorous | ≥5999 | ≥6 | Running* |
* US Department of Health and Human Services [29]
Self-reported PA at SAPALDIA2 and SAPALDIA3 were investigated as predictors of the primary endpoint (objectively measured PA at SAPALDIA4). Self-reported PA was assessed with the help of standardised and validated [31] questionnaires (long International Physical Activity Questionnaire [32]) in the first and the second follow-up. Based on self-reported minutes spent in MPA and VPA, participants were categorised into those “meeting the recommendations” and those “not meeting the recommendations” in SAPALDIA2 and SAPALDIA3. Based on the changes in fulfilling versus not fulfilling the recommendations from SAPALDIA2 to SAPALDIA3, predictive PA was derived and grouped into four categories: remaining inactive (RI), becoming inactive (BI), becoming active (BA) and remaining active (RA), as described elsewhere [33].
Information on sex, residential language region (Swiss German; French; Italian) and education level (low: primary school; medium: secondary school, middle school or apprenticeship; high: technical college or university) was derived from the baseline questionnaire. Age (categorised into 52–64, 65–74 and ≥75 years), employment status (employed, house person, pensioner and other) and civil status (married [including registered relationship], divorced [including living apart], widowed [including partner died] and single) as well as smoking status (never, former and current) were derived from a questionnaire administered at the third follow-up (SAPALDIA4), when accelerometry was applied. Body mass index (BMI; weight in kg / height in m squared) was derived from measurements at SAPALDIA4 and categorised into: normal/underweight: BMI <18.5–24.9 kg/m2 (only 0.9% of participants were underweight) and overweight: 25.0–29.9 kg/m2; obese: ≥30 kg/m2). All covariates were considered as categorical variables.
All analyses were done using STATA/IC 15.1. In a first step to evaluate participation bias, we compared characteristics at baseline (SAPALDIA1) for those participating in the SAPALDIA4-52+-assessment and those who did not participate in the accelerometry study, but had attained age 52+ at the time of SAPALDIA4, using a logistic regression model (supplementary table S1 in appendix 1).
In a second step, chi2-tests were performed to evaluate bias due to invalid accelerometry data. We compared characteristics of SAPALDIA4 52+ participants providing valid versus non-valid accelerometry data. Participants with invalid data were excluded from further analyses.
In a third step, the distribution by sex and age for SB and PA determinants (BMI, language, education, civil, employment and smoking status) were analysed, using chi2-tests.
Next, the distribution of SB and PA in the overall study population was calculated as average daily minutes spent in the respective PA intensity, stratified by sex and age. This allowed assessment of the time spent in each intensity by participants. In addition, the total percentage of participants fulfilling the Swiss recommendations for PA was determined. The characteristics of the participants who fulfilled the Swiss recommendations for PA were then compared to the ones who did not fulfil them, using univariate logistic regression.
In a fifth step, the determinants of PA and SB were assessed in the context of three separate linear regression models assessing associations of covariates with (1) SB, (2) light PA (LPA), and (3) moderate-to-vigorous PA (MVPA), respectively. We first tested the association of each covariate with these outcomes separately in the context of univariate regression models (table S2). We next tested the mutually adjusted associations of the covariates with these outcomes in the context of multiple linear regression models. Association results are presented as (adjusted) mean minutes spent in the three different PA intensities according to covariate level. Because of skewness of the residuals in MVPA, bootstrap methods had to be applied using 1000 bootstrap samples, a very general technique that allowed us to derive confidence intervals making only very limited assumptions about the probability distribution of the outcome [34]. All models were adjusted for wear time and season. Effect modification by sex (categorical), age (categorical), BMI (categorical) and smoking (categorical) was tested by including according interaction terms with all covariates in the models. Using backward selection, interactions not reaching the significance level of 0.05 were excluded from the regression models. All analyses including linear regression and bootstrap methods took into account inverse probability weighting in order to control for unbalanced missing data across the different categories of the determinants.
In a last step, predictive analyses were performed to investigate the predictive association of the four long-term PA categories (RI, BI, BA, RA) derived from self-reports at SAPALDIA2 and SAPALDIA3, roughly 10 years apart, with objectively measured PA at SAPALDIA4 7 years later. These three predictive multiple linear regression models (one for each PA level) contained the same covariates as the cross-sectional models. Results are reported as adjusted mean minutes spent in the different PA intensities.
All SAPALDIA4 participants aged 52+ who took part in the accelerometer examination and additionally provided information on all relevant covariates were included in the first and second step of the analysis (n = 1381; fig. 1).
Figure 1 Participation from SAPALDIA1 to the current accelerometry study among participants aged 52+ at SAPALDIA4 (1991–2018).
Participants in the accelerometry study whose data were not valid (n = 67) differed only in BMI and civil status from subjects with valid data (supplementary table S2 in appendix 1). Participants with non-valid data were excluded from further analyses. Overall, 1314 participants with valid accelerometry data were included in the subsequent analyses. Table 2 depicts the characteristics of these participants, of whom 51.3% were male and 48.7% female. The mean age of the participants was 67.9 years (standard deviation [SD] 7.9). Whereas 41.3% and 40.1% of the participants were normal/underweight and overweight, respectively, only 18.6% were in the obese group. The participants represented the three language regions of Switzerland. The distribution of education and civil status differed for males and females in all age groups. The proportion of males having higher education was greater than the proportion of females, in all age groups. In the youngest age category, a higher proportion of males were married compared with their female counterparts and the proportion of being a house person was greater in females than in males. Smoking status and BMI were equally distributed in the youngest and oldest age groups, respectively.
Table 2 Characteristics of participants in the SAPALDIA4 55+ accelerometer sub-study, by sex and age group.
| Age categories | ||||||||||
|---|---|---|---|---|---|---|---|---|---|---|
| 52–64 | 74 | 75+ | ||||||||
|
Male
(n = 222) |
Female
(n = 231) |
p-value* |
Male
(n = 311) |
Female
(n = 287) |
p-value* |
Male
(n = 141) |
Female
(n = 122) |
p-value* | ||
| n | % | % | % | % | % | % | ||||
| Language region | ||||||||||
| German | 721 | 53.6 | 47.6 | 59.2 | 55.1 | 58.2 | 55.7 | |||
| French | 444 | 36.9 | 42.0 | 30.2 | 31.4 | 28.4 | 33.6 | |||
| Italian | 149 | 9.5 | 10.4 | 0.44 | 10.6 | 13.6 | 0.45 | 13.5 | 10.7 | 0.58 |
| BMI (kg/m2) | ||||||||||
| <25 | 543 | 31.1 | 61.9 | 28.6 | 47.7 | 38.3 | 41.8 | |||
| 25–30 | 527 | 49.1 | 26.8 | 52.4 | 30.7 | 43.3 | 36.1 | |||
| >30 | 244 | 19.8 | 11.3 | <0.001 | 19.0 | 21.6 | <0.001 | 18.4 | 22.1 | 0.47 |
| Education level | ||||||||||
| Low | 39 | 1.8 | 1.7 | 1.6 | 5.6 | 1.4 | 6.6 | |||
| Middle | 826 | 53.2 | 73.6 | 53.7 | 72.1 | 52.5 | 73.8 | |||
| High | 449 | 45.0 | 24.7 | <0.001 | 44.7 | 22.3 | <0.001 | 46.1 | 19.7 | <0.001 |
| Employment status | ||||||||||
| Employed | 425 | 86.9 | 76.2 | 11.3 | 5.9 | 1.4 | 1.6 | |||
| House person | 38 | 0.5 | 10.4 | 0.6 | 3.1 | 0.0 | 1.6 | |||
| Pensioner | 827 | 8.1 | 8.2 | 87.8 | 90.6 | 98.6 | 96.7 | |||
| Other | 24 | 4.5 | 5.2 | <0.001 | 0.3 | 0.3 | 0.02 | 0.0 | 0.0 | 0.31 |
| Civil status | ||||||||||
| Married | 871 | 73.9 | 60.6 | 78.1 | 57.5 | 76.6 | 41.8 | |||
| Divorced | 201 | 14.9 | 18.2 | 11.9 | 22.6 | 8.5 | 9.8 | |||
| Widowed | 120 | 0.9 | 7.4 | 4.2 | 9.8 | 9.9 | 37.7 | |||
| Single | 122 | 10.4 | 13.9 | 0.001 | 5.8 | 10.1 | <0.001 | 5.0 | 10.7 | <0.001 |
| Smoking status | ||||||||||
| Never | 549 | 40.5 | 46.8 | 35.0 | 44.6 | 30.5 | 58.2 | |||
| Former | 591 | 41.0 | 34.2 | 51.4 | 46.0 | 61.0 | 35.2 | |||
| Current | 174 | 18.5 | 19.0 | 0.30 | 13.5 | 9.4 | 0.04 | 8.5 | 6.6 | <0.001 |
* Comparison of sex using chi2 test
Figure 2 shows how much time the participants spent in SB, LPA and MVPA during a whole day. Most of the time they were in a sedentary state, and for only around 5% of the daytime were they engaged in MVPA.

Figure 2 Average daily minutes (number in boxes) and percent of accelerometer measuring time (x-axis) spent in different levels of physical activity intensity, by sex and age group (n = 1314).
In table 3, the mean number of minutes spent in different PA levels are presented according to mutually adjusted participant characteristics and additionally adjusted for wear time and season. PA level differences were observed with regard to sex, age, BMI and smoking status. Females tended to have less SB and MVPA whilst having more LPA compared with males. Participants aged 75+, obese participants and smokers were more likely to have a sedentary lifestyle and were less likely to spend time in LPA and MVPA compared with their youngest counterparts, the under- and normal-weight participants and non-smokers, respectively. Interestingly, MVPA differed by the residential language region. Swiss residents living in the German part spent more time in MVPA compared with residents living in the French and Italian parts of Switzerland. Moreover, the civil status was observed to be a determinant for SB and LPA. Age, sex, BMI and smoking did not modify any of the above associations. The non-weighted analyses were comparable to the weighted results (data not presented).
Table 3 Mutually adjusted mean minutes per day† spent in specific levels of physical activity intensity (n = 1314), according to patient characteristics‡.
| Sedentary§ | Light¶ | Moderate-to-vigorous‖ | |
|---|---|---|---|
| Adjusted mean (95% CI) | Adjusted mean (95% CI) | Adjusted mean (95% CI) | |
| Sex | |||
| Male (ref.) | 693.4 (688.4–698.4) | 130.1 (126.5–133.8) | 41.3 (38.7–43.6) |
| Female | 671.8 (667.0–676.6)*** | 155.5 (151.8–159.2)*** | 37.6 (35.5–39.7)* |
| Age | |||
| 52–64 (ref.) | 665.9 (657.6–674.3) | 151.6 (145.4–157.9) | 47.2 (43.4–50.9) |
| 65–74 | 675.6 (670.5–680.7) | 146.8 (143.0–150.7) | 42.4 (39.9–45.2)* |
| 75+ | 708.4 (700.7–716.0)*** | 129.6 (123.9–135.4)*** | 26.9 (23.6–30.6)*** |
| BMI (kg/m2) | |||
| <25 (ref.) | 672.3 (666.8–675.0) | 145.8 (141.8–149.9) | 46.7 (44.1–49.3) |
| 25–29.9 | 679.7 (675.0–684.5)* | 145.5 (141.9–149.1) | 39.6 (37.3–41.8)*** |
| ≥30 | 700.9 (693.8–708.1)*** | 135.9 (130.5–141.3)** | 28.0 (25.2–31.2)*** |
| Language region | |||
| German (ref.) | 682.6 (678.3–686.9) | 140.5 (137.4–143.6) | 41.7 (39.4–44.0) |
| French | 682.7 (677.3–688.1) | 145.5 (141.3–149.7) | 36.6 (34.3–39.1)** |
| Italian | 679.0 (669.8–688.2) | 148.1 (140.8–155.4) | 37.7 (34.5–40.9)* |
| Employment | |||
| Employed (ref.) | 685.3 (677.0–693.6) | 139.7 (133.6–145.9) | 39.8 (36.2–43.7) |
| House person | 682.3 (662.6–702.0) | 147.4 (132.8–161.9) | 35.4 (28.0–44.3) |
| Pensioner | 679.9 (675.2–684.6) | 145.2 (141.6–148.8) | 39.7 (37.4–41.9) |
| Other | 714.5 (690.2–738.8)* | 124.0 (105.1–143.0) | 26.5 (17.2–36.7)* |
| Education level | |||
| Low (ref.) | 678.7 (661.0–696.4) | 148.1 (134.6–161.6) | 38.1 (32.2–44.4) |
| Middle | 679.7 (675.6–683.7) | 145.6 (142.6–148.7) | 39.5 (37.6–41.4) |
| High | 688.9 (683.8–697.1) | 136.7 (132.9–140.5) | 39.3 (36.7–42.2) |
| Civil status | |||
| Married (ref.) | 678.6 (674.4–682.9) | 146.3 (143.1–149.6) | 39.9 (37.9–41.8) |
| Divorced | 685.9 (676.6–695.3) | 139.5 (132.6–146.4) | 39.4 (35.5–43.7) |
| Widowed | 687.5 (678.3–696.7) | 138.8 (131.9–145.7) | 38.4 (34.5–42.9) |
| Single | 692.0 (683.8–700.1)** | 135.6 (129.6–141.5)** | 37.3 (32.8–41.8) |
| Smoking status | |||
| Never (ref.) | 677.8 (673.3–682.3) | 146.0 (142.6–149.4) | 41.0 (38.9–43.0) |
| Former | 680.6 (675.4–685.8) | 144.5 (140.6–148.4) | 39.8 (37.3–42.1) |
| Current | 696.7 (688.0–705.5)*** | 133.7 (127.3–140.1)** | 34.3 (30.2–38.2)** |
| Season | |||
| Spring (ref.) | 676.3 (667.9–684.6) | 148.9 (142.4–155.4) | 39.8 (35.9–44.1) |
| Summer | 680.2 (671.8–688.7) | 146.7 (140.2–153.1) | 38.0 (34.4–41.8) |
| Autumn | 680.8 (676.0–685.6) | 144.2 (140.6–147.7) | 39.9 (37.4–42.1) |
| Winter | 687.1 (681.0–693.2)* | 138.4 (133.9–142.9)** | 39.2 (36.6–41.8) |
CI = confidence interval; CPM = counts per minute; ref. = reference * p-value ≤0.05; ** p-value ≤0.01; *** p-value ≤0.001 † Adjusted mean minutes were derived from three separate multiple linear regression models, one for each level of physical activity, containing all the listed covariates as independent variables ‡ In addition adjusted for wear time § 0–99 CPM ¶ 100–2019 CPM ‖ ≥2020 CPM
Overall, 21.7% of the participants fulfilled the Swiss recommendations for PA. The recommendations were less likely to be fulfilled by subjects aged 75+, by overweight or obese participants, by Swiss residents living in the French or Italian speaking region, by current smokers and by widowed compared with participants who were between 52–64 years old, of normal weight, from the German speaking part, non-smokers and married (fig. 3).

Figure 3 Number (boxes) and percent (x-axis) of participants meeting the Swiss recommendations for Physical Activity (150 minutes in moderate physical activity or 75 minutes in vigorous physical activity) according to participant characteristics using logistic regression. An asterisk * indicates a statistically significant difference between the groups at p-value ≤0.05.
Participants who self-reportedly remained active over a period of about 10 years from SAPALDIA2-3 were ,7 years later, less likely to spend time in a sedentary state and more likely to spend time in LPA and MVPA than those self-reporting less consistent PA patterns (fig. 4, table S4). Participants remaining active spent 25.17 (17.22–33.10) minutes per day less in SB, and 12.34 (6.66–18.02) minutes per day and 11.74 (8.98–14.50) minutes per day more in LPA and MVPA, respectively, compared to participants remaining inactive. We observed consistent trends for decreasing SB and increasing LPA and MVPA from those remaining inactive, to those becoming inactive, becoming active, and remaining active.
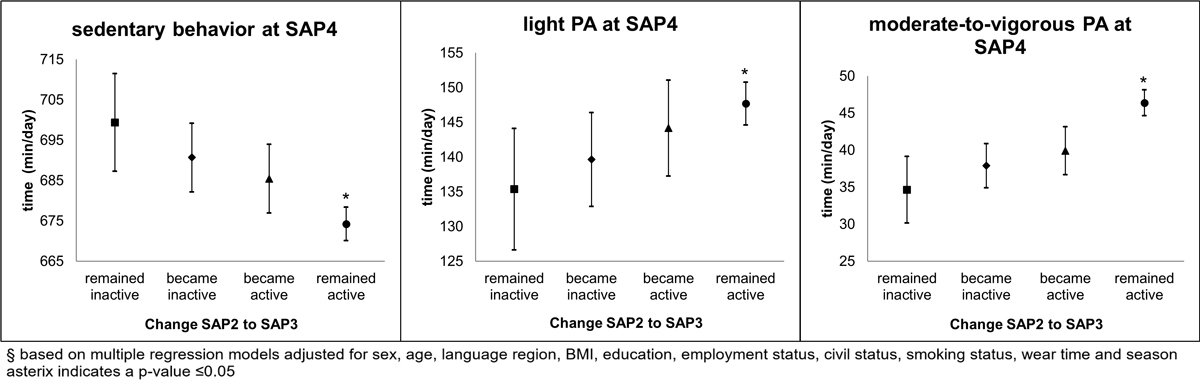
Figure 4 Adjusted mean minutes per day in specific levels of physical activity intensity objectively measured at SAPALDIA4 (2017/18), according to self-reported moderate-to-vigorous physical activity change patterns from SAPALDIA2 (2001/02) to SAPALDIA3 (2010/11) (remained inactive n = 87; became inactive n = 162; became active n = 175; remained active = 729 according to Swiss recommendation for Physical Activity cut-offs). All analyses were adjusted for sex, age, body mass index, language region, education, employment status, civil status, smoking status, wear time and season An asterisk * indicates a p-value of ≤0.05.
The main results of this study showed that patterns of PA levels in a Swiss general population sample aged 52+ depended especially on age, BMI, smoking and sex at lower levels of PA, whereas MVPA intensity differed by language region and SB by civil status. We expected to find socioeconomic differences, but no association was found for educational level. A rather high percentage of the participants met the recommendations of Swiss PA guidelines.
Comparison of the results of this accelerometry-based study with those for self-reported PA obtained in the population-representative Swiss Health Survey 2017 showed that our results for the main correlates of PA are principally in line [17]. According to the Swiss Health Survey, it was estimated that 76% of adults were sufficiently active, meaning that they met the Swiss PA recommendations [17]. The prevalence decreased from 73.7% in older adults between 55 and 64 years old to 64.4% in those aged 75+ year [18]. Thus, the observed age trend was similar to the one in this current study, but the overall prevalences of PA were higher. The higher prevalence of being categorised as physically active in the Swiss Health Survey is most likely explained by the fact that subjective measurements are prone to recall and response bias [35] and generally lead to an overestimation of PA and an underestimation of SB compared with objectively obtained data [31, 36].
The overestimation of PA might mask association with determinants, such as education, if the overestimation differs by persons in the subgroups. Previous studies, including our own, observed that the difference in PA according to educational level was smaller when PA was measured objectively as compared with self reports [37, 38]. This is also what we see when comparing our results with the Swiss Health Survey. In contrast to our data, the Swiss Health Survey pointed out the importance of educational background related to PA [17]. Whereas 61% of Swiss residents having a low education level were sufficiently active, this was true for 79% of highly educated residents. However, as socio-demographic differences are also inconsistently observed between studies that relied on objectively measured PA, more research considering a range of socio-demographic factors is needed to improve understanding of how these factors impact on PA in a culture- as well as social- and physical environment-specific context.
Previously reported prevalences of fulfilling recommendation for subjective PA ranged from 1% to 31% in older adults [26, 28, 39–41], depending on the thresholds and bouts (contiguous activity periods) used to determine the adherence to PA recommendations. Thus the overall prevalence of 21.7% observed in our data seems to exceed observations in other accelerometer-based studies. Nevertheless, from a health perspective the current observed PA prevalence in Switzerland may still be considered as too low to compensate for the assumed adverse health effects of SB [8]. Physical inactivity, and thus SB, is an acknowledged risk factor and considerably related to adverse health conditions [8–10]. Being physically active has been shown to benefit health whereby a certain dose-response can be observed [42].
To further promote PA and prevent too much sedentariness past age 50, this study has identified important target groups. We identified important biological, socioeconomic, cultural and lifestyle factors as associated with SB and PA (e.g., sex, age, language region, smoking and BMI). For instance, obese participants in particular spent more time in SB and were less physically active compared with subjects with a BMI below 25 kg/m2, as observed in other studies [26, 43]. In previous studies, a more attenuated age-related increase in BMI was observed in participants being constantly physically active [3], also in younger SAPALDIA participants [44]. Furthermore, smoking is likely to have an adverse impact on PA in part by influencing respiratory and cardiac function [45]. In our study, only current smokers spent statistically significantly more time in SB and less in LPA and MVPA than never smokers. In a previous study, conducted in a much younger age group, the smoking effect on PA was observed to be independent of the quantity and the frequency of smoking [46].
From a prevention perspective, the results of this study point to the importance of intervening at younger ages. Our predictive results demonstrate that SB and PA patterns are established over decades. Remaining active as well as becoming active is possible and seemed to have a sustainable effect: Participants becoming active had less SB and were more physically active than those who remained or became inactive even 7 years later. From a health perspective, it seems never too late to become active. Being physically active was previously shown to be associated with the greatest health gains among those who had been barely active before [47].
But it is also important to consider specific needs in maintaining PA at a more advanced age. Higher age has been seen to reduce balance, strength and coordination and thus to increase the risk of falling [48]. Consequently, the worry of falling was identified as one of the barriers to engage in PA among older adults [49]. It is important to avoid a vicious cycle among older adults whereby they are not physically active out of fear of falling and thereby further deteriorate with regard to balance, strength and coordination. In the current study, this vicious cycle could be part of the explanation for the more sedentary lifestyle and lower PA observed in the age group of 75+. Comparable associations between age and PA levels have also been reported in Norwegian [26, 50] and English studies [13].
An additional important aspect to consider in PA promotion in the older groups of population is the lack of a partner, which becomes more frequent with aging. Not having a partner was previously reported as barrier to being physically active [49]. This complements our finding that single and widowed subjects were less physically active and having a more sedentary lifestyle than married participants, similarly observed in other studies [51, 52]. Cobb et al. (2016) confirmed that the PA of a spouse influences the partner’s PA [53]. PA engagement in specific domains, such as dancing and hiking, are also known to fight loneliness among older adults. The loneliness ministry in the UK established the prescription of dancing courses, which are refunded by the National Health Service, to older adults [54]. Some municipalities in Switzerland offer health promotion such as group activities (e.g., “zämegoloufe”) [55].
Finally, of interest to PA promotion in the multicultural Swiss context is the observed difference in PA patterns across language region. The Swiss Health Survey reported 79% of Swiss from the German-speaking part were sufficiently active compared with 67% and 68% of their counterparts from the French- and Italian-speaking parts, respectively [17]. Our data support the observation that older adults from the German-speaking part are more likely to meet the recommendation for subjective PA than residents from the French- and Italian-speaking parts. Corresponding regional differences have previously been reported for younger age groups. French-speaking children in Switzerland were reported to be less physically active and more sedentary than children from other language regions [56, 57]. A study in a bilingual city in Switzerland showed that the difference between French- and German-speaking children may be culturally rooted as French-speaking children spent less time playing vigorously outdoors [58] and were more often brought to school by car [59], despite similar characteristics of the built environment and the infrastructure. Language region differences in PA patterns observed in the SAPALDIA study were similar to PA differences between respective neighbouring countries. The majority of Italians and French never perform VPA, whereas it is the minority of Germans who never engage in VPA [60].
Objective measurements of PA in a general population is a clear strength of our study, because so far SB and PA studies in adults in Switzerland were mostly based on subjectively measured PA. The objective measurement improves precision and prevents recall bias, which is an issue in self-reported PA [35]. Unfortunately, the accelerometer does not measure activities such as carrying weight or activities related to water. This can result in an underestimation of relevant aspects of PA, particularly in older adults. An additional strength of the cohort study was its large sample size of 1314 participants. The cohort was population-based with participants recruited as random samples in eight different communities in 1991. This allows in principle the results to be generalised to the Swiss population. Furthermore, the extensive characterisation of participants allows study of independent associations of PA with many factors. The SAPALDIA cohort was conducted in the three main cultural regions of Switzerland. These regions have a similar education system and legal background and it was therefore possible to investigate culturally patterned PA.
The participants included in this analysis were recruited in 1991 and followed-up over 25 years and therefore there is a risk of sample bias. Unfortunately, PA was not assessed at baseline in SAPALDIA. We can therefore not estimate how this selection influenced our assessment of the prevalence of PA patterns in the general Swiss population. Compared with participants at baseline, the persons still participating in the health assessment including accelerometry were more likely to be male, from the German-speaking part of Switzerland, under- or of normal weight, employed or pensioner, of middle or high education and never smokers. As these characteristics were associated with PA in different directions, and these characteristics might influence participation at follow-up differently across PA levels, it is difficult to assess the bias this may cause in estimating PA and its determinants in the general population of Switzerland. The fact that we identified comparable trends and determinants of PA as in the Swiss Health Study provides some assurance about the generalisability of our results. Also, the consistency of our results with PA determinants in other studies strengthens the validity of our observations. Another potential weak point of the study is the fact that it did not consider data from the x- and z-axes of triaxial accelerometry. However, studies with the prior version of the accelerometer (GT3X) showed that the x- and z-axes did not necessarily add information beyond data from the y-axis for assessing the level of PA in the population according to recommendations [61]. Restricting analysis to data from the y-axis strengthens comparability with data from previous studies. It is important to point out, though, that objectively measured PA was tested against recommendations derived for subjectively obtained PA. As subjectively and objectively measured PA can show considerable discordance, the applied recommendation cut-offs may not adequately reflect health risk.
It is essential to remain physically active until older age to maintain a healthy life and uphold quality of life. PA promotion strategies for the older part of the population in Switzerland should take the strengthening of social contacts into consideration. Single and widowed persons in this study were especially inactive. The results of this study can additionally guide PA promotion in identifying population subgroups with specific needs, such persons of different cultural and language background as well as overweight and obese persons. According to our data, behavioural changes in PA are possible and sustainable as we can see in the group of participants becoming active and this is essential for health promotion recommendations.
Table S1 Baseline characteristics at SAPALDIA1 of participants who reached the age of 52+ at the time of accelerometry assessments, stratified by participant status in the accelerometry sub-study.
| No Accelerometer | Accelerometer | OR (95% CI) | |||
|---|---|---|---|---|---|
| n | % | n | % | ||
| Sex | |||||
| Male | 3341 | 48.0 | 723 | 51.9 | 1.00 |
| Female | 3617 | 52.0 | 669 | 48.1 | 0.85 (0.76–0.96)** |
| Age (years) | |||||
| 26–38 | 2263 | 32.5 | 529 | 38.0 | 1.00 |
| 39–48 | 2151 | 30.9 | 566 | 40.7 | 1.13 (0.99–1.29) |
| 49+ | 2544 | 36.6 | 297 | 21.3 | 0.50 (0.43–0.58)*** |
| BMI (kg/m2) | |||||
| <25.0 | 4258 | 61.2 | 1017 | 73.1 | 1.00 |
| 25–29.9 | 2105 | 30.3 | 322 | 23.1 | 0.64 (0.56–0.73)*** |
| ≥30 | 595 | 8.6 | 53 | 3.8 | 0.37 (0.28–0.50)*** |
| Language region | |||||
| German | 3479 | 50.0 | 769 | 55.2 | 1.00 |
| French | 2365 | 34.0 | 459 | 33.0 | 0.88 (0.77–1.00)* |
| Italian | 1114 | 16.0 | 164 | 11.8 | 0.67 (0.56–0.80)*** |
| Employment status | |||||
| Employed | 5570 | 80.1 | 1198 | 86.1 | 1.00 |
| House person | 1114 | 16.0 | 174 | 12.5 | 0.73 (0.61–0.86)*** |
| Pensioner | 34 | 0.5 | 5 | 0.4 | 0.68 (0.27–1.75) |
| Other | 240 | 3.4 | 15 | 1.1 | 0.29 (0.17–0.49)*** |
| Education | |||||
| Low | 1369 | 19.7 | 114 | 8.2 | 1.00 |
| Middle | 4472 | 64.3 | 930 | 66.8 | 2.50 (2.04–3.06)*** |
| High | 1117 | 16.1 | 348 | 25.0 | 3.74 (2.99–4.69)*** |
| Civil status | |||||
| Married | 4972 | 71.5 | 1020 | 73.3 | 1.00 |
| Divorced | 504 | 7.2 | 107 | 7.7 | 1.03 (0.83–1.29) |
| Widowed | 153 | 2.2 | 15 | 1.1 | 0.48 (0.28–0.82)** |
| Single | 1329 | 19.1 | 250 | 18.0 | 0.92 (0.79–1.07) |
| Smoking status | |||||
| Never | 2794 | 40.2 | 669 | 48.1 | 1.00 |
| Former | 1727 | 24.8 | 361 | 25.9 | 0.87 (0.76–1.01) |
| Current | 2437 | 35.0 | 362 | 26.0 | 0.62 (0.54–0.71)*** |
CI = confidence interval; OR = odds ratio * p-value ≤0.05; ** p-value ≤0.01; *** p-value ≤0.001
Table S2 Characteristics of participants at the time of the accelerometry study (SAPALDIA4) according to the validation status (at least 10 hours wear time per day; at least three valid weekdays and at least one valid weekend day).
| Accelerometry data | p-value χ2 | ||||||
|---|---|---|---|---|---|---|---|
| Invalid | Valid | Total | |||||
| n | % | n | % | n | % | ||
| Sex | |||||||
| Male (ref.) | 41 | 61.2 | 674 | 51.3 | 715 | 51.8 | |
| Female | 26 | 38.8 | 640 | 48.7 | 666 | 48.2 | 0.11 |
| Age (years) | |||||||
| 52–64 (ref.) | 21 | 31.3 | 453 | 34.5 | 474 | 34.3 | |
| 65–74 | 26 | 38.8 | 598 | 45.5 | 624 | 45.2 | |
| 75+ | 20 | 29.9 | 263 | 20.0 | 283 | 20.5 | 0.15 |
| BMI (kg/m2) | |||||||
| <25 (ref.) | 20 | 29.9 | 543 | 41.3 | 563 | 40.8 | |
| 25–29.9 | 27 | 40.3 | 527 | 40.1 | 554 | 40.1 | |
| ≥30 | 20 | 29.9 | 244 | 18.6 | 264 | 19.1 | 0.04 |
| Language region | |||||||
| German (ref.) | 36 | 53.7 | 721 | 54.9 | 757 | 54.8 | |
| French | 23 | 34.3 | 444 | 33.8 | 467 | 33.8 | |
| Italian | 8 | 11.9 | 149 | 11.3 | 157 | 11.4 | 0.98 |
| Employment status | |||||||
| Employed (ref.) | 20 | 29.9 | 425 | 32.3 | 445 | 32.2 | |
| House person | 1 | 1.5 | 38 | 2.9 | 39 | 2.8 | |
| Pensioner | 42 | 62.7 | 827 | 62.9 | 869 | 62.9 | |
| Other | 4 | 6.0 | 24 | 1.8 | 28 | 2.0 | 0.11 |
| Education | |||||||
| Low (ref.) | 3 | 4.5 | 39 | 3.0 | 42 | 3.0 | |
| Middle | 42 | 62.7 | 826 | 62.9 | 868 | 62.9 | |
| High | 22 | 32.8 | 449 | 34.2 | 471 | 34.1 | 0.77 |
| Civil status | |||||||
| Married (ref.) | 40 | 59.7 | 871 | 66.3 | 911 | 66.0 | |
| Divorced | 6 | 9.0 | 201 | 15.3 | 207 | 15.0 | |
| Widowed | 8 | 11.9 | 120 | 9.1 | 128 | 9.3 | |
| Single | 13 | 19.4 | 122 | 9.3 | 135 | 9.8 | 0.03 |
| Smoking status | |||||||
| Never (ref.) | 23 | 34.3 | 549 | 41.8 | 572 | 41.4 | |
| Former | 33 | 49.3 | 591 | 45.0 | 624 | 45.2 | |
| Current | 11 | 16.4 | 174 | 13.2 | 185 | 13.4 | 0.45 |
BMI = body mass index; ref. = reference
Table S3 Mean minutes per day† spent in specific levels of physical activity intensity (n = 1314), according to patients characteristics‡.
| n | Sedentary§ | Light¶ | Moderate-to-vigorous‖ | |
|---|---|---|---|---|
| Adjusted mean (95% CI) | Adjusted mean (95% CI) | Adjusted mean (95% CI) | ||
| Sex | ||||
| Male (ref.) | 674 | 694.8 (689.9–699.8) | 129.4 (125.9–132.9) | 40.3 (38.5–42.4) |
| Female | 640 | 670.5 (665.7–675.2)*** | 156.1 (152.6–159.6)*** | 37.8 (35.9–39.6) |
| Age (years) | ||||
| 52–64 (ref.) | 453 | 669.7 (663.3–676.1) | 148.6 (143.8–153.3) | 46.6 (44.0–49.3) |
| 65–74 | 598 | 674.7 (669.8–679.7) | 147.9 (144.1–151.7) | 42.3 (40.1–44.5)* |
| 75+ | 263 | 705.5 (698.8–712.2)*** | 131.6 (126.2–136.9)*** | 27.8 (25.0–30.8)*** |
| Language region | ||||
| German (ref.) | 721 | 682.6 (677.9–687.3) | 140.1 (136.8–143.5) | 42.1 (39.8–44.6) |
| French | 444 | 681.4 (675.2–687.6) | 146.7 (141.9–151.5)* | 36.8 (34.3–39.4)** |
| Italian | 149 | 682.4 (673.0–691.9) | 146.5 (138.8–154.1) | 35.9 (32.3–39.7)** |
| BMI [kg/m2] | ||||
| <25 (ref.) | 543 | 669.9 (664.1–675.7) | 148.3 (144.1–152.6) | 46.7 (44.0–49.1) |
| 25–30 | 527 | 682.2 (677.0–687.4)** | 142.9 (139.0–146.8) | 39.7 (37.5–42.0)*** |
| >30 | 244 | 700.4 (692.9–707.9)*** | 136.5 (130.5–142.6)** | 27.8 (24.9–31.2)*** |
| Employment status | ||||
| Employed (ref.) | 425 | 671.3 (664.7–677.9) | 146.2 (141.3–151.1) | 47.4 (44.6–50.2) |
| House person | 38 | 658.7 (637.9–679.5) | 167.7 (153.4–182.1)** | 38.6 (30.0–49.0) |
| Pensioner | 827 | 687.2 (682.9–691.5)*** | 141.4 (138.1–144.7) | 36.3 (34.4–38.3)*** |
| Other | 24 | 705 (679.7–730.2)* | 129.8 (111.4–148.2) | 30.6 (19.5–44.2)** |
| Education level | ||||
| Low (ref.) | 39 | 682.4 (662.2–702.7) | 150.2 (134.7–165.6) | 32.4 (25.4–39.9) |
| Middle | 826 | 678.6 (674.2–683.1) | 147.0 (143.6–150.3) | 39.3 (37.4–41.2) |
| High | 449 | 690.6 (685.3–695.9) | 133.0 (129.1–136.8)* | 41.3 (38.5–44.2)* |
| Civil status | ||||
| Married (ref.) | 871 | 679.3 (674.7–683.8) | 144.9 (141.4–148.3) | 40.7 (38.8–42.8) |
| Divorced | 201 | 684.5 (674.2–694.7) | 140.4 (133.0–147.9) | 39.9 (35.9–44.2) |
| Widowed | 120 | 693.0 (684.4–701.5)** | 141.0 (134.2–147.9) | 30.8 (26.8–35.2)*** |
| Single | 122 | 683.5 (674.8–692.2) | 140.6 (134.4–146.7) | 40.8 (36.5–45.5) |
| Smoking status | ||||
| Never (ref.) | 549 | 675.9 (671.1–680.8) | 148.1 (144.5–151.7) | 40.8 (38.3–43.3) |
| Former | 591 | 682.7 (677.2–688.2) | 142.7 (138.5–146.8) | 39.4 (37.2–41.9) |
| Current | 174 | 694.5 (684.9–704.1)*** | 134.3 (127.1–141.6)*** | 36.0 (32.0–40.3)* |
| Season | ||||
| Spring (ref.) | 146 | 680.9 (672.9–689.0) | 145.6 (139.3–151.8) | 38.4 (34.5–42.7) |
| Summer | 203 | 679.8 (670.6–689.1) | 149.0 (142–155.9) | 36.1 (32.0–40.5) |
| Autumn | 559 | 678.1 (672.8–683.5) | 145.7 (141.7–149.7) | 41.1 (38.9–43.5) |
| Winter | 406 | 689.3 (682.6–695.9) | 136.3 (131.3–141.4)* | 39.2 (36.5–42.1) |
CI = confidence interval; CPM =counts per minute; ref. = reference * p-value ≤0.05; ** p-value ≤0.01; *** p-value ≤0.001 † Mean minutes were derived from univariate linear regression models separately for each level of physical activity and each covariate ‡ In addition adjusted for wear time and season § 0–99 CPM ¶ 100– 019 CPM ‖ ≥2020 CPM
Table S4 Covariate adjusted mean minutes per day spent in specific levels of physical activity intensity objectively measured at SAPALDIA4, according to self-reported moderate-to-vigorous physical activity change patterns between SAPALDIA2 and SAPALDIA3 (remained active n = 87; became inactive n = 162; became active = 175; remained active = 729) according to Swiss recommendation for Physical Activity cutoffs.
| Sedentary | Light | Moderate-to-vigorous | |
|---|---|---|---|
| Adjusted mean (95% CI) | Adjusted mean (95% CI) | Adjusted mean (95% CI) | |
| Remained inactive (ref.) | 699.41 (687.30–711.51) | 135.37 (126.61–144.13) | 34.66 (30.15–39.17) |
| Became inactive | 690.70 (682.17–699.23) | 139.66 (132.90–146.42) | 37.90 (34.91–40.89) |
| Became active | 685.45 (676.95–693.96) | 144.18 (137.26–151.09) | 39.91 (36.67–43.15) |
| Remained active | 674.24 (670.08–678.41)*** | 147.71 (144.63–150.79)** | 46.40 (44.65–48.15)*** |
CI = confidence interval; ref. = reference * p-value ≤0.05; ** p-value ≤0.01; *** p-value ≤0.001
The study could not have been done without the help of the study participants, technical and administrative support and the medical teams and field workers at the local study sites.
Study directorate: NM Probst-Hensch (PI; e/g); D Stolz (p), C Schindler (s), N Künzli (e/exp)
Scientific team: R Bettschart (p), PO Bridevaux (p), L Burdet (p), T Sigrist (p), U Frey (pd), P Gasche-Soccal (p), MW Gerbase (p), F Kronenberg (g), B Martin (pa), M Pons (p), T Rothe (p), A Turk (p), A von Eckardstein (cc), E Zemp Stutz (e).
Scientific team at coordinating centers: N Aebi (e), D Carballo (c), S Caviezel (pa), P Cerletti (e), A Di Pascale (sd), R Ducret (exp), I Eze (e), L Grize (s), A Hensel (s), M Hegnauer (sd), M Imboden (g), A Jeong (g), D Keidel (s), N Mösli (e), E Schaffner (s), T Vermes (pa), D Walther (e), M Witzig (e)
(a) allergology, (c) cardiology, (cc) clinical chemistry, (e) epidemiology, (exp) exposure, (g) genetic and molecular biology, (m) meteorology, (n) nutrition, (o) occupational health, (p) pneumology, (pa) physical activity, (pd) paediatrics, (s) statistics, (sd) software development
Local fieldworkers S4: Aarau: A Heichel, E Isenring, C Marti, C Schuler, M Witzig. Basel: N Aebi, R Armbruster, S Nussbaumer, M Rutschi, M Witzig. Davos: S Derfler, M Dinic, L Esghani-Oswald, A Landauf. Geneva: N Ballot, B Ducry, M Plutino. Lugano: C Ferrari, I Paravac, P Parolini, T Vermes. Montana: P Friedrich, M Gérard, L Kristen, T Masserey, D Walther. Payerne: M Bertschy, C Bonzon, B Ducry, F Gainon, H Rodrigues. Wald: D Bodmer, C Kuntze, U Treder, A Lawson, S Mettler, D Studer, B Wigger.
Administrative staff: N Bauer Ott
The Swiss National Science Foundation (grants no 33CS30-177506/1, 33CS30-148470/1&2, 33CSCO-134276/1, 33CSCO-108796, 324730_135673, 3247BO-104283, 3247BO-104288, 3247BO-104284, 3247-065896, 3100-059302, 3200-052720, 3200-042532, 4026-028099, PMPDP3_129021/1, PMPDP3_141671/1 and the SNF-SiRENE (grant number CRSII3_147635)), the Federal Office for the Environment, the Federal Office of Public Health, the Federal Office of Roads and Transport, the canton's government of Aargau, Basel-Stadt, Basel-Land, Geneva, Luzern, Ticino, Valais, and Zürich, the Swiss Lung League, the canton’s Lung League of Basel Stadt/ Basel Landschaft, Geneva, Ticino, Valais, Graubünden and Zurich, Stiftung ehemals Bündner Heilstätten, SUVA, Freiwillige Akademische Gesellschaft, UBS Wealth Foundation, Talecris Biotherapeutics GmbH, Abbott Diagnostics, Klinik Barmelweid, Hirslanden Klinik Aarau, European Commission 018996 (GABRIEL), Wellcome Trust WT 084703MA, Exposomics EC FP7 grant (Grant agreement No: 308610), ALEC Horizon2020 (Grant agreement No: 633212).
The authors declare that they have no conflict of interest.
1Institute for Health Metrics and Evaluation (IHME). GBD Compare. Seattle, WA: IHME, University of Washington; 2015. Available from: http://vizhub.healthdata.org/gbd-compare.
2 Gakidou E , Afshin A , Abajobir AA , Abate KH , Abbafati C , Abbas KM , et al.; GBD 2016 Risk Factors Collaborators. Global, regional, and national comparative risk assessment of 84 behavioural, environmental and occupational, and metabolic risks or clusters of risks, 1990-2016: a systematic analysis for the Global Burden of Disease Study 2016. Lancet. 2017;390(10100):1345–422. doi:.https://doi.org/10.1016/S0140-6736(17)32366-8
3 Bauman AE , Grunseit AC , Rangul V , Heitmann BL . Physical activity, obesity and mortality: does pattern of physical activity have stronger epidemiological associations? BMC Public Health. 2017;17(1):788. doi:.https://doi.org/10.1186/s12889-017-4806-6
4 Demakakos P , Hamer M , Stamatakis E , Steptoe A . Low-intensity physical activity is associated with reduced risk of incident type 2 diabetes in older adults: evidence from the English Longitudinal Study of Ageing. Diabetologia. 2010;53(9):1877–85. doi:.https://doi.org/10.1007/s00125-010-1785-x
5 Li J , Siegrist J . Physical activity and risk of cardiovascular disease--a meta-analysis of prospective cohort studies. Int J Environ Res Public Health. 2012;9(2):391–407. doi:.https://doi.org/10.3390/ijerph9020391
6 Garcia-Aymerich J , Lange P , Benet M , Schnohr P , Antó JM . Regular physical activity modifies smoking-related lung function decline and reduces risk of chronic obstructive pulmonary disease: a population-based cohort study. Am J Respir Crit Care Med. 2007;175(5):458–63. doi:.https://doi.org/10.1164/rccm.200607-896OC
7 McDowell CP , Dishman RK , Vancampfort D , Hallgren M , Stubbs B , MacDonncha C , et al. Physical activity and generalized anxiety disorder: results from The Irish Longitudinal Study on Ageing (TILDA). Int J Epidemiol. 2018;47(5):1443–53. doi:.https://doi.org/10.1093/ije/dyy141
8 Ekelund U , Steene-Johannessen J , Brown WJ , Fagerland MW , Owen N , Powell KE , et al.; Lancet Physical Activity Series 2 Executive Committe; Lancet Sedentary Behaviour Working Group. Does physical activity attenuate, or even eliminate, the detrimental association of sitting time with mortality? A harmonised meta-analysis of data from more than 1 million men and women. Lancet. 2016;388(10051):1302–10. doi:.https://doi.org/10.1016/S0140-6736(16)30370-1
9 Peterson MJ , Giuliani C , Morey MC , Pieper CF , Evenson KR , Mercer V , et al.; Health, Aging and Body Composition Study Research Group. Physical activity as a preventative factor for frailty: the health, aging, and body composition study. J Gerontol A Biol Sci Med Sci. 2009;64A(1):61–8. doi:.https://doi.org/10.1093/gerona/gln001
10 Katzmarzyk PT , Church TS , Craig CL , Bouchard C . Sitting time and mortality from all causes, cardiovascular disease, and cancer. Med Sci Sports Exerc. 2009;41(5):998–1005. doi:.https://doi.org/10.1249/MSS.0b013e3181930355
11 Chastin SFM , Buck C , Freiberger E , Murphy M , Brug J , Cardon G , et al.; DEDIPAC consortium. Systematic literature review of determinants of sedentary behaviour in older adults: a DEDIPAC study. Int J Behav Nutr Phys Act. 2015;12(1):127. doi:.https://doi.org/10.1186/s12966-015-0292-3
12 Feng X , Croteau K , Kolt GS , Astell-Burt T . Does retirement mean more physical activity? A longitudinal study. BMC Public Health. 2016;16(1):605. doi:.https://doi.org/10.1186/s12889-016-3253-0
13 Smith L , Gardner B , Fisher A , Hamer M . Patterns and correlates of physical activity behaviour over 10 years in older adults: prospective analyses from the English Longitudinal Study of Ageing. BMJ Open. 2015;5(4):e007423. doi:.https://doi.org/10.1136/bmjopen-2014-007423
14 Hills AP , Mokhtar N , Byrne NM . Assessment of physical activity and energy expenditure: an overview of objective measures. Front Nutr. 2014;1:5. doi:.https://doi.org/10.3389/fnut.2014.00005
15 Guthold R , Stevens GA , Riley LM , Bull FC . Worldwide trends in insufficient physical activity from 2001 to 2016: a pooled analysis of 358 population-based surveys with 1·9 million participants. Lancet Glob Health. 2018;6(10):e1077–86. doi:.https://doi.org/10.1016/S2214-109X(18)30357-7
16 McGuire S . Centers for Disease Control and Prevention. State indicator report on Physical Activity, 2014. Atlanta, GA: U.S. Department of Health and Human Services; 2014. Adv Nutr. 2014;5(6):762–3. doi:.https://doi.org/10.3945/an.114.007211
17Bundesamt für Statistik (BFS). Schweizerische Gesundheitsbefragung 2017 - Körperliche Aktivität und Gesundheit. Neuchâtel: Bundesamt für Statistik; 2019.
18Bundesamt für Statistik (BFS). Schweizerische Gesundheitsbefragung 2017 - Körperliche Aktivität: Bundesamt für Statistik (BFS); 2018 [cited 2020 March]. Available from: https://www.bfs.admin.ch/bfs/de/home/statistiken/gesundheit/determinanten/koerperliche-aktivitaet.html.
19Health and Physical Activity Network Switzerland. Health-Enhancing Physical Activity in older Adults - Recommendations for Switzerland. Magglingen: Federal Office for Sports; 2013.
20 Jefferis BJ , Sartini C , Lee IM , Choi M , Amuzu A , Gutierrez C , et al. Adherence to physical activity guidelines in older adults, using objectively measured physical activity in a population-based study. BMC Public Health. 2014;14(1):382. doi:.https://doi.org/10.1186/1471-2458-14-382
21 Kehler DS , Theou O . The impact of physical activity and sedentary behaviors on frailty levels. Mech Ageing Dev. 2019;180:29–41. doi:.https://doi.org/10.1016/j.mad.2019.03.004
22 Tudor-Locke C , Brashear MM , Johnson WD , Katzmarzyk PT . Accelerometer profiles of physical activity and inactivity in normal weight, overweight, and obese U.S. men and women. Int J Behav Nutr Phys Act. 2010;7(1):60. doi:.https://doi.org/10.1186/1479-5868-7-60
23 Faeh D , Minder C , Gutzwiller F , Bopp M ; Swiss National Cohort Study Group. Culture, risk factors and mortality: can Switzerland add missing pieces to the European puzzle? J Epidemiol Community Health. 2009;63(8):639–45. doi:.https://doi.org/10.1136/jech.2008.081042
24 Martin BW , Ackermann-Liebrich U , Leuenberger P , Künzli N , Stutz EZ , Keller R , et al. SAPALDIA: methods and participation in the cross-sectional part of the Swiss Study on Air Pollution and Lung Diseases in Adults. Soz Praventivmed. 1997;42(2):67–84. doi:.https://doi.org/10.1007/BF01318136
25ActiGraph LLC. User Guide: ActiGraph wGT3X-BT + ActiLife. 2019. Available from: www.actigraphcorp.com/support/manuals/wgt3x-bt-manual/.
26 Hansen BH , Kolle E , Steene-Johannessen J , Dalene KE , Ekelund U , Anderssen SA . Monitoring population levels of physical activity and sedentary time in Norway across the lifespan. Scand J Med Sci Sports. 2019;29(1):105–12. doi:.https://doi.org/10.1111/sms.13314
27 Troiano RP . Large-scale applications of accelerometers: new frontiers and new questions. Med Sci Sports Exerc. 2007;39(9):1501. doi:.https://doi.org/10.1097/mss.0b013e318150d42e
28 Troiano RP , Berrigan D , Dodd KW , Mâsse LC , Tilert T , McDowell M . Physical activity in the United States measured by accelerometer. Med Sci Sports Exerc. 2008;40(1):181–8. doi:.https://doi.org/10.1249/mss.0b013e31815a51b3
29US Department of Health and Human Services. Physical activity and health: a report of the Surgeon General. Atlanta, GA: U.S. Department of Health and Human Services, Centers for Disease Control and Prevention, National Center for Chronic Disease Prevention and Health Promotion; 1996. 292 p.
30 Trost SG , McIver KL , Pate RR . Conducting accelerometer-based activity assessments in field-based research. Med Sci Sports Exerc. 2005;37(11, Suppl):S531–43. doi:.https://doi.org/10.1249/01.mss.0000185657.86065.98
31 Wanner M , Probst-Hensch N , Kriemler S , Meier F , Autenrieth C , Martin BW . Validation of the long international physical activity questionnaire: Influence of age and language region. Prev Med Rep. 2016;3:250–6. doi:.https://doi.org/10.1016/j.pmedr.2016.03.003
32 Craig CL , Marshall AL , Sjöström M , Bauman AE , Booth ML , Ainsworth BE , et al. International physical activity questionnaire: 12-country reliability and validity. Med Sci Sports Exerc. 2003;35(8):1381–95. doi:.https://doi.org/10.1249/01.MSS.0000078924.61453.FB
33 Endes S , Schaffner E , Caviezel S , Dratva J , Autenrieth CS , Wanner M , et al. Long-term physical activity is associated with reduced arterial stiffness in older adults: longitudinal results of the SAPALDIA cohort study. Age Ageing. 2016;45(1):110–5. doi:.https://doi.org/10.1093/ageing/afv172
34Kirkwood B, Sterne J. Essential Medical Statistics. Hoboken, NJ: Wiley; 2003. 516 p.
35 Prince SA , Adamo KB , Hamel ME , Hardt J , Connor Gorber S , Tremblay M . A comparison of direct versus self-report measures for assessing physical activity in adults: a systematic review. Int J Behav Nutr Phys Act. 2008;5(1):56. doi:.https://doi.org/10.1186/1479-5868-5-56
36 Grimm EK , Swartz AM , Hart T , Miller NE , Strath SJ . Comparison of the IPAQ-Short Form and accelerometry predictions of physical activity in older adults. J Aging Phys Act. 2012;20(1):64–79. doi:.https://doi.org/10.1123/japa.20.1.64
37Bringolf-Isler B, Probst-Hensch N, Kayser B, Suggs S. Schlussbericht zur SOPHYA-Studie. Basel: Swiss Tropical and Public Health Institute; 2016.
38 Slootmaker SM , Schuit AJ , Chinapaw MJ , Seidell JC , van Mechelen W . Disagreement in physical activity assessed by accelerometer and self-report in subgroups of age, gender, education and weight status. Int J Behav Nutr Phys Act. 2009;6(1):17. doi:.https://doi.org/10.1186/1479-5868-6-17
39 Baptista F , Santos DA , Silva AM , Mota J , Santos R , Vale S , et al. Prevalence of the Portuguese population attaining sufficient physical activity. Med Sci Sports Exerc. 2012;44(3):466–73. doi:.https://doi.org/10.1249/MSS.0b013e318230e441
40 Luzak A , Heier M , Thorand B , Laxy M , Nowak D , Peters A , et al.; KORA-Study Group. Physical activity levels, duration pattern and adherence to WHO recommendations in German adults. PLoS One. 2017;12(2):e0172503. doi:.https://doi.org/10.1371/journal.pone.0172503
41 Hagströmer M , Oja P , Sjöström M . Physical activity and inactivity in an adult population assessed by accelerometry. Med Sci Sports Exerc. 2007;39(9):1502–8. doi:.https://doi.org/10.1249/mss.0b013e3180a76de5
42 Warburton DER , Bredin SSD . Health benefits of physical activity: a systematic review of current systematic reviews. Curr Opin Cardiol. 2017;32(5):541–56. doi:.https://doi.org/10.1097/HCO.0000000000000437
43 Cooper AR , Page A , Fox KR , Misson J . Physical activity patterns in normal, overweight and obese individuals using minute-by-minute accelerometry. Eur J Clin Nutr. 2000;54(12):887–94. doi:.https://doi.org/10.1038/sj.ejcn.1601116
44 Wanner M , Martin BW , Autenrieth CS , Schaffner E , Meier F , Brombach C , et al. Associations between domains of physical activity, sitting time, and different measures of overweight and obesity. Prev Med Rep. 2016;3:177–84. doi:.https://doi.org/10.1016/j.pmedr.2016.01.007
45 Kaczynski AT , Manske SR , Mannell RC , Grewal K . Smoking and physical activity: a systematic review. Am J Health Behav. 2008;32(1):93–110. doi:.https://doi.org/10.5993/AJHB.32.1.9
46 Papathanasiou G , Papandreou M , Galanos A , Kortianou E , Tsepis E , Kalfakakou V , et al. Smoking and physical activity interrelations in health science students. Is smoking associated with physical inactivity in young adults? Hellenic J Cardiol. 2012;53(1):17–25.
47 Sattelmair J , Pertman J , Ding EL , Kohl HW, 3rd , Haskell W , Lee IM . Dose response between physical activity and risk of coronary heart disease: a meta-analysis. Circulation. 2011;124(7):789–95. doi:.https://doi.org/10.1161/CIRCULATIONAHA.110.010710
48 Ambrose AF , Paul G , Hausdorff JM . Risk factors for falls among older adults: a review of the literature. Maturitas. 2013;75(1):51–61. doi:.https://doi.org/10.1016/j.maturitas.2013.02.009
49 Moschny A , Platen P , Klaassen-Mielke R , Trampisch U , Hinrichs T . Barriers to physical activity in older adults in Germany: a cross-sectional study. Int J Behav Nutr Phys Act. 2011;8(1):121. doi:.https://doi.org/10.1186/1479-5868-8-121
50 Lohne-Seiler H , Hansen BH , Kolle E , Anderssen SA . Accelerometer-determined physical activity and self-reported health in a population of older adults (65-85 years): a cross-sectional study. BMC Public Health. 2014;14(1):284. doi:.https://doi.org/10.1186/1471-2458-14-284
51 Alkerwi A , Schuh B , Sauvageot N , Zannad F , Olivier A , Guillaume M , et al. Adherence to physical activity recommendations and its associated factors: an interregional population-based study. J Public Health Res. 2015;4(1):406. doi:.https://doi.org/10.4081/jphr.2015.406
52 Pettee KK , Brach JS , Kriska AM , Boudreau R , Richardson CR , Colbert LH , et al. Influence of marital status on physical activity levels among older adults. Med Sci Sports Exerc. 2006;38(3):541–6. doi:.https://doi.org/10.1249/01.mss.0000191346.95244.f7
53 Cobb LK , Godino JG , Selvin E , Kucharska-Newton A , Coresh J , Koton S . Spousal Influence on Physical Activity in Middle-Aged and Older Adults: The ARIC Study. Am J Epidemiol. 2016;183(5):444–51. doi:.https://doi.org/10.1093/aje/kwv104
54Bedell G. Lonely people need local connections – don’t make a song and dance of it. The Guardian. 2018 October 16.
55 Frei A , Dalla Lana K , Radtke T , Stone E , Knöpfli N , Puhan MA . A novel approach to increase physical activity in older adults in the community using citizen science: a mixed-methods study. Int J Public Health. 2019;64(5):669–78. doi:.https://doi.org/10.1007/s00038-019-01230-3
56 Bringolf-Isler B , Mäder U , Dössegger A , Hofmann H , Puder JJ , Braun-Fahrländer C , et al. Regional differences of physical activity and sedentary behaviour in Swiss children are not explained by socio-demographics or the built environment. Int J Public Health. 2015;60(3):291–300. doi:.https://doi.org/10.1007/s00038-014-0645-8
57 Leeger-Aschmann CS , Schmutz EA , Radtke T , Kakebeeke TH , Zysset AE , Messerli-Bürgy N , et al. Regional sociocultural differences as important correlate of physical activity and sedentary behaviour in Swiss preschool children. Swiss Med Wkly. 2016;146:w14377. doi:.https://doi.org/10.4414/smw.2016.14377
58 Bringolf-Isler B , Grize L , Mäder U , Ruch N , Sennhauser FH , Braun-Fahrländer C ; SCARPOL team. Built environment, parents’ perception, and children’s vigorous outdoor play. Prev Med. 2010;50(5-6):251–6. doi:.https://doi.org/10.1016/j.ypmed.2010.03.008
59 Bringolf-Isler B , Grize L , Mäder U , Ruch N , Sennhauser FH , Braun-Fahrländer C ; SCARPOL team. Personal and environmental factors associated with active commuting to school in Switzerland. Prev Med. 2008;46(1):67–73. doi:.https://doi.org/10.1016/j.ypmed.2007.06.015
60Directorate - General for Education Y. Sport and Culture (European Commission), Social TO. Sport and physical activity: report. 2018. Available from: https://publications.europa.eu/en/publication-detail/-/publication/9a69f642-fcf6-11e8-a96d-01aa75ed71a1.
61 Santos-Lozano A , Torres-Luque G , Marín PJ , Ruiz JR , Lucia A , Garatachea N . Intermonitor variability of GT3X accelerometer. Int J Sports Med. 2012;33(12):994–9. doi:.https://doi.org/10.1055/s-0032-1312580
The Swiss National Science Foundation (grants no 33CS30-177506/1, 33CS30-148470/1&2, 33CSCO-134276/1, 33CSCO-108796, 324730_135673, 3247BO-104283, 3247BO-104288, 3247BO-104284, 3247-065896, 3100-059302, 3200-052720, 3200-042532, 4026-028099, PMPDP3_129021/1, PMPDP3_141671/1 and the SNF-SiRENE (grant number CRSII3_147635)), the Federal Office for the Environment, the Federal Office of Public Health, the Federal Office of Roads and Transport, the canton's government of Aargau, Basel-Stadt, Basel-Land, Geneva, Luzern, Ticino, Valais, and Zürich, the Swiss Lung League, the canton’s Lung League of Basel Stadt/ Basel Landschaft, Geneva, Ticino, Valais, Graubünden and Zurich, Stiftung ehemals Bündner Heilstätten, SUVA, Freiwillige Akademische Gesellschaft, UBS Wealth Foundation, Talecris Biotherapeutics GmbH, Abbott Diagnostics, Klinik Barmelweid, Hirslanden Klinik Aarau, European Commission 018996 (GABRIEL), Wellcome Trust WT 084703MA, Exposomics EC FP7 grant (Grant agreement No: 308610), ALEC Horizon2020 (Grant agreement No: 633212).
The authors declare that they have no conflict of interest.