
Figure 1 Study recruitment and response rate.
DOI: https://doi.org/10.4414/smw.2020.20221
The Swiss healthcare system is highly complex, combining aspects of managed competition and the integration of interest groups in the policy process in a decentralised regulatory framework, shaped by the influences of direct democracy [1]. The health system performs comparatively well on the basis of relevant indicators such as life expectancy at birth (83.7 years in Switzerland), which is the highest in Europe in 2017 [2–4]. Coverage is ensured through mandatory health insurance , with subsidies for people on low incomes. The system offers a high degree of choice and direct access to all levels of care with almost no waiting times, though managed care type insurance plans that include gatekeeping restrictions are emerging. Nevertheless, a number of challenges remain.
The costs of the healthcare system are well above the European Union (EU) average, in particular in absolute terms but also as a percentage of gross domestic product (GDP). Health spending accounted for 12.1% of the GDP in 2015, second only to the United States and higher than all other European countries [5]. Mandatory health insurance premiums have increased more quickly than incomes since 2003. By European standards, the share of out-of-pocket payments is exceptionally high at 29% of total health expenditure in 2017 (compared with the EU average of 15% [6]). Due to Switzerland’s decentralised administrative and political structure, there is also a regional variation of healthcare expenditure across cantons; per capita expenditure for the population living in the “most expensive” canton was almost two times higher than the amount spent for the population in the “least expensive” canton.
Ambulatory care is provided mostly by self-employed physicians working in independent practices, offering both primary care and specialised care. Fee-for-service is the dominant method of provider payment in Switzerland. For ambulatory physicians and outpatient services provided by hospitals, a nationally uniform fee schedule called TARMED was introduced in 2004.
Acute care hospitals provide inpatient care and play an increasingly important role in the provision of ambulatory and day care services. Public and private hospitals that are included on cantonal hospital lists can provide services that are reimbursed by mandatory health insurance. Hospital payment based on Swiss Diagnosis Related Groups has replaced per diems as the most important payment mechanism since 2012. For long-term care, mandatory health insurance pays a contribution that depends on the care needs of the patient; The patient pays a capped contribution and the canton is liable to cover the remaining costs.
According to the Swiss Federal Statistical Office, ambulatory care generates 26.5% of healthcare costs, whereas hospital in-patient care contributes 19%. In the ambulatory sector, general practitioners (GPs) generate about one third of costs, whereas specialists contribute two thirds [7]. Indeed, higher costs due to higher utilisation were associated partially with higher density of specialists in single practice [8]. The Swiss government imposed a controversial moratorium on the launch of new doctors’ practices in order to reduce health costs in 2002. In particular, this governmental intervention was supposed to prevent an expensive oversupply of specialists.
Currently, there are over 40,391 physicians registered in Switzerland, giving the country one of the highest rates of physicians per capita in Europe [9]. According to an Organization for Economic Cooperation and Development (OECD) series on countries’ healthcare systems, GPs made up only 28% of all physicians in 2015 in Switzerland, whereas in France and in Germany the proportion of generalists was 46% and 41%, respectively [5]. Data of the Swiss Primary Care Active Monitoring indicates 43% among ambulatory care doctors [10].
GPs substantially contribute to ensuring the quality of care and reducing healthcare costs [11]. Despite a stable and comparably high GP density of 105.5 GPs per 100,000 inhabitants in Switzerland, the average age of GPs is 54 years with an age-increasing trend [10]. Thus, the retirement of GPs within the next years combined with Switzerland’s restrictive policies on opening new practices is producing a shortage of GPs [10]. Indeed, estimates predict a lack of thousands of GPs across Switzerland if no countermeasures are taken [12].
In the current context of spiralling healthcare costs and a shortage of GPs, it is essential to understand how the population uses the healthcare system. In particular, which healthcare providers are contacted by people having a health problem? Do they still consult their GP or a specialist? Are GPs getting obsolete, in view of the increasing number of specialists? In Austria, for example, the healthcare system offers universal health coverage and free provider choice. Primary data analysis showed that unregulated patient access to all levels of care, including through self-referral, created a system with overall high utilisation, particularly prominent in the secondary and tertiary care sectors, and weak primary care functions [13]. Currently, there is a lack of independent data on the structure and utilisation of health care in Switzerland.
Such questions may be explored with the population ecology theory, which estimates the utilisation of healthcare [14–16]. In 1961 White et al. published “The Ecology of Medical Care”, assessing self-reported sickness and healthcare behaviour in the adult population in the US [17]. This population-based model was replicated in different countries around the globe [13–16, 18–22]. The framework provides a valuable tool for researchers and healthcare policy makers to measure and reflect the quantity, quality and type of distribution of healthcare services. Therefore, it estimates the utilisation of healthcare by the population. With respect to availability, the ecology model with “person-month” provides superior information as compared with the absolute number of physician appointments as a measure of the use of healthcare services, since the latter includes repeated appointments for medical reasons. Moreover, previous studies’ survey data were used in privately, mixed-finance healthcare systems or publicly funded healthcare systems, none of which is comparable to the Swiss healthcare system.
To our knowledge, this method has not yet been applied in the Swiss population. The aim of this study was to assess healthcare behaviours in Switzerland in a population-based survey, using the ecology of healthcare framework.
The LINK Institute Luzern, Switzerland interviewed a representative sample of the language-assimilated [23] Swiss population aged 18 years or older by telephone. Contacts were generated through random-digit-dialling (RDD), which allows for excellent coverage of the Swiss population, including households that are only reachable by mobile phone or have an unregistered landline connection.
The computer-assisted telephone interviews were conducted by native speakers in the central telephone laboratories of the LINK Institute in Zurich, Lucerne, Lausanne and Lugano. All interviewers were specifically trained for this study beforehand and continuous supervision took place during the interviews to guarantee high survey quality.
The questionnaire was fully structured with semi-open and closed questions. An English version of the questionnaire is available in appendix 1. Information was collected anonymously from all participants who agreed to take part in this study. The interviews took place in two waves in May and November 2018 to account for potential seasonal variations. During each round, roughly the same number of people were interviewed.
Respondents indicated the presence of any health problem in the last 2 months, whether and where they asked for medical advice (advice from internet, family or friends, drugstore, pharmacy, telephone medical advice centre, general practitioner, specialist physicians, accident and emergency unit, outpatient or policlinic, physiotherapy, dentist or alternative medicine).
Further, interviewees were asked whether they took medication and if so, where it was purchased (drugstore, pharmacy, supermarket, internet or physicians).
Respondents also indicated whether they were hospitalised within the last 2 months, as well as details on in-hospital and post-hospital care. This survey reports healthcare use over the past 2 months.
With 500 interviews per wave (n = 1000), the maximum range of variation lies within ±3.2%, which enables meaningful analysis even between different sociodemographic groups.
Rim weighting [24] was performed by LINK Institute Luzern in order to correct any imbalances between the survey sample and the population across the interlocking quotas of language region, sex, age category and employment status. Further, they used marginal population totals to weight for household size. The raking process was repeated until the weighted distribution of all of the weighting variables matched their specified targets of the Swiss population in 2016 [25–27].
All analyses are presented on the weighted samples. For this purpose, the R package “survey” was used [28]. The functions of this R package perform weighted estimations, with each observation being weighted by the inverse of its sampling probability. To compute weighted cross-tabulations, we used the “svytable” function. The standard error of proportions was estimated using the functions “svytotal” or “svymean”. The standard errors produced were subsequently used to calculate the confidence intervals which were assumed to follow a normal approximation to the binomial distribution. We applied the rule of proportion to obtain the rates per 1000 from the number of total respondents.
Subgroup analyses were conducted for men and women, five age groups, three language regions, and rural and urban areas. In order to test for significant associations of healthcare utilisation within different groups, we used the function “svychisq” from the R package “survey” which computes first and second-order Rao-Scott corrections to the Pearson chi-square test.
Initially, LINK provided a random sample of 7519 telephone numbers drawn from their pool of telephone numbers, of which 523 contacts refused to participate (“refusal and break off” according to [29]) and 1205 were not reached by telephone (“non contact” according to [29]). There were 4417 persons with a quota overflow: persons who were no longer admitted to the study as a result of the quota characteristics (“not eligible” according to [29]). Finally, 1025 completed the questionnaire (506 in May and 519 in November) (response rate 1 = 33% according to [29], see the study flow chart in figure 1). The median age of the weighted sample was 52 years (interquartile range [IQR] 38−63). Fifty-one percent of respondents were female, 71% were residents in the German-speaking, 24% in the French-speaking and 4% in the Italian-speaking regions. Table 1 shows their characteristics after we weighted data for age, sex, language region, employment status and household size. The vast majority (95%, 95% confidence interval [CI] 93−96%) of participants were registered with a general practitioner.
Figure 1 Study recruitment and response rate.
Table 1 Unweighted and weighted total sample numbers* by sex, age group, employment status, household size and urban/rural area in Switzerland.
| Total | Gender | Age category | Employed | Household size(no. persons) | Language region | Area type | |||||||||||||
|---|---|---|---|---|---|---|---|---|---|---|---|---|---|---|---|---|---|---|---|
| Male | Female | 18−29 | 30−44 | 45−59 | 60−79 | 80−100 | Yes | No | 1 | 2 | 3+ | GE | FR | IT | Urban | Rural | |||
| Total | Unweighted | 1025 | 504 | 521 | 182 | 262 | 278 | 236 | 67 | 643 | 382 | 189 | 306 | 530 | 719 | 252 | 54 | 735 | 290 |
| Weighted | 1025 | 504 | 521 | 184 | 262 | 280 | 234 | 63 | 684 | 341 | 362 | 335 | 328 | 732 | 248 | 45 | 749 | 276 | |
| Sex | Male | 504 | 504 | 94 | 133 | 141 | 112 | 23 | 373 | 130 | 166 | 180 | 158 | 362 | 120 | 22 | 351 | 152 | |
| Female | 521 | 521 | 90 | 130 | 139 | 122 | 40 | 311 | 210 | 196 | 156 | 170 | 370 | 127 | 24 | 398 | 124 | ||
| Age group | 18−29 | 184 | 94 | 90 | 144 | 40 | 34 | 25 | 125 | 129 | 48 | 7 | 131 | 54 | |||||
| 30−44 | 262 | 133 | 130 | 233 | 29 | 76 | 52 | 134 | 187 | 65 | 10 | 194 | 69 | ||||||
| 45−59 | 280 | 141 | 139 | 247 | 34 | 78 | 140 | 62 | 201 | 66 | 13 | 198 | 83 | ||||||
| 60−79 | 234 | 112 | 122 | 57 | 177 | 125 | 103 | 7 | 169 | 53 | 12 | 174 | 60 | ||||||
| 80−100 | 63 | 23 | 40 | 4 | 60 | 49 | 14 | 0 | 45 | 15 | 4 | 53 | 10 | ||||||
| Employed | Yes | 684 | 373 | 311 | 144 | 233 | 247 | 57 | 4 | 193 | 227 | 264 | 498 | 160 | 25 | 488 | 197 | ||
| No | 341 | 130 | 210 | 40 | 29 | 34 | 177 | 60 | 169 | 108 | 64 | 234 | 87 | 20 | 261 | 79 | |||
| Household size (no. persons) | 1 | 362 | 166 | 196 | 34 | 76 | 78 | 125 | 49 | 193 | 169 | 273 | 73 | 16 | 293 | 69 | |||
| 2 | 335 | 180 | 156 | 25 | 52 | 140 | 103 | 14 | 227 | 108 | 246 | 81 | 8 | 232 | 103 | ||||
| 3+ | 328 | 158 | 170 | 125 | 134 | 62 | 7 | 0 | 264 | 64 | 213 | 93 | 22 | 224 | 103 | ||||
| Language region | German | 732 | 362 | 370 | 129 | 187 | 201 | 169 | 45 | 498 | 234 | 273 | 246 | 213 | 518 | 214 | |||
| French | 248 | 120 | 127 | 48 | 65 | 66 | 53 | 15 | 160 | 87 | 73 | 81 | 93 | 193 | 55 | ||||
| Italian | 45 | 22 | 24 | 7 | 10 | 13 | 12 | 4 | 25 | 20 | 16 | 8 | 22 | 38 | 7 | ||||
| Area type | Urban | 749 | 351 | 398 | 131 | 194 | 198 | 174 | 53 | 488 | 261 | 293 | 232 | 224 | 518 | 193 | 38 | ||
| Rural | 276 | 152 | 124 | 54 | 69 | 83 | 60 | 10 | 197 | 79 | 69 | 103 | 103 | 214 | 55 | 7 | |||
FR = French; GE = German; IT = Italian * Weighted numbers are rounded and thus marginal totals might not add up. Analyses are based on weighted sample
Bimonthly rates of health problems and healthcare use among Swiss residents are reported in table 1 and figure2. Out of 1000 Swiss residents, 546 reported one or more health problems, and 243 sought medical advice for those problems. The most frequent source of medical advice was the general practitioner (164 respondents) followed by specialist physicians (81 respondents). Other health professionals, such as pharmacists, dentists, physical therapists, and complementary and alternative medicine practitioners, as well as outpatient clinics, accident and emergency units, telephone medical advice centres, and lay sources such as family, friends or the internet were named less frequently (table 2). Out of 1000 Swiss residents, 386 took medication (table 2). The most frequent place of purchase was the pharmacy, named by 207 respondents.
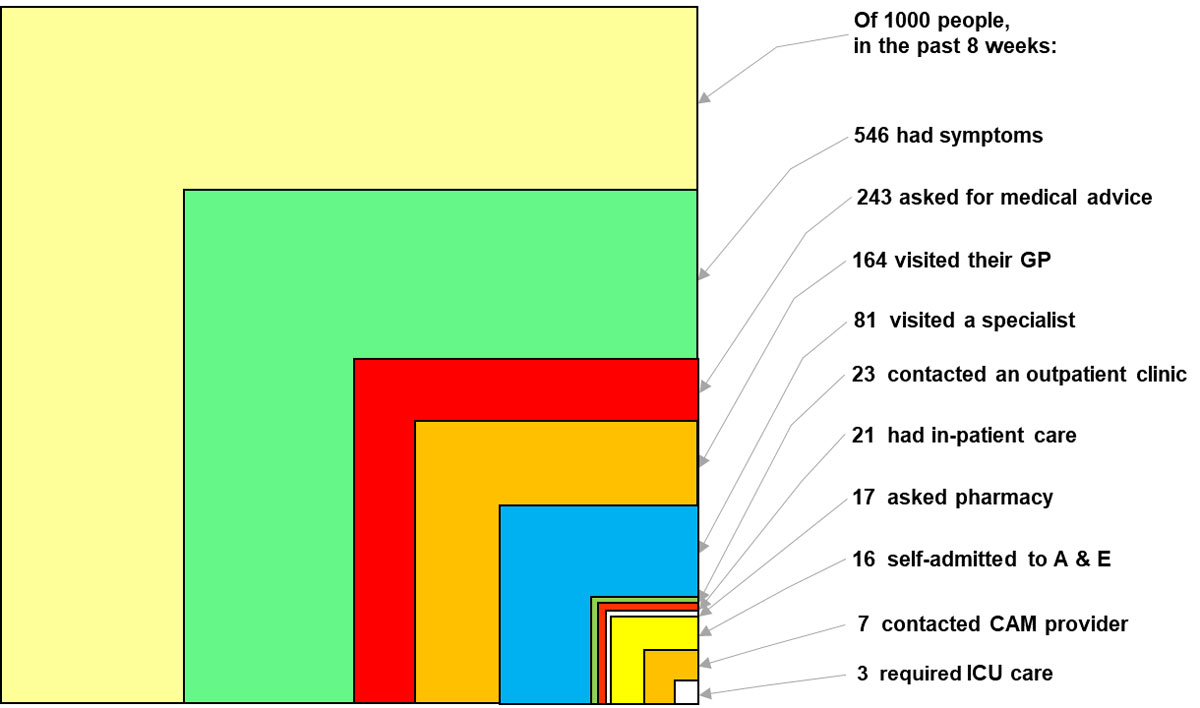
Figure 2 Sources of health advice.
Table 2 Medical ecology in terms of type of care (sources of health advice, use of medication, hospital or post-hospital care).
| Out of 1000 Swiss residents within the past 2 months… | Weighted rate | 95% CI | |
|---|---|---|---|
| Health problems | |||
| Had one or more health problems | 546 | 495 | 596 |
| … One | 360 | 315 | 405 |
| … More than one | 184 | 152 | 216 |
| Asked for medical advice | 243 | 206 | 280 |
| Sources of health advice | |||
| Visited a… | |||
| … General practitioner | 164 | 132 | 195 |
| … Specialist physician | 81 | 59 | 103 |
| … Outpatient clinic | 23 | 12 | 34 |
| … Pharmacy | 17 | 3 | 31 |
| … Accident and emergency unit | 16 | 7 | 24 |
| … Telephone medical advice centre | 8 | 0 | 15 |
| … Family/friends | 7 | 1 | 13 |
| … Complementary and alternative medicine practitioner | 7 | 1 | 12 |
| … Dentist | 6 | 0 | 12 |
| … Physiotherapy | 4 | 0 | 7 |
| … Internet | 3 | 0 | 7 |
| … Drugstore | 2 | 0 | 5 |
| … Others(associate of medhome, atlasoid, chiropractor) | 6 | 0 | 12 |
| Use of medication | |||
| Took medication | 386 | 344 | 429 |
| Purchased medication … | 259 | 222 | 296 |
| ... In pharmacy | 207 | 174 | 239 |
| ... In drugstore | 27 | 14 | 41 |
| … At physician’s | 24 | 13 | 36 |
| … In supermarket | 12 | 0 | 25 |
| … Other | 4 | 0 | 10 |
| … In internet | 0 | 0 | 0 |
| Hospital and post-hospital care | |||
| Had in-patient hospital care … | 20 | 12 | 29 |
| … in normal care unit | 18 | 10 | 26 |
| … in intensive care unit | 3 | 0 | 5 |
| … had a surgical procedure | 8 | 3 | 13 |
| … were in regional hospital | 6 | 2 | 11 |
| … were in university hospital | 6 | 1 | 11 |
| … were in cantonal hospital | 5 | 1 | 9 |
| … were in private hospital | 3 | 0 | 7 |
| Had post-hospital care … | |||
| … were in rehabilitation clinic | 5 | 1 | 9 |
| … had ambulatory nursing care | 3 | 0 | 6 |
| Registration with general practitioner | |||
| Is permanently registered with a general practitioner | 949 | 899 | 1000 |
Among 1000 Swiss residents, 21 required inpatient hospital care, 8 required a surgical procedure and 3 were treated in an intensive care unit (table 2). Hospitals from the public sector shared an equal burden, each level of hospital care was named by five to six persons out of 1000 Swiss residents. Three respondents reported inpatient treatment in a private clinic. Four subjects had post-hospital care in a rehabilitation clinic and three required ambulatory nursing care.
Table 3 shows how bimonthly health problems and healthcare participation rates vary by age, sex, language region and area type across all respondents (n = 1025). As a general trend, use of a GP, specialist and outpatient clinic, as well as hospitalisations, increased with age whereas self-reported health problems decreased with age. Emergency department utilisation peaked twice: in the group aged 18−29 years and in the group aged >80 years. Medical advice seeking remained stable across age groups. Women reported health problems, seeking medical advice and visiting GPs more often than men. Country dwellers gave an account of health problems, seeking medical advice and visiting GPs less often than city dwellers. Italian-speaking people reported health problems and visiting a specialist more often than French- or German-speaking people.
Table 3 Medical ecology in terms of type of care according to age, sex, language region, and area type relative to all respondents (n = 1025).
| Self-reported health problems | Seeking of medical advice | GP visit | Specialist visit | Outpatient clinic visit | Emergency department visit | Pharmacy | Hospital stay | |||||||||||||||||
|---|---|---|---|---|---|---|---|---|---|---|---|---|---|---|---|---|---|---|---|---|---|---|---|---|
| n/N rate/1000 with 95% CI | n/N rate/1000 with 95% CI | n/N rate/1000 with 95% CI | n/N rate/1000 with 95% CI | n/N rate/1000 with 95% CI | n/N rate/1000 with 95% CI | n/N rate/1000 with 95% CI | n/N rate/1000 with 95% CI | |||||||||||||||||
| Sex | ||||||||||||||||||||||||
| Men (N = 504) | 492 | 414 | 568 | 190 | 145 | 237 | 119 | 83 | 155 | 75 | 45 | 108 | 28 | 9 | 45 | 10 | 1 | 19 | 22 | 2 | 40 | 16 | 6 | 28 |
| Women (N = 521) | 599 | 519 | 679 | 294 | 233 | 355 | 207 | 154 | 259 | 84 | 54 | 116 | 19 | 7 | 33 | 21 | 7 | 36 | 13 | 0 | 34 | 25 | 11 | 37 |
| Age (years) | ||||||||||||||||||||||||
| 18−29 (N = 184) | 620 | 478 | 760 | 223 | 134 | 310 | 152 | 78 | 232 | 33 | 7 | 60 | 5 | 0 | 16 | 16 | 0 | 43 | 11 | 0 | 26 | 16 | 0 | 35 |
| 30−44 (N =262) | 611 | 472 | 752 | 233 | 145 | 320 | 126 | 55 | 197 | 53 | 20 | 87 | 8 | 0 | 14 | 8 | 0 | 18 | 42 | 0 | 92 | 11 | 1 | 19 |
| 45−59 (N = 280) | 500 | 392 | 606 | 218 | 144 | 289 | 164 | 106 | 225 | 111 | 54 | 170 | 36 | 5 | 63 | 0 | 0 | 1 | 11 | 0 | 32 | 11 | 0 | 22 |
| 60−79 (N = 234) | 509 | 409 | 610 | 299 | 220 | 377 | 214 | 148 | 282 | 115 | 64 | 166 | 34 | 9 | 63 | 30 | 5 | 56 | 4 | 0 | 12 | 26 | 5 | 46 |
| 80−100 (N = 63) | 413 | 250 | 585 | 270 | 137 | 408 | 159 | 48 | 260 | 63 | 6 | 129 | 48 | 0 | 114 | 48 | 0 | 114 | 0 | 0 | 0 | 95 | 10 | 191 |
| Language region | ||||||||||||||||||||||||
| German (N = 732) | 561 | 502 | 622 | 224 | 185 | 264 | 149 | 114 | 183 | 64 | 43 | 86 | 23 | 11 | 35 | 15 | 6 | 25 | 19 | 1 | 36 | 19 | 9 | 30 |
| French (N = 248) | 476 | 372 | 582 | 290 | 199 | 384 | 198 | 121 | 273 | 105 | 47 | 162 | 24 | 0 | 55 | 20 | 0 | 41 | 16 | 0 | 41 | 24 | 6 | 45 |
| Italian (N = 45) | 667 | 471 | 862 | 289 | 105 | 457 | 222 | 81 | 368 | 222 | 48 | 385 | 22 | 0 | 34 | 0 | 0 | 0 | 0 | 0 | 0 | 22 | 0 | 34 |
| Area type | ||||||||||||||||||||||||
| Urban (N = 749) | 583 | 516 | 650 | 270 | 221 | 317 | 184 | 143 | 225 | 88 | 60 | 115 | 24 | 10 | 38 | 15 | 4 | 25 | 21 | 3 | 41 | 20 | 10 | 31 |
| Rural (N = 276) | 446 | 358 | 531 | 174 | 121 | 226 | 109 | 69 | 148 | 62 | 27 | 97 | 22 | 4 | 40 | 18 | 3 | 34 | 4 | 0 | 11 | 22 | 6 | 35 |
CI = confidence interval; n/N = proportion number / total number Data are for all persons who responded to the survey (n = 1025) in a 2-month period. Weighted numbers are rounded.
Table 4 shows differences in type of care according to age, sex, language region and area type within persons who asked for medical advice (n = 243). GP, outpatient clinics and pharmacy visits remained stable within subgroups. However, the use of specialists peaked in the group aged 45−59 years (52%) and emergency department visits increased with age.
Table 4 Medical ecology in terms of type of care according to age, sex, language region, and area type relative to those who asked for medical advice (n = 243).
| GP visit | Specialist visit | Outpatient clinic visit | Emergency department visit | Pharmacy visit | ||||||||||||||||
|---|---|---|---|---|---|---|---|---|---|---|---|---|---|---|---|---|---|---|---|---|
| n/N/100 with 95% CI | p-value* | n/N/100 with 95% CI | p-value* | n/N/100 with 95% CI | p-value* | n/N/100 with 95% CI | p-value* | n/N/100 with 95% CI | p-value* | |||||||||||
| By sex | ||||||||||||||||||||
| Men (N = 94) | 62 | 44 | 82 | 0.313 | 40 | 23 | 57 | 0.165 | 14 | 5 | 23 | 0.107 | 5 | 1 | 10 | 0.524 | 11 | 1 | 21 | 0.280 |
| Women (N = 149) | 71 | 52 | 88 | 29 | 18 | 40 | 7 | 2 | 11 | 7 | 2 | 12 | 5 | 0 | 11 | |||||
| By age (years) | ||||||||||||||||||||
| 18−29 (N = 40) | 70 | 36 | 100 | 0.254 | 15 | 3 | 27 | 0.007 | 2 | 0 | 7 | 0.075 | 7 | 0 | 19 | 0.028 | 5 | 0 | 11 | 0.053 |
| 30−44 (N = 59) | 54 | 23 | 84 | 23 | 8 | 37 | 3 | 0 | 6 | 3 | 0 | 8 | 18 | 0 | 40 | |||||
| 45−59 (N = 59) | 77 | 49 | 100 | 52 | 25 | 79 | 16 | 2 | 29 | 0 | 0 | 1 | 5 | 0 | 15 | |||||
| 60−79 (N = 68) | 72 | 50 | 96 | 39 | 21 | 56 | 12 | 3 | 21 | 10 | 2 | 19 | 1 | 0 | 4 | |||||
| 80−100 (N = 17) | 59 | 18 | 96 | 24 | 2 | 48 | 18 | 0 | 42 | 18 | 0 | 42 | 0 | 0 | 0 | |||||
| By language region | ||||||||||||||||||||
| German (N = 160) | 66 | 51 | 82 | 0.796 | 29 | 19 | 38 | 0.017 | 10 | 5 | 16 | 0.728 | 7 | 2 | 11 | 0.708 | 8 | 0 | 16 | 0.690 |
| French (N = 71) | 67 | 41 | 93 | 36 | 16 | 56 | 8 | 0 | 19 | 7 | 0 | 14 | 6 | 0 | 14 | |||||
| Italian (N = 12) | 77 | 28 | 100 | 77 | 17 | 100 | 8 | 0 | 12 | 0 | 0 | 0 | 0 | 0 | 0 | |||||
| By area type | ||||||||||||||||||||
| Urban (N = 197) | 68 | 53 | 84 | 0.510 | 33 | 22 | 43 | 0.717 | 9 | 4 | 14 | 0.492 | 5 | 2 | 9 | 0.220 | 8 | 1 | 15 | 0.164 |
| Rural (N = 47) | 62 | 40 | 85 | 35 | 15 | 56 | 12 | 2 | 23 | 10 | 2 | 19 | 2 | 0 | 6 | |||||
CI = confidence interval Data are for persons who asked for medical advice (n = 243) in a 2-month period. Weighted numbers are rounded. * Pearson’s χ2: Rao and Scott adjustment
This study is the first population-based survey in Switzerland aiming to map healthcare behaviours of the population by using the ecology of care framework [1]. Of 1000 Swiss residents, we found that in the past 2 months on average around 50% reported health problems, and slightly more than half of them sought professional medical help for their symptoms. In total, 164 contacted a GP and 81 contacted a specialist. Overall, 21 out of 1000 individuals required in-patient hospital care within that 2-month period and three subjects needed treatment in an intensive care unit.
To date, several studies of healthcare utilisation have been conducted using approximately the same methodology as applied in our study [2, 3, 5–8]. In contrast to previous studies that assessed 4 to 5 weeks, the current observation time was 8 weeks, so as to increase the probability of capturing a person’s recent healthcare utilisation. This observation time difference may be taken into account when the current rates are compared with other results. Further, comparisons between the various studies are difficult owing to different national healthcare systems, i.e., diverse access to healthcare, reimbursement policies, as well as cultural aspects.
However, some interesting similarities and differences are of note. For instance, compared with the findings in Canada [7], the average rate of contact with a GP per 1000 people was higher in the Canadian survey than in Switzerland (238 vs 164/1000 individuals). On the other hand, patients seeking medical advice with a specialist were comparable to our results (81 vs 70/1000 individuals). In addition, overnight hospital stays were markedly lower in the Canadian provinces compared with the rates found in Switzerland (21 vs 8/1000 individuals). One explanation for this pattern could be the density of hospitals, which is substantially higher in Switzerland than in Canada according to the latest statistics of the OECD (19.7 vs 33.3 per one million inhabitants in 2018) [30]. An alternative explanation of the difference in overnight hospital stays might be that the study from Canada included only patients with chronic conditions. However, a clear definition of chronic disease was not explicitly described in the Canadian paper. It seems probable that acute illnesses or injuries were not measured in the Canadian study.
In Europe, studies on health care utilisation have been published for Austria, Sweden and Norway. Austria has universal healthcare coverage and free provider choice, but a weak primary care sector compared with countries with similar socioeconomic conditions. Austria showed higher monthly rates of healthcare use than Switzerland, in particular concerning GP visits (336 vs 164/1000 individuals), specialist visits in the ambulatory care setting (206 vs 23/1000 individuals) and hospital stays (35 vs 20/1000 individuals) [13]. As a reaction to this overall high utilisation, which was particularly prominent in the secondary and tertiary care sectors, with rates four times those found in the US, the authors proposed to restrict the free provider choice in terms of the ability to choose a secondary and tertiary care provider directly, in order to reverse overutilisation and to strengthen the primary care sector. In contrast to Austria, a strong gatekeeper role of GPs exists in Norway; i.e., access to specialist care is − as a rule − achieved by referral from GPs or GP-based municipality emergency clinics. Compared with the US (250/1000), Japan (232/1000) and Hong Kong (372/1000), Norwegians (214/1000) displayed a lower monthly rate of visits to physicians who provide services directly to patients [16]. The authors found this surprising, since Norway offers national health insurance coverage and access for all to a primary care doctor, and concluded that good access does not necessarily lead to higher utilisation. Sweden has a publicly funded healthcare system and highly reliable population-based registers. It was shown that the physician’s office in primary care is the setting that has the potential to reach the largest number of people (87 out of 1000 residents within a month) [31].
We detected cultural differences concerning the use of complementary and alternative medical care (CAM) providers between Switzerland and the US as well as Asia. In our survey, only a small minority (6 out of 1000 individuals) sought medical advice from a CAM providers as compared with the US landmark study by Green [2], which reported that 65 out of 1000 individuals visited CAM providers. The use of CAM providers in the US is much closer to rates usually reported in Asian (54/1000 in Hong Kong [18], 78/1000 in Beijing [21], 67/1000 in Taiwan [20] and 49−117/1000 in Japan [22, 32]).
Our results indicate that GPs are the most important source of medical advice and that the vast majority of respondents are registered with a GP. Of those who sought medical advice because of a health complaint, the attending rates were 67% for primary care, 46% for secondary care and 6% for tertiary care. Thus, health problems of the Swiss population were predominantly dealt with by the primary healthcare sector. In contrast, the distribution of health care in Switzerland shows a correspondingly low proportion of generalists at 28−43% [5, 10]. If healthcare provision should be distributed based on needs to provide equal access, then there seems to be a mismatch in Switzerland. This incompatibility between available specialist capacity and the demand for GPs indicates the need for reconfiguring the primary healthcare sector in Switzerland. Starfield et al. claimed that a qualitatively well-functioning primary care system prevents hospital admissions [33]. Indeed, several studies across a wide range of international settings show that greater investment in primary healthcare is associated with improved population health outcomes, reduced secondary care usage and reduced overall healthcare costs [33–35]. On the other hand, sound evidence suggests that healthcare consumption is supply-sensitive, and that the demand − for both primary and hospital care − is influenced by the current offer [36–38]. Consequently, Swiss policy makers might consider re-allocating resources according to the needs of the Swiss population and cost-efficiency in healthcare.
A fit-for-purpose workforce is essential to deliver primary healthcare, yet the world has an estimated shortfall of 18 million health workers [39]. In the US, a study projecting the number of primary care physicians required to meet US healthcare utilisation needs in the future came to the conclusion that they will require nearly 52,000 additional primary care physicians by 2025, driven by population growth and ageing [40]. In Switzerland also, the ageing of GPs is a source of major concern, with many retirements in the coming years without a significant increase in the number of young physicians choosing this specialty compared with other specialties [10]. In 2016, the Swiss Confederation decided to support the universities with an additional loan of CHF 100 million as part of a nationwide coordinated special programme. The goal was to substantially increase the number of medical graduates. Moreover, previous studies using the ecology model indicated that the focus of medical education activities should be at the care-providing sites that handle the major load of care contacts [17, 41]. These efforts in medical education will be crucial to ensure that the workforce can meet the increasing primary care utilisation. In addition to recent health policy in Switzerland aiming to transfer hospital care from in-patient to out-patient settings, efforts to improve the availability of GPs and to create incentives for the use of primary care might help to slow down the rising costs in healthcare.
Another way to increased service capacity and to alleviate the pressures on the GP workforce is to establish a skill mix with multiprofessional teams in primary care as in other countries [42–44]. Josi et al. recently reported the skill mix in Swiss primary care group practices [45]. They reported that although nearly 50% of group practices have established non-physician professionals, only 25% of practices integrated these professionals with advanced roles. Josi et al. concluded that significant effort is needed to extend the uptake of non-physician professionals in primary care in Switzerland, as compared with other countries. Clear policy direction along with supporting regulation and financing arrangements are required [45].
There are limitations of the ecology of care framework and the methods we used in this analysis. As a result of the 2-month observation period, comparability with other studies may be restricted since other ecology of medical care studies have used 4 to 5 weeks. Whereas we confined the analysis to participants aged 18 years and older, in other studies the participants’ age varied (study in the UK and US with age 16 and over [17], study in US with all ages [15], study in US with age 0−17 [46], study in Hong Kong with all ages [18], study in Japan with all ages [22], study in Norway with age 30−87 [16]). Regional differences across cantons and language regions were not further accounted for. Additionally, the study may be prone to a selection bias; for example, people with chronic illnesses might be more likely to respond. The representation of rates with stacked squares may lead to the misinterpretation that a small box A is derived from the underlying larger box B. However, the graphical intersection of the two squares does not represent the intersection of A and B in the data. For example, a respondent who consulted a specialist physician may or may not have named a general practitioner too. The model does not establish causal pathways, nor a chronological order. Because of low numbers, particularly in the Italian speaking region, the results of the subgroup analysis across language regions has to be interpreted with care. The results are generalisable to the language-assimilated, Swiss population aged 18 years or older, but not to other populations within different healthcare systems, and to paediatric populations.
In summary, this study represents a first attempt to map the healthcare utilisation of the Swiss population. The results may be useful for further delineation of healthcare policies and medical education to meet the demands and needs of people in Switzerland. They indicate that general practitioners are the most important health care resource in Switzerland. Compared to specialists, they provide twice as much health advice at less costs. To optimise the health care system in Switzerland, we suggest allocation of resources where they are most needed, namely in primary care.
The appendix is available as a separate file at https://smw.ch/article/doi/smw.2020.20221.
We thank all participants for their valuable time and for participating in our study. Furthermore, we are grateful for the support of the LINK Institute (Luzern, Switzerland, https://www.link.ch/).
No financial support and no other potential conflict of interest relevant to this article was reported.
1 De Pietro C , Camenzind P , Sturny I , Crivelli L , Edwards-Garavoglia S , Spranger A , et al. Switzerland: Health system review. Health Syst Transit. 2015;17(4):1–288, xix.
2eurostat. Mortality and life expectancy statistics in 2017 2019. Available from: https://ec.europa.eu/eurostat/statistics-explained/index.php/Mortality_and_life_expectancy_statistics#Life_expectancy_at_birth_increased_in_2017_only_for_men.
3 Herzlinger RE , Parsa-Parsi R . Consumer-driven health care: lessons from Switzerland. JAMA. 2004;292(10):1213–20. doi:.https://doi.org/10.1001/jama.292.10.1213
4Davis K, Stremikis K, Squires D, Schoen C. Mirror, mirror on the wall. How the performance of the US Health care system compares internationally. New York: CommonWealth Fund; 2014.
5OECD. Health policy in Switzerland 2017 [cited 2019 November 25]. Available from: https://www.oecd.org/els/health-systems/Health-Policy-in-Switzerland-July-2017.pdf.
6Thomson S, Jonathan C, Tamás E. Can people afford to pay for health care? New evidence on financial protection in Europe. Copenhagen: World Health Organization Europe; 2019.
7Swiss Federal Statistical Office. Health care costs and financing 2017: provisional data. Neuchâtel: SFSO: 2019.
8 Camenzind M . [“You cost too much! Now finally save!”]. Krankenpfl Soins Infirm. 2012;105(10):10–3, 46–9, 66–9. In French, German, Italian.
9Federal Office of Public Health. Medreg https://www.medregbm.admin.ch/Publikation/Liste2019 [cited 2019 10. September].
10Senn N, Ebert S, Cohidon C. Analyse et perspectives sur la base des indicateurs du programme SPAM. OBSAN Dossier 55. Neuchâtel: Schweizerisches Gesundheitsobservatorium (Obsan); 2016.
11 Schäfer WL , Boerma WG , van den Berg MJ , De Maeseneer J , De Rosis S , Detollenaere J , et al. Are people’s health care needs better met when primary care is strong? A synthesis of the results of the QUALICOPC study in 34 countries. Prim Health Care Res Dev. 2019;20:e104. doi:.https://doi.org/10.1017/S1463423619000434
12Medienmitteilung der mfe. Medizinische Grundversorgung: Neue Studie prognostiziert rasant steigenden Hausarztmangel mit hohen Kostenfolgen https://www.hausaerzteschweiz.ch/fileadmin/user_upload/hausaerzteschweiz/Dokumente/Tag_der_Hausarztmedizin/mfe_Medienmitteilung_310316_D.pdf2016.
13 Pichlhöfer O , Maier M . Unregulated access to health-care services is associated with overutilization--lessons from Austria. Eur J Public Health. 2015;25(3):401–3. doi:.https://doi.org/10.1093/eurpub/cku189
14 Stewart M , Ryan B . Ecology of health care in Canada. Can Fam Physician. 2015;61(5):449–53.
15 Green LA , Fryer GE, Jr , Yawn BP , Lanier D , Dovey SM . The ecology of medical care revisited. N Engl J Med. 2001;344(26):2021–5. doi:.https://doi.org/10.1056/NEJM200106283442611
16 Hansen AH , Halvorsen PA , Førde OH . The ecology of medical care in Norway: wide use of general practitioners may not necessarily keep patients out of hospitals. J Public Health Res. 2012;1(2):177–83. doi:.https://doi.org/10.4081/jphr.2012.e28
17 White KL , Williams TF , Greenberg BG . The ecology of medical care. N Engl J Med. 1961;265(18):885–92. doi:.https://doi.org/10.1056/NEJM196111022651805
18 Leung GM , Wong IO , Chan WS , Choi S , Lo SV ; Health Care Financing Study Group. The ecology of health care in Hong Kong. Soc Sci Med. 2005;61(3):577–90. doi:.https://doi.org/10.1016/j.socscimed.2004.12.029
19Pichlhoefer O, Kutalek R, Spiegel W, Shibamori Y, Zehetmayer S, Maier M, eds. The Ecology Of Medical Care In Austria2011; Warsaw.
20 Shao CC , Chang CP , Chou LF , Chen TJ , Hwang SJ . The ecology of medical care in Taiwan. J Chin Med Assoc. 2011;74(9):408–12. doi:.https://doi.org/10.1016/j.jcma.2011.08.005
21 Shao S , Zhao F , Wang J , Feng L , Lu X , Du J , et al. The ecology of medical care in Beijing. PLoS One. 2013;8(12):e82446. doi:.https://doi.org/10.1371/journal.pone.0082446
22 Tsuguya F , Mahbubur R , Osamu T , Mayuko S , Takuro S , Hiroyoshi E , et al. The Ecology of Medical Care in Japan. JMAJ. 2005;48(4):163–7.
23Federal Statistical Office. Structural Survey https://www.bfs.admin.ch/bfs/en/home/statistics/population/surveys/se.html2016 [cited 2019 16. September].
24 T. S. Weighting survey results. J Mark Res Soc. 1986;28:269–84.
25Federal Statistical Office. Population and Households Statistics, 2010-2017 2018. Available from: https://www.bfs.admin.ch/bfs/en/home/statistics/catalogues-databases/tables.assetdetail.6087024.html.
26Federal Statistical Office. Arbeitsmarktstatus nach Geschlecht, Nationalität, Altersgruppen, Familientyp 2019. Available from: https://www.bfs.admin.ch/bfs/en/home/statistics/catalogues-databases/tables.assetdetail.9366448.html.
27Federal Statistical Office. STATPOP. Permanent and non-permanent resident population by institutional units, citizenship (category), sex and age 2016. Available from: https://www.bfs.admin.ch/bfs/en/home/statistics/catalogues-databases/tables.assetdetail.9566416.html.
28Lumley T. Analysis of Complex Survey Samples. CRAN Repository. 2019 [updated 2019-04-27; cited 2019 25th October]. Available from: https://cran.r-project.org/web/packages/survey/survey.pdf.
29The American Association for Public Opinion Research. Standard Definitions: Final Dispositions of Case Codes and Outcome Rates for Surveys 9th edition. AAPOR 2016. Available from: https://www.aapor.org/AAPOR_Main/media/publications/Standard-Definitions20169theditionfinal.pdf
30OECD. Health Care Resources 2019 [cited 2019 August ]. Available from: https://stats.oecd.org/index.aspx?DataSetCode=HEALTH_REAC#.
31 Ferro A , Kristiansson PM . Ecology of medical care in a publicly funded health care system: a registry study in Sweden. Scand J Prim Health Care. 2011;29(3):187–92. doi:.https://doi.org/10.3109/02813432.2011.585546
32 Fukui T , Rahman M , Ohde S , Hoshino E , Kimura T , Urayama KY , et al. Reassessing the Ecology of Medical Care in Japan. J Community Health. 2017;42(5):935–41. doi:.https://doi.org/10.1007/s10900-017-0337-4
33 Starfield B , Shi L , Macinko J . Contribution of primary care to health systems and health. Milbank Q. 2005;83(3):457–502. doi:.https://doi.org/10.1111/j.1468-0009.2005.00409.x
34 Gravelle H , Morris S , Sutton M . Are family physicians good for you? Endogenous doctor supply and individual health. Health Serv Res. 2008;43(4):1128–44. doi:.https://doi.org/10.1111/j.1475-6773.2007.00823.x
35 Jarman B , Gault S , Alves B , Hider A , Dolan S , Cook A , et al. Explaining differences in English hospital death rates using routinely collected data. BMJ. 1999;318(7197):1515–20. doi:.https://doi.org/10.1136/bmj.318.7197.1515
36 Wennberg JE , Fisher ES , Skinner JS . Geography And The Debate Over Medicare Reform: A reform proposal that addresses some underlying causes of Medicare funding woes: geographic variation and lack of incentive for efficient medical practices. Health Aff (Millwood). 2002;21(Suppl1):W96–112. doi:.https://doi.org/10.1377/hlthaff.W2.96
37 Kravet SJ , Shore AD , Miller R , Green GB , Kolodner K , Wright SM . Health care utilization and the proportion of primary care physicians. Am J Med. 2008;121(2):142–8. doi:.https://doi.org/10.1016/j.amjmed.2007.10.021
38 Gulliford MC . Availability of primary care doctors and population health in England: is there an association? J Public Health Med. 2002;24(4):252–4. doi:.https://doi.org/10.1093/pubmed/24.4.252
39WHO. Primary health care WHO Newsroom2019 [updated 27 February 2019; cited 2019 11th October]. Available from: https://www.who.int/news-room/fact-sheets/detail/primary-health-care.
40 Petterson SM , Liaw WR , Phillips RL, Jr , Rabin DL , Meyers DS , Bazemore AW . Projecting US primary care physician workforce needs: 2010-2025. Ann Fam Med. 2012;10(6):503–9. doi:.https://doi.org/10.1370/afm.1431
41 White KL . The ecology of medical care: origins and implications for population-based healthcare research. Health Serv Res. 1997;32(1):11–21.https://doi.org/10.1111/1475-6773.12101
42 Groenewegen P , Heinemann S , Greß S , Schäfer W . Primary care practice composition in 34 countries. Health Policy. 2015;119(12):1576–83. doi:.https://doi.org/10.1016/j.healthpol.2015.08.005
43 Freund T , Everett C , Griffiths P , Hudon C , Naccarella L , Laurant M . Skill mix, roles and remuneration in the primary care workforce: who are the healthcare professionals in the primary care teams across the world? Int J Nurs Stud. 2015;52(3):727–43. doi:.https://doi.org/10.1016/j.ijnurstu.2014.11.014
44 Buchan J , Dal Poz MR . Skill mix in the health care workforce: reviewing the evidence. Bull World Health Organ. 2002;80(7):575–80.
45 Josi R , De Pietro C . Skill mix in Swiss primary care group practices - a nationwide online survey. BMC Fam Pract. 2019;20(1):39. doi:.https://doi.org/10.1186/s12875-019-0926-7
46 Dovey S , Weitzman M , Fryer G , Green L , Yawn B , Lanier D , et al. The ecology of medical care for children in the United States. Pediatrics. 2003;111(5 Pt 1):1024–9. doi:.https://doi.org/10.1542/peds.111.5.1024
No financial support and no other potential conflict of interest relevant to this article was reported.