icumonitoring.ch
: a platform for short-term forecasting of intensive care unit occupancy during the COVID-19 epidemic in Switzerland
DOI: https://doi.org/10.4414/smw.2020.20277
Cheng
Zhaoa*, Burcu
Tepekuleb*, Nicola G.
Criscuoloa*, Pedro D.
Wendel Garciac, Matthias P.
Hiltyc, , Thierry
Fumeauxde, Thomas P.
Van Boeckelaf, RISC-19-ICU Investigators for Switzerland
aHealth Geography and Policy Group, ETH Zürich, Switzerland
bUniversity Hospital Zurich, Switzerland
cInstitute of Intensive Care Medicine, University Hospital of Zurich, Switzerland
dService de médecine et des soins intensifs, Hôpital de Nyon, Switzerland
ePresident, Swiss Society of Intensive Care Medicine
fCentre for Disease Dynamics Economics and Policy, New Delhi, India
Summary
In Switzerland, the COVID-19 epidemic is progressively slowing down owing to “social distancing” measures introduced by the Federal Council on 16 March 2020. However, the gradual ease of these measures may initiate a second epidemic wave, the length and intensity of which are difficult to anticipate. In this context, hospitals must prepare for a potential increase in intensive care unit (ICU) admissions of patients with acute respiratory distress syndrome. Here, we introduce icumonitoring.ch, a platform providing hospital-level projections for ICU occupancy. We combined current data on the number of beds and ventilators with canton-level projections of COVID-19 cases from two S-E-I-R models. We disaggregated epidemic projection in each hospital in Switzerland for the number of COVID-19 cases, hospitalisations, hospitalisations in ICU, and ventilators in use. The platform is updated every 3-4 days and can incorporate projections from other modelling teams to inform decision makers with a range of epidemic scenarios for future hospital occupancy.
Introduction
The COVID-19 epidemic currently affecting Switzerland seems to be progressively slowing down. The inflection point of the epidemic curve of deaths [1] was passed on 06 April 2020 and, thus far, the number of COVID-19 cases with acute respiratory distress syndrome (ARDS) needing intensive care unit (ICU) admission or mechanical ventilation has not exceeded the ad hoc increase in ICU bed capacity and ventilator availability. However, the gradual ease of the lockdown measures that have been in place since 17 March 2020 [2] may initiate a second epidemic wave. As in other countries, there is currently considerable uncertainty about the true prevalence [3, 4] of COVID-19 in the Swiss population, and thus also about whether the country might achieve herd immunity and if so, when. The absence of specific therapies against the SARS-CoV-2 virus responsible for COVID-19 and the difficulty in anticipating the effect of lifting lockdown measures on movement intensity [5] and future infection rates [6] further contribute to this uncertainty. In this context, hospitals must prepare for a potential secondary increase in ICU admissions of unknown magnitude and duration.
Since the onset of the COVID-19 outbreak, disease modellers have tried to anticipate the trajectory of the COVID-19 epidemic in Switzerland. Some have focused on long-term policies at the national scale [7–9], whereas others focused on capturing and forecasting the dynamics of COVID-19 in individual cantons [6]. However, thus far little attention has been paid to generating forecasts at the spatial level where most interventions can take place: hospitals, and specifically ICUs.
During the same period, hospitals, healthcare facilities, government agencies and the Swiss Armed Forces have reacted to the COVID-19 outbreak on a day-to-day basis. Their actions consisted of, for example, expanding bed capacities [10], building stocks of personal protection equipment [11] or dispatching medical troops in support of hospitals [12]. Their actions have been guided by multiple surveillance efforts conducted in parallel by federal and cantonal authorities and professional healthcare societies. Amongst these is the IES system managed by the Coordinated Sanitary Service (CCS). This system should provide twice daily reports of the occupancy of emergency departments and hospital beds across the country. However, its use as a monitoring platform during the COVID-19 outbreak has proven difficult, owing to slow, incomplete and uneven reporting across hospitals. On 14 March 2020, just 15 hospitals effectively reported their bed occupancy, as compared with 156 hospitals on the 03 May 2020, after several measures were taken by the CCS in collaboration with the Swiss Society of Intensive Care Medicine (SSICM). In the coming weeks, resources available to manage COVID-19 patients with ARDS will need to be optimally deployed (within and between ICUs) to minimise the risk of overflow.
At least three challenges must be addressed to generate reliable hospital-level projections that could help ICU managers to anticipate the need for additional resources. First, the IES system needs to be accurately and regularly documented. Second, projections from national and cantonal epidemic models must be downscaled to the hospital level by making reasonable assumptions that reflect the situation experienced by clinicians. Third, the output of epidemic models must be summarised and rapidly transferred to clinicians in a format that is straightforward to inform management decisions in hospitals.
Addressing the first challenge is a task for individual hospitals, which should ensure and control accuracy of IES collected data: models can inform decisions, but only reliable data can help modellers to help hospitals. For the second challenge, tools from the field of spatial analysis can be used to disaggregate information generated in polygons (cantons) to individual hospitals (latitude/longitude coordinates) while accounting for the respective “catchment areas” of these hospitals. These approaches have been used extensively in spatial epidemiology to study the treatment-seeking behaviour of human immunodeficiency virus patients on antiretroviral therapy [13], the allocation of bed nets against malaria [14] and access to emergency maternal care [15]. For the third challenge, the recent development of web-based applications enables rapid display and update of model outputs using a simple web browser. In particular, Shiny apps give users the possibility to query regions/hospitals interactively, and thus represent an improvement from static maps in “one-off” publications.
Here, we introduce icumonitoring.ch, a platform of ICU bed occupancy forecasting for individual hospitals in Switzerland based on projections from two canton-level epidemic models. Our framework is flexible, and projections from other modelling groups can be integrated using a “forecast template”. For confidentiality reasons, this article only presents aggregated results at the canton level. Access to projections for individual hospitals in icumonitoring.ch are available upon request to the communicating author; the password will be automatically issued for ICU healthcare workers.
Methods
Data
Time series of hospitalisations in ICUs in Switzerland as reported in the IES system were provided by the Swiss Armed Forces. This dataset consists of reports of ICU bed occupancy by COVID19 and non-COVID19 patients, adults and children. This database, which is updated twice a day, reports the number of patients in ICU beds and the number of these beds equipped with ventilators. The number for extracorporeal membrane oxygenation (ECMO) is included in the number of beds with ventilators. Importantly, this database contains an estimate of the number of SSMIC-certified ICU beds, as well as the number of ad hoc beds since the start of the COVDI-19 outbreak. In some hospitals, the number of COVID-19 patients entered in the IES system was higher than the number total number of patients. Similarly, in some hospitals the number of ventilated COVID-19 patients was higher than the total number of COVID-19 patients. As these situations are de facto impossible, we assumed that the person who entered the data considered COVID-19 not to be part of the pool of all patients, which it should. These inputs were corrected such that if the number of COVID-19 patients were higher than the total number of patients, then the total number of patients was calculated as the sum the number of COVID-19 patients reported and the number of patients reported. If the number of ventilated COVID-19 patients were higher than the number of COVID-19 patients then the number or COVID-19 patients was calculated as the sum of the number of COVID-19 patients reported and the number of ventilated COVID-19 patients reported. For hospitals that did not report on 03 May 2020, we used numbers (beds, patients, ventilators) provided for the last date of reporting available.
Near real-time data on ICU length of stay and mortality has been collected using the RIsk Stratification in COVID-19 patients in the Intensive Care Unit (RISC-19-ICU) registry, a collaborative effort with the participation of a majority of the Swiss ICUs to provide a basis for decision support during the ongoing public health crisis. The registry was deemed exempt from the need for additional ethics approval and patient informed consent by the ethics committee of the University of Zurich (KEK 2020-00322, ClinicalTrials.gov Identifier: NCT04357275). The data were collected using a secure REDCap infrastructure provided by the Swiss Society of Intensive Care Medicine. As of 03 May 2020, 68.5% of critically ill patients with COVID-19 admitted to an ICU in Switzerland and who have entered the registry had already been dismissed from the ICU or had died.
This analysis accounts for “patient disappearance” from the IES system in Ticino (131 patients on 28 March 2020) at Clinica Luganese Moncucco and Ospedale Regionale di Lugano (42 patients on 01 April 2020), as well as in Vaud (148 patients on 25 March 2020) at Hôpital Riviera-Chablais, Centre hospitalier de Rennaz. These institutions seem to have either stopped reporting or transferred all of their patients on the dates mentioned above. In these hospitals, patients were removed from the IES system and did not reappear in other hospitals in the canton. Media sources referred to only a very small number of patients from Ticino who were hosted in the German-speaking part of the country. We have attempted to gather information from Clinica Luganese Moncucco, but they declined to answer our questions regarding the number of patients in their ICU. We accounted for “patient disappearance” by creating a “Hospital X” in the two cantons concerned. This adjustment is meant as a way to account for all active acute COVID-19 cases.
Epidemic forecasting
CZ Model
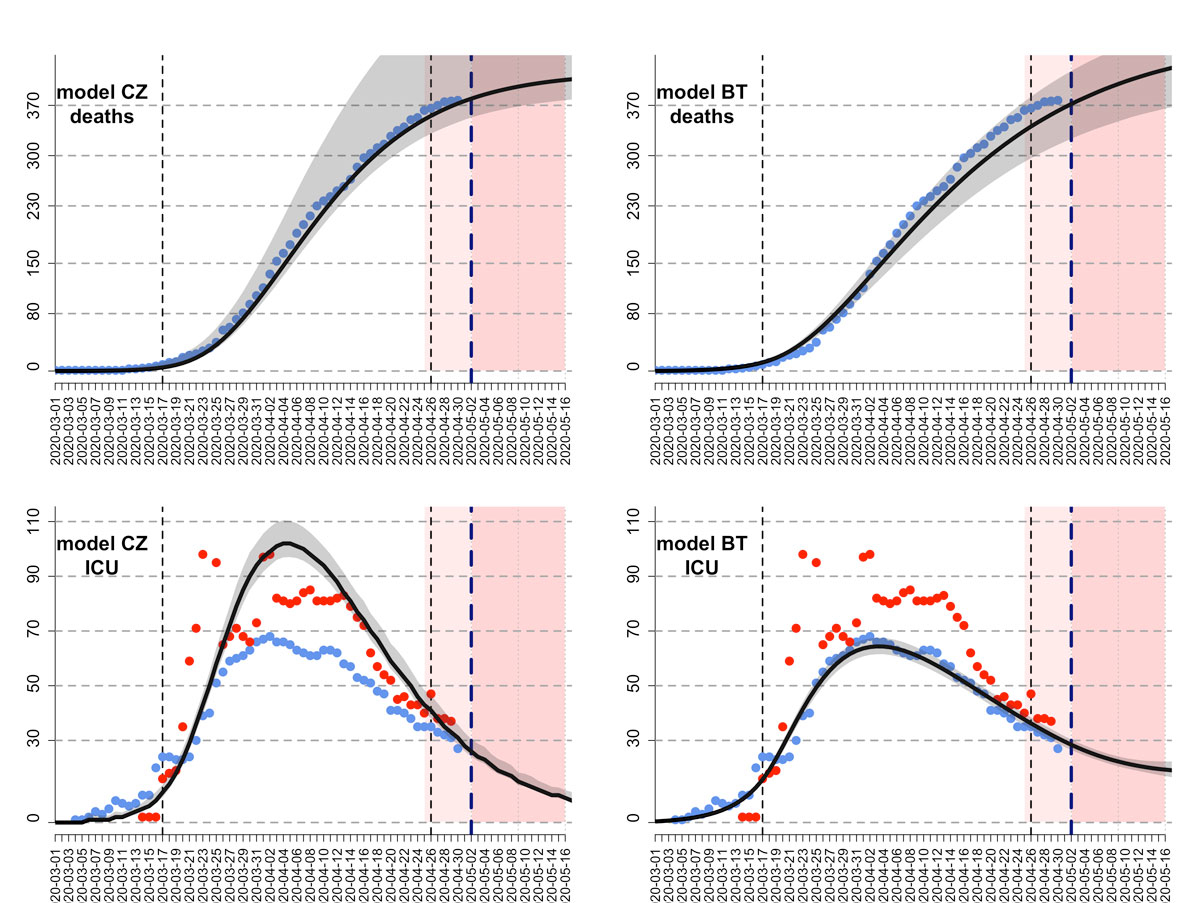
We used an S-E-I-R model developed by Althaus and colleagues ([8], accessed 24 April 2020) to model epidemics of COVID-19 in Swiss cantons (figure 1). The model assumed constant uncontrolled transmission until the soft lockdown measures on 17 March 2020 [16]. The basic reproduction number and the reduction in transmission after the soft lockdown were estimated using a maximum likelihood framework. Following the announcement from the Federal Council that lockdown measures would be eased from 27 April 2020 [17], the model assumed that contact would be resumed to 50% of pre-lockdown levels from that date. The model was fitted to the reported numbers of deaths in 18 cantons where enough data on times series of death were available for parameter inference. The inference was made using maximum likelihood with the Nelder and Mead algorithm implemented in the function optim in the R statistical Software. The number of deaths per canton up to 02 May 2020 was retrieved at 21:00 on 03 May 2020 from OpenZH [1]. The number of deaths on 03 May 2020 was incomplete and subject to future modifications and was therefore not used for the epidemic modelling. For each canton, the model predictions included five categories: infected cases (IF), hospitalised cases (HS), ICU cases (IC), immune cases (IM) and death cases (DE). Infected cases were calculated as the sum of exposed cases, infectious cases, hospitalised cases and ICU cases. In the remaining eight cantons (Appenzell Innerrhoden, Glarus, Jura, Nidwalden, Obwalden, Schaffhausen, Uri, Zug), models could not be fitted because of the lower number of deaths. There we calculated the model predictions in proportion to the number of COVID-19 cases reported in each of these cantons, in the last eight days. The model predictions in each canton were adjusted, such that they summed up to the model predictions at the national level. The final outcome of the epidemic model prediction was an estimation of the number of IF, HS, IC, IM, and DE for each day in each canton, as well as the 95% confidence intervals of the predictions.
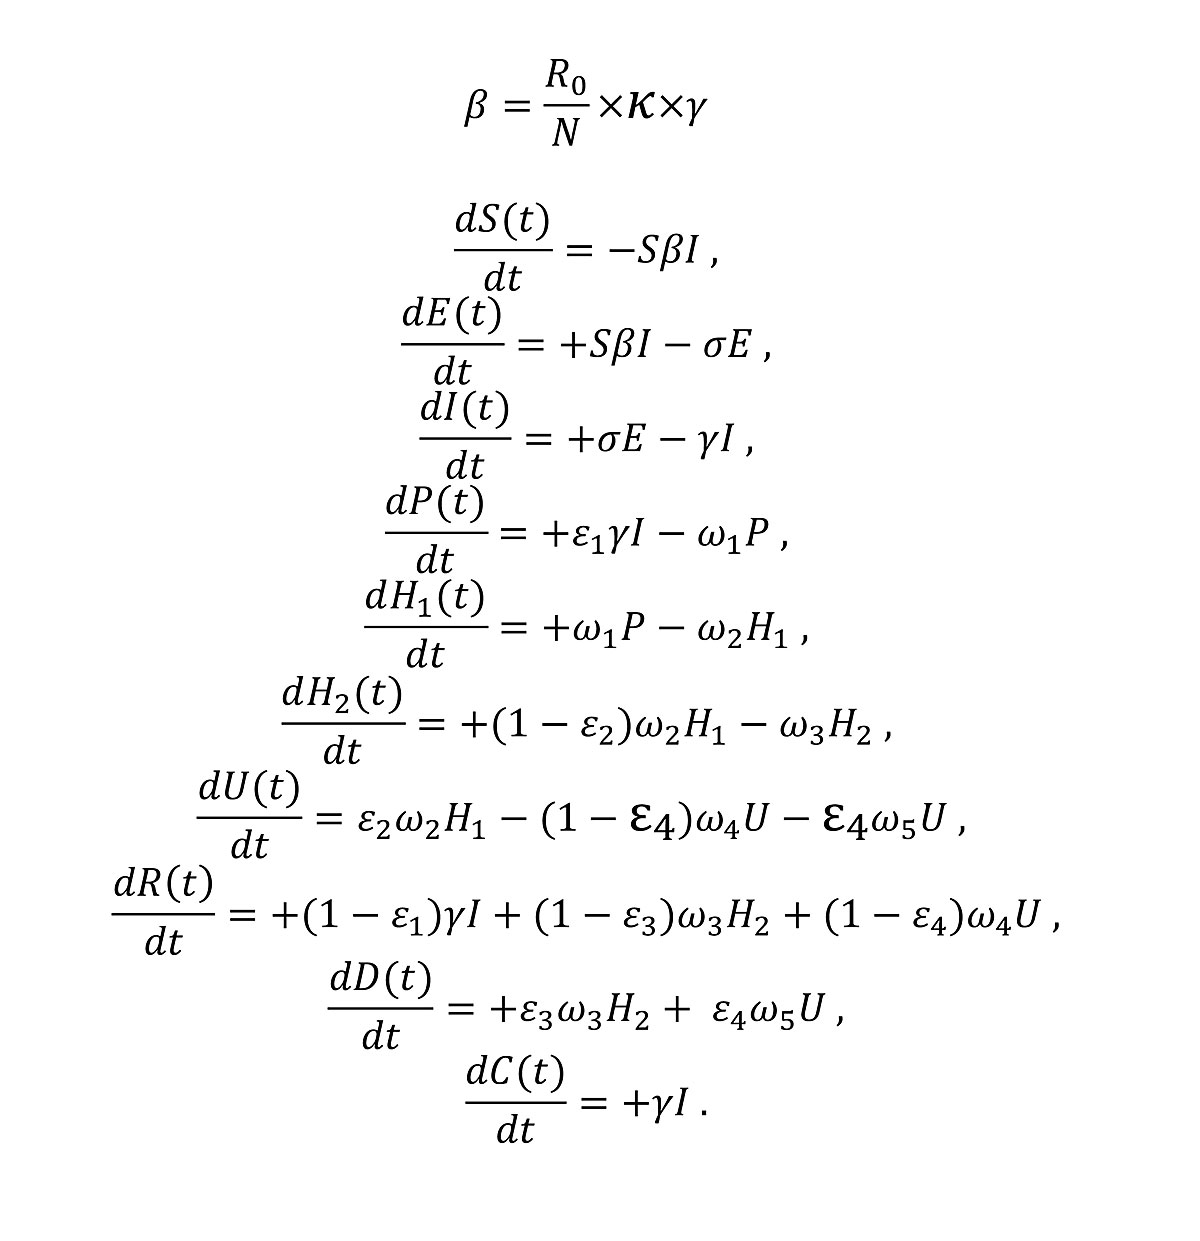
The equations used in the CZ model are listed below (fig. 2), with the descriptions and values of the notations in table 1, and the descriptions of compartments listed in table 2:
Table 1 Parameters, descriptions and values in CZ model.
|
Parameters
|
Description
|
Value
|
|
|
Basic reproduction number |
Fitted |
|
|
Percentage of R
0 after lockdown |
Fitted |
|
|
Serial interval |
1/2.6 days [18] |
|
|
Duration from onset of symptoms to hospitalisation |
1/5 days [19] |
|
|
Initial hospitalisation |
1/6 days [19] |
|
|
Additional days of hospitalisation until recovery/death |
1/10 days [19] |
|
|
Additional days in ICU until recovery |
1/11.2 days*
|
|
|
Additional days in ICU until death |
1/10.5 days*
|
|
|
Rate of hospital admission of infected |
3.5%4,5 [20, 21] |
|
|
Hospitalised cases requiring critical care in ICU |
30% [19] |
|
|
Death outside of ICU |
35%6 [8] |
|
|
Death rate in ICU |
23%*
|
Table 2 Variables in model CZ and model BT (epidemic compartments).
|
Variable (model CZ)
|
Variable (BT model)
|
Description
|
| S |
S |
Susceptible |
| E |
E |
Exposed |
| I |
I |
Infected |
| H |
H1 + H2
|
Hospitalised patients |
| – |
H1
|
Initial hospitalisation until transfer to ICU |
| – |
H2
|
Additional hospitalisation until recovery/death |
| U |
U |
ICU patients |
| D |
D |
Deaths |
| R |
R |
Recovered |
| C |
C |
Cumulative number of infected |
| ‒ |
P |
Infected but not yet hospitalised |
BT model
The second model used was an extended SEIR model, which additionally includes the hospitalised and ICU patients. In the BT model, people who are infected by the virus are assumed to develop symptoms in 2 to 3 days, but may be infectious in the community for another 2 to 3 days, adding up to a generation time of between 4 and 6 days [22]. Between 1% and 15% of people who become sick are hospitalised,, where they are isolated and thus were considered as non-infectious to the community. People who were admitted to hospital were assumed to stay in the ward for 6–18 days, with an additional 2–11 days if they needed to stay in the ICU, which is the case for 30–80% of hospitalised patients. The death rate in the ICU was assumed to be between 30% and 80%. The effect of the lockdown was assumed to vary between 60% and 80%. We assumed a combined probability of positive diagnosis and detection for the infected patients to make use of the reported case data, and this probability varied between 0.05 and 0.35 (5‒35% of the total infected). Four different time series (number of daily deaths, number of daily reported cases, number of people in a hospital ward and number of people in an ICU, obtained from OpenZH [1]) were used simultaneously for the model fitting for each canton separately. We used Hamiltonian Markov Chain Monte Carlo (MCMC) for model inference, as implemented in RStan [23]. A hundred chains with random initial parameter vectors were used with 10,000 jumps in total. The first 5000 jumps were considered for the “burn in period”, we used Geweke statistics on each chain to assess convergence, and chains were thinned with a sampling rate of 100 samples. As for the CZ model, the change in contact patterns resulting from the lockdown measures (16 March 2020) and their subsequent release (27 April 2020) were accounted for through a parameter reducing infection rates rlock. This parameter varied across cantons from 0.57 (Schwyz) to 0.76 (Basel-Landschaft) during the lockdown period (17 March to 27 April 2020)
To calculate the time series output of the fitting, we included the mean values of the posterior distributions of 50% of the chains with the best likelihood output among the ones that had converged. Chains that had not converged were omitted and not used in the analysis. Owing to the high dimensionality of the parameter space, we used a mixed sampling approach. First, we determined the likelihood of each chain among the chains that had converged. Second, we sampled from the posterior distributions of these chains proportional to the mean likelihood value they had converged to. Confidence intervals of the results were calculated for each time point over the population outputs. By allowing model parameters to vary in between these ranges, we had more freedom to fit our model to the number of daily deaths, number of people in a hospital ward and the number of ICU patients simultaneously, in a canton-specific manner. This is especially important because of the differences in the treatment and ICU transfer policies of different cantons and hospitals. As an example, restricting the ICU length of stay to a value that is necessarily smaller or larger than the length of hospital ward stay might not apply for all cantons in question. For both models, the number of hospitalisations on 03 May 2020 was estimated by back-casting from the model’s output.
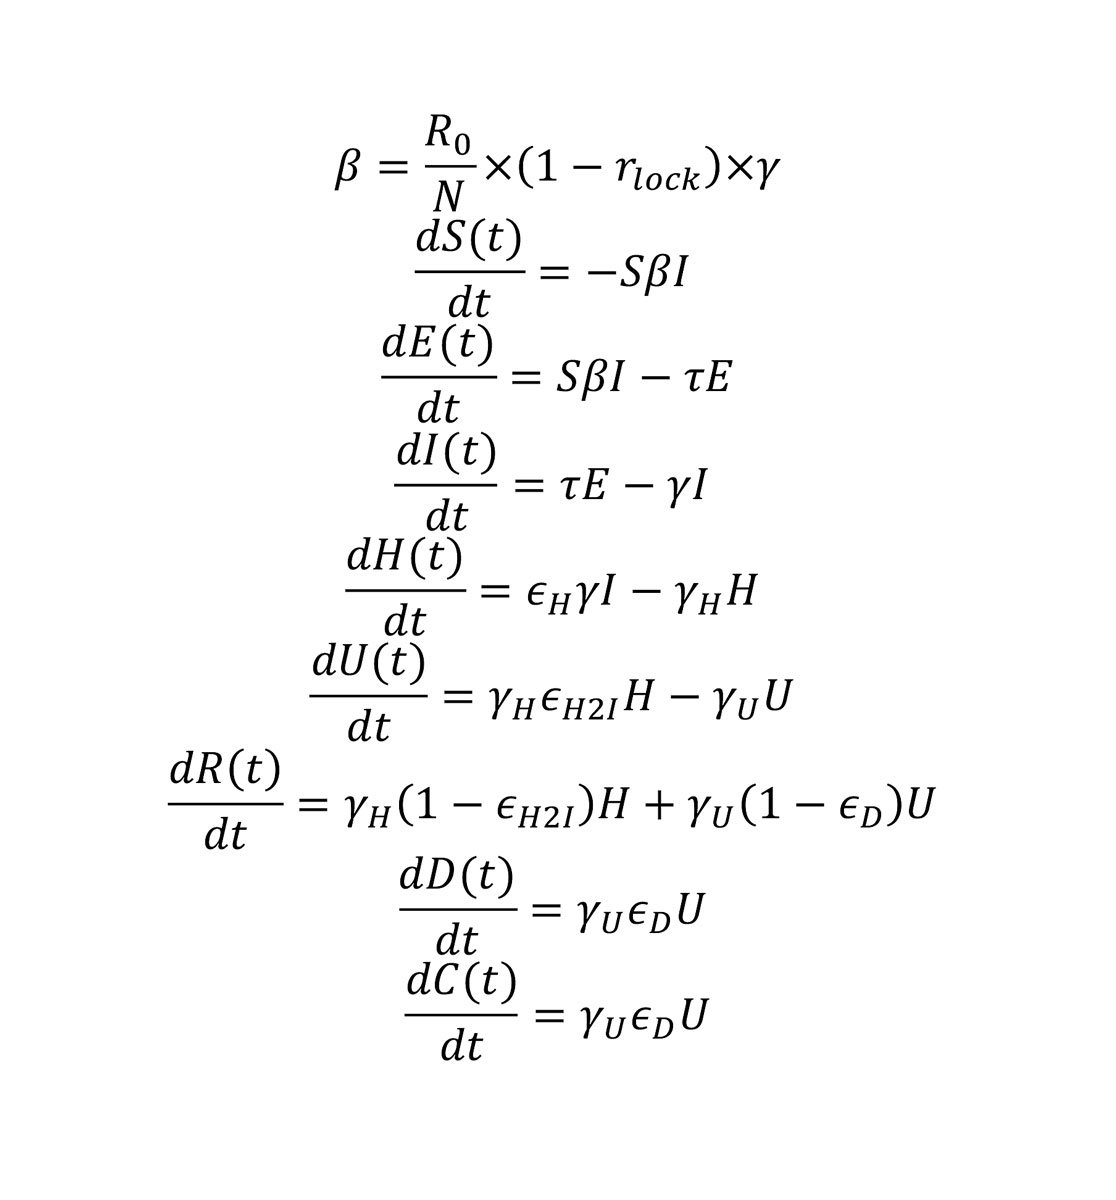
The equations used in the BT model are listed below (fig. 3), with the descriptions and values of the notations in table 3 and the descriptions of compartments listed in table 2:
Table 3 Parameters, descriptions and values in the BT model. All parameters were fitted except N.
|
Parameters
|
Description
|
Value
|
|
|
Basic reproduction number |
2‒3 |
|
|
Time-dependent reduction in infectiousness |
60‒80% |
|
|
Incubation period |
1/2‒3 days |
|
|
Duration of infection of I |
1/2‒3 days |
|
|
Duration of hospital ward stay |
1/6‒18 days |
|
|
Duration of ICU stay |
1/2‒11 days |
|
|
Rate of direct hospital ward admission of infected |
1‒15% |
|
|
Transfer rate from hospital ward to ICU |
30‒80% |
|
|
Death rate in ICU |
30‒80% |
|
|
Diagnosis rate |
5‒35% |
| N |
Population size by canton |
Fixed |
Uncertainty and forecasting capacities.
For the CZ model, we simulated 10,000 R0 and kappa values, from a multivariate normal distribution with mean values equal to the fitted values of R0 and kappa, and a covariance matrix estimated from the maximum likelihood estimation. The confidence interval (CI) for predictions in each canton was estimated, with the 2.5% and 97.5% quantiles of the 10,000 predictions. The mean values of the cantonal predictions in the CZ model were adjusted by multiplying by an adjustment ratio, such that they sum up to the model predictions at the national level. The upper and lower bounds of CIs for each canton were adjusted, by multiplying by the same adjustment ratio that was applied to the mean values of model predictions in each canton. For the BT model, similarly, CIs were calculated using the converged MCMC parameter estimates (posteriors) and extracting the 2.5% and 97.5% quantiles of the predictions generated with these parameters values.
CIs at the hospital-level were estimated from the canton-level 95% CI in a two-step procedure. First, we calculated the percentage of deviation between the upper and lower bounds of the 95% CI and the mean number of cases, hospitalisations, ICU hospitalisations and deaths. Second, these percentages of deviation were applied to the estimates of the same outputs downscaled at the hospital level based on population density and travel times (next section). For example, a hospital where 10 ICU beds were projected to be occupied and that is located in a canton where the total number of ICU beds was 100 (95% CI 90‒120) would have a 95% CI of between 9 and 12 beds.
The ability of our epidemic models to make temporal projections 4 days ahead – the update frequency of icumonitoring.ch – was evaluated at the cantonal level by comparing projections and observations for the number of deaths and COVID-19 patients in ICU on 03 April 2020 using a model calibrated on 29 May 2020. The metrics used to evaluate the accuracy of projections of the number of deaths and the number of ICU cases were the Spearman correlation coefficient between projections and observations, as well as the average percentage deviation between projections and observation across cantons.
Geographic downscaling of epidemic projections for hospitals
For each hospital, we estimated the bed occupancy on 06 May 2020 as the sum of: (i) the number of beds in use by non-COVID-19 patients, which was assumed to be stable since 29 April 2020, (ii) the number of ICU beds in use by COVID-19 patients who were admitted before 03 May 2020 and remained in the ICU as of 06 May 2020, and (iii) the number of new COVID-19 patients who required a bed in an ICU between 03 April 2020 and 06 May 2020. For (ii), we assumed an exponential survival function with a discharge rate equal to: α × LOSdeaths + (1−α) × LOSrecovered, where α is the mortality rate of COVID-19 patients in ICU (0.23), LOSdeaths is the length of stay for deceased COVID-19 patients (10.5 days), and LOSrecovered is the length of stay of patients who recovered (11.2 days). For (iii), we spatially disaggregated the total number of ICU cases projected by canton (see “Epidemic forecasting” above) minus (ii). Each future COVID-19 patient requiring care in an ICU (iii) was assigned a latitude and longitude in each canton via stratified random sampling inside the corresponding canton. The weighting factor for the stratification was population density. Each case was assigned to the “nearest” hospital, measured in travel time (minutes). We used a friction surface [24] to estimate travel times to hospitals. Based on each location, each case was assigned to a nearby hospital using a gravity model. The probability of having attended a hospital from any given pixel was given by: log10(ICU beds)/(travel timepixel->H), for hospital ‘H’. Each patient was assigned to the hospital with the highest probability of attendance. This process was repeated 10 times through Monte Carlo simulations. The hospital that was selected with the highest frequency across the 10 simulations was designated as the hospital probably attended by a patient in the future. The number of patients on ventilators on 03 May 2020 was estimated by applying the current rate of ventilation of COVID-19 patients in an ICU (76%) to the future number of COVID-19 patients admitted to an ICU.
Online platform
All epidemic model outputs at the cantonal- (fig. 4) and hospital-level (fig. 5) are uploaded to an online platform icumonitoring.ch twice per week on Sunday and Thursday evening. The platform is a ‘Shiny’ [25] interactive application developed in the open-access R programming language [26] inside the RStudio Environment. In addition, we used JavaScript actions and CSS code to adjust aesthetic features of the platform into a dashboard. In its current version, icumonitoring.ch relies on the following dependencies: aws.s3 (0.3.21), grDevices (3.6.3), htmlwidgets (1.5.1), leaflet (2.0.3), RColorBrewer (1.1-2), readr (1.3.1), rgdal (1.4-4), shiny (1.4.0.2), shinydashboard (0.7.1), shinyjs (1.1), and tidyverse (1.3.0). icumonitoring.ch is hosted on a password-protected shinyapps.io server. The databases and model outputs displayed on the platform are stored on an encrypted storage service of ETH Zurich (polybox).
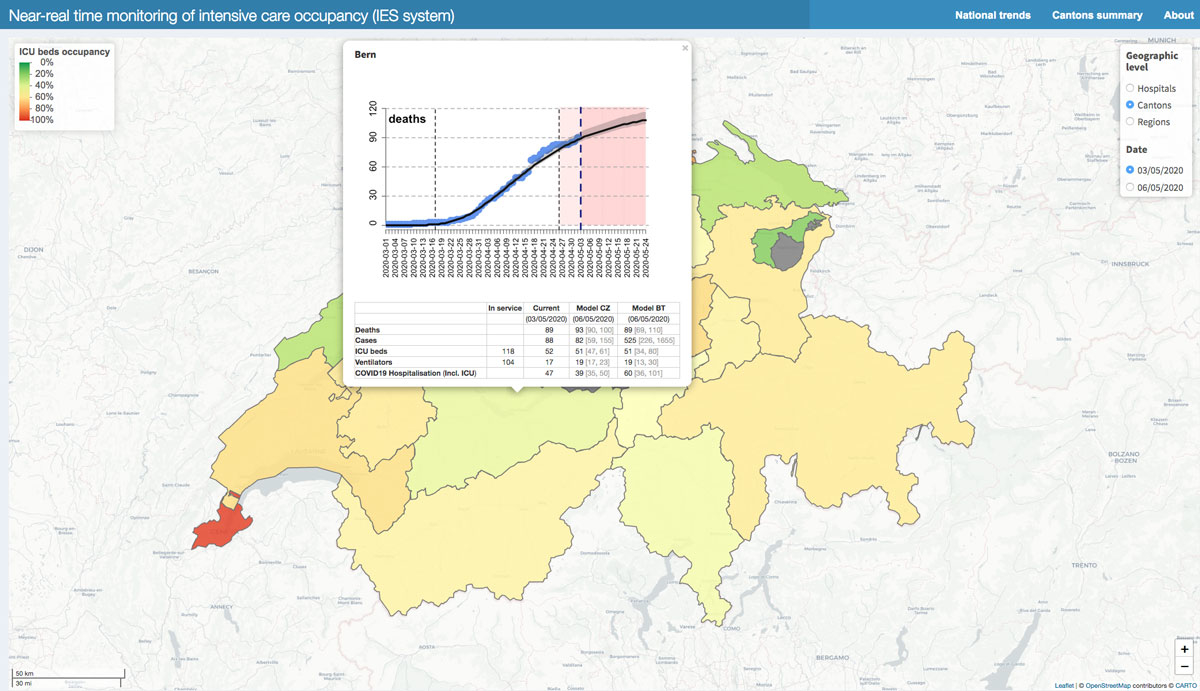
Figure 4 Canton-level ICU occupancy, colours in other Cantons indicate ICU bed occupancy compared with the number of beds in service. Pop-up windows indicate the situation in the Canton of Bern as reported in icumonitoring.ch for 03 May 2020 and projected for 06 May 2020.
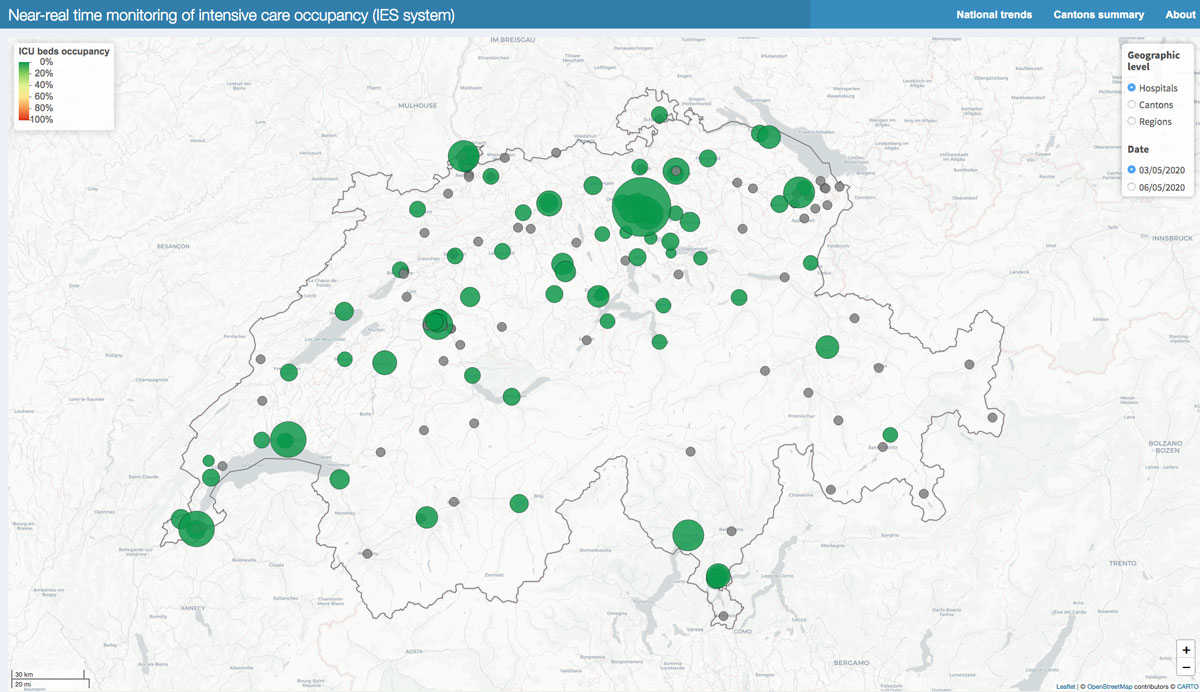
Figure 5 Hospitals with ICU (yellow), and without ICU (grey): bed occupancy in individual hospitals set to 0 artificially but available upon request to the corresponding author (bottom).
Results
As of 03 April 2020, the number of patients requiring an ICU bed in Switzerland was 713. This estimate is below the effective ad-hoc ICU bed capacity in Switzerland (1275). The number of patients requiring ICU beds (for COVID-19 and non-COVID-19 causes) is decreasing and unlikely to exceed the effective capacity in the next week. By 06 May 2020, we project that the need for ICU beds could range between 739 (95% CI 669‒871) (model CZ) and 761 (95% CI 541‒1164) (model BT). As of 03 May 2020, 367 patients were ventilated in an ICU out of 1064 ventilators available. Assuming a ventilation rate of 76% for ICU COVID-19 patients, as reported on 03 May 2020, the number of ventilators required by 06 May 2020 could be 398 (95% CI 365‒466) (CZ model) or 416 (95% CI 295‒658) (BT model).
For the number of COVID-19 ICU cases, on 03 May 2020, the correlation between projections (4 days ahead) and observations by canton was 0.62, and 0.86 for the CZ and BT models, respectively. The percentage deviation between projection and observation for the number COVID-19 ICU cases was ‒16.7% for the CZ and ‒14.4% for the BT model. For the number of deaths, on 03 May 2020, the correlation between projections (4 days ahead) and observations by canton was 0.99 for the CZ and the BT models. The percentage deviation between projection and observation for the number of deaths was +2.14% for the CZ model and −0.4% for the BT model.
Icumonitoring.ch disaggregates these findings by canton and by hospital. It is an interactive web application that displays ICU occupancy. Each geographic element (i.e., hospitals or cantons) can be interrogated via a pop-up window. The pop-up window shows the number of deaths attributed to COVID-19; the number of estimated COVID-19 infections (cases); the number of ventilators available and used; the number of COVID-19 patients in ICU and beds available; the total number of COVID-19 patients hospitalised (including ICU). Projections for these quantities are available 3–4 days in advance (06 May 2020), and re-calibrated every 3–4 days based on epidemic data (fig. 6). At the cantonal level, the pop-up window also provides a visual of the epidemic model fit to the time series of deaths in each Canton. The data presented in this article are aggregated at the canton level, but access to hospital-level information is available to healthcare workers upon request to the communicating author. icumonitoring.ch also provides a comparative summary of current and future bed occupancy, ventilator occupancy and hospitalisations in each canton.
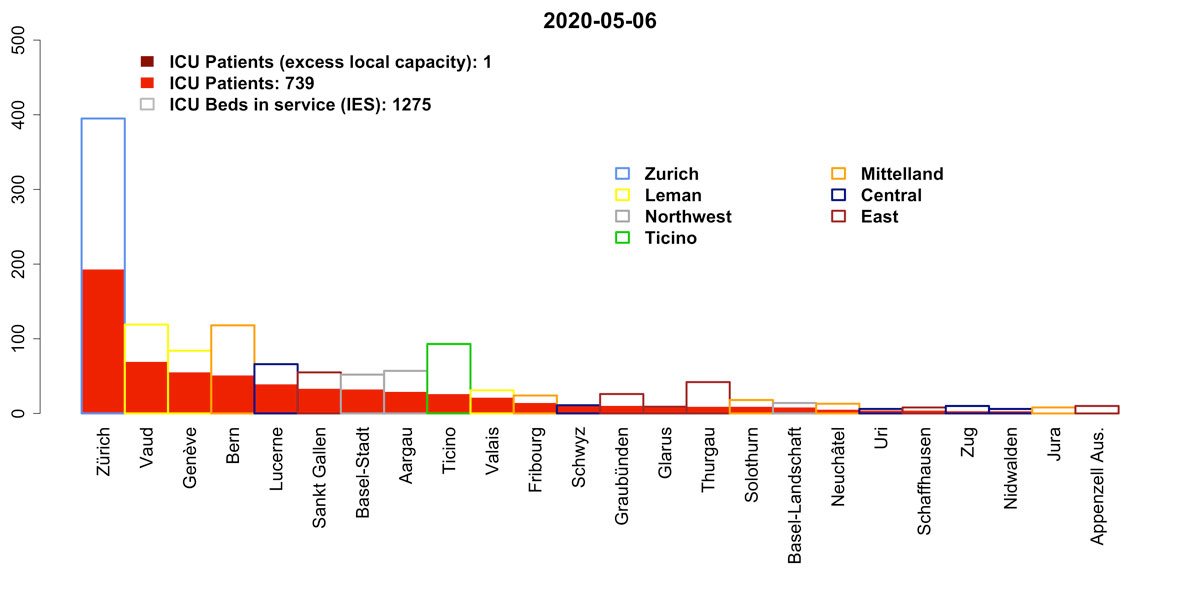
Figure 6 Projection for ICU bed occupancy on 06 May 2020 ranked by region and canton (model CZ).
On 06 May 2020, the number of hospitalisations, and ICU hospitalisations for COVID-19 was projected to grow in 5 cantons and decline in 21 cantons, as compared with 03 May 2020 (table 4). On 03 May 2020, the number of ICU hospitalisations was projected to grow in 7 cantons and decline in 19 Cantons, as compared with 03 May2020. On 03 May 2020 the number of ventilators needed was projected to grow in 6 cantons and decline in 20 Cantons, as compared with 03 May 2020.
Table 4 Observed and projected numbers for hospitalisations, ICU bed usage and ventilator use, by canton.
|
Canton
|
COVID-19 hospitalisations 03 May 2020
|
COVID-19 hospitalisations 06 May 2020
|
ICU beds in service 03 May 2020
|
ICU beds in use 03 May 2020
|
ICU beds projected 06 May 2020
|
Ventilators in services 03 May 2020
|
Ventilators in use 03 May 2020
|
Ventilators projected 06 May 2020
|
| AG |
39 |
36 |
57 |
28 |
29 |
56 |
15 |
16 |
| AI |
0 |
0 |
0 |
0 |
0 |
0 |
0 |
0 |
| AR |
2 |
0 |
10 |
2 |
0 |
6 |
2 |
1 |
| BE |
47 |
39 |
118 |
52 |
51 |
104 |
17 |
19 |
| BL |
5 |
5 |
14 |
7 |
8 |
6 |
1 |
2 |
| BS |
13 |
9 |
52 |
34 |
32 |
28 |
12 |
10 |
| FR |
12 |
10 |
24 |
14 |
14 |
24 |
8 |
7 |
| GE |
62 |
28 |
84 |
80 |
55 |
82 |
33 |
21 |
| GL |
31 |
35 |
9 |
5 |
10 |
4 |
2 |
5 |
| GR |
9 |
3 |
26 |
15 |
10 |
23 |
9 |
4 |
| JU |
7 |
3 |
8 |
5 |
1 |
8 |
3 |
1 |
| LU |
14 |
3 |
66 |
49 |
39 |
55 |
19 |
13 |
| NE |
9 |
8 |
13 |
4 |
5 |
13 |
3 |
3 |
| NW |
1 |
1 |
6 |
3 |
3 |
6 |
0 |
0 |
| OW |
1 |
1 |
0 |
0 |
0 |
0 |
0 |
0 |
| SG |
11 |
10 |
55 |
32 |
33 |
49 |
9 |
9 |
| SH |
3 |
1 |
8 |
6 |
4 |
5 |
4 |
2 |
| SO |
14 |
11 |
18 |
11 |
9 |
14 |
7 |
4 |
| SZ |
14 |
15 |
11 |
7 |
10 |
6 |
1 |
3 |
| TG |
15 |
10 |
42 |
13 |
9 |
42 |
7 |
4 |
| TI |
57 |
30 |
93 |
44 |
26 |
90 |
28 |
9 |
| UR |
3 |
4 |
6 |
3 |
4 |
2 |
0 |
1 |
| VD |
74 |
53 |
119 |
74 |
69 |
112 |
34 |
31 |
| VS |
33 |
30 |
31 |
17 |
21 |
31 |
13 |
15 |
| ZG |
3 |
3 |
10 |
3 |
3 |
8 |
1 |
1 |
| ZH |
35 |
18 |
395 |
205 |
193 |
290 |
139 |
131 |
Discussion
Icumonitoring.ch is a tool to support decision makers in anticipating ICU occupancy during the COVID-19 outbreak. Ultimately, its goal is to prevent hospital overflow [27, 28], such as in Italy or Spain, by projecting when capacities may need to be expanded or the transfer of patients has to be considered, such as in France [29]. Conversely, this tool can also be used to progressively reduce costly expansion of nominal hospital capacities [30] and requests for additional medical staff [31].
The accuracy of the projections available in icumoniroting.ch relies on epidemic models, but also on the completeness of the data reported in the IES system. In normal times, the IES system is seldom maintained, without apparent consequences. However, these are not normal times. While acknowledging that healthcare workers face unprecedented demand in the clinic, we urge them to maintain the IES system up-to-date, so as to help us in helping them. This may require additional personnel/training. The “epidemiology community” would welcome a display of leadership from the competent authorities in empowering hospital managers with the appropriate resources to maintain the IES. What cannot be measured cannot be managed, let alone projected in the future.
As with any modelling study, the projection presented in icumonitoring.ch comes with a series of limitations. The development of icumonitoring.ch started on 10 April 2020 and remains a “work in progress”. In particular, the following adjustments will be considered in the future. First, the number of non-ICU beds in hospitals reported in the IES system remains inaccurate (personal communication) and is therefore not displayed on the platform at this stage. Second, the two epidemic models used for projection do not yet account for the age structure of the population. Given the strong dependency of the case-fatality rate of COVID-19 on age [32], this would need to be included in a future iteration of our models. Third, the epidemic model used here show deviations between projection (4 days ahead) and observations for a given day. For the projections of the number of death – on which both models are fitted – these deviations are minimal (~2%). However, for the number COVID-19 cases requiring ICU beds the deviation was ‒16.7% for the CZ model and ‒14.4% for the BT model. The BT model thus slightly outperformed the CZ model. From a hospital management perspective, the underestimation of the number of ICU cases by both models could make our projections seen as a conservative minimum threshold for hospital managers to consider before downscaling the ad-hoc capacities currently in place. The reasons for the underestimate of capacity may be associated with current estimates of the length of stay in ICU. Here we attempted to include the most up-to-date estimates of length of stay (LOS) from the RISC-19-ICU registry to which >30 Swiss ICU units are contributing. However, it should be acknowledge that 31.5% of patients with acute COVID-19 are still currently in ICU and may have longer than average LOS due to the severity of their infections. This may artificially decrease the LOS used in this analysis, which was calculated from patients who have already been discharged or are deceased. Similarly, another potential source of bias for LOS in the ICU is the limitation of therapy due to a patient’s wishes. These decisions do not necessarily correlate with disease severity, but could be motivated by a patient’s previous health status, advance directive or substitute directives. Fourth, the geographic downscaling was based on population density. We thus implicitly hypothesised that a future patient is equally likely to have contracted the disease in cities or in rural settings. This may lead to an underestimation of the clustering of cases in cities, where contact rates may be higher than in the countryside. Fifth, uncertainty in epidemic model lies not only in the ability to infer transmission parameters but also the intrinsic formulation of a model in different epidemic compartments [33]. Here we attempted to address this concern by using two epidemic models with different inference methods and compartmental structures so as to capture the uncertainty inherent to the model structure. The objective of our platform is also to include projections from other modelling groups with a forecast template so as to allow further comparison between models that may have radically different structure, such as agent-based models [9, 34]. The authors would also welcome suggestions from the intensive medicine community for relevant parameters to be added to icumonitoring.ch that can help guide hospital management decisions.
Acknowledgements
We thank the Swiss Armed Forces for initiating the collaboration and facilitating access to data on ICU occupancy. We thank Hans Ulrich Rothen for providing data on length of stay in ICU of patients with ARDS in the preparatory phase of this analysis on behalf of the Swiss Society of Intensive Care Medicine. We thank Dani Angst for providing access to ETH’s Shiny server, as well as Katie Tiseo and Corinne Hertaeg for language editing.
RISC-19-ICU Investigators for Switzerland. Institute of Intensive Care Medicine, University Hospital Zurich, Zurich (Reto Schüpbach, MD; Philipp Bühler, MD; Silvio Brugger, MD, PhD; Jan Bartussek, PhD); Soins intensifs, Groupement Hospitalier de l'Ouest Lémanique - Hopital de Nyon, Nyon (Mallory Moret-Bochatay, MD); Interdisziplinaere Intensivstation, Spital Buelach, Buelach (Bernd Yuen, MD; Thomas Hillermann, MD); Soins Intensifs, Hopital cantonal de Fribourg, Fribourg (Hatem Ksouri, MD, PhD; Govind Oliver Sridharan, MD); Departement for intensive care medicine, Kantonsspital Nidwalden, Stans (Anette Ristic, MD; Michael Sepulcri, MD); Departement of Anesthesiology and Intensive Care Medicine, Cantonal Hospital St. Gallen, St. Gallen (Miodrag Filipovic, MD; Urs Pietsch, MD); Intensivstation, Regionalspital Emmental AG, Burgdorf (Petra Salomon, MD; Iris Drvaric, MD); Institut fuer Anesthaesie und Intensivmedizin, Zuger Kantonsspital AG, Baar (Peter Schott, MD; Severin Urech, MD); Intensivmedizin, St. Claraspital, Basel (Adriana Lambert, MD; Lukas Merki, MD); Department Intensive Care Medicine, Spitalzentrum Biel, Biel (Marcus Laube, MD); Intensivmedizin, Kantonsspital Graubünden, Chur (Frank Hillgaertner, MD; Marianne Sieber); Institut fuer Anaesthesie und Intensivmedizin, Spital Thurgau, Frauenfeld (Alexander Dullenkopf, MD; Lina Petersen, MD); Division of Neonatal and Pediatric Intensive Care, Geneva University Hospitals, Geneva (Serge Grazioli, MD; Peter C. Rimensberger, MD); Soins Intensifs, Hirslanden Clinique Cecil, Lausanne (Isabelle Fleisch, MD; Jerome Lavanchy, MD); Interdisziplinaere Intensivstation, Spital Maennedorf AG, Maennedorf (Katharina Marquardt, MD; Karim Shaikh, MD); Intensivmedizin, Schweizer Paraplegikerzentrum Nottwil, Nottwil (Hermann Redecker, MD); Intensivmedizin, Spital Oberengadin, Samedan (Michael Stephan, MD; Jan Brem, MD); Paediatric Intensive Care Unit, Children’s Hospital of Eastern Switzerland, St. Gallen (Bjarte Rogdo, MD; Andre Birkenmaier, MD); Klinik für Anaesthesie und Intensivmedizin, Spitalzentrum Oberwallis, Visp (Friederike Meyer zu Bentrup, MD, MBA); Interdisziplinaere Intensivstation, Stadtspital Triemli, Zurich (Patricia Fodor, MD; Pascal Locher, MD); Department Intensivmedizin, Universitaetsspital Basel, Basel (Martin Siegemund, MD; Nuria Zellweger); Department of Intensive Care Medicine, University Hospital Bern - Inselspital, Bern (Marie-Madlen Jeitziner, RN, PhD; Beatrice Jenni-Moser, RN, MSc); Intensivstation, Spital Grabs, Grabs (Christian Bürkle, MD); Medical ICU, Cantonal Hospital St.Gallen, St. Gallen (Gian-Reto Kleger, MD); Service d'Anesthesiologie, EHNV, Yverdon- les-Bains (Marilene Franchitti Laurent, MD; Jean-Christophe Laurent, MD); Abteilung für Anaesthesiologie und Intensivmedizin, Hirslanden Klinik Im Park, Zürich (Tomislav Gaspert, MD; Marija Jovic, MD); Intensivmedizin & Intermediate Care, Kantonsspital Olten, Olten (Michael Studhalter, MD); Institut für Anaesthesiologie und Intensivmedizin, Klinik Hirslanden, Zurich (Christoph Haberthuer, MD; Roger F. Lussman, MD); Anaesthesie Intensivmedizin Schmerzmedizin, Spital Schwyz, Schwyz (Daniela Selz, MD; Didier Naon, MD); Dipartimento Area Critica, Clinica Luganese Moncucco, Lugano (Romano Mauri, MD; Samuele Ceruti, MD); Institut für Anaesthesiologie Intensivmedizin & Rettungsmedizin, See-Spital Horgen & Kilchberg, Horgen (Julien Marrel, MD; Mirko Brenni, MD); Klinik für Operative Intensivmedizin, Kantonsspital Aarau, Aarau (Rolf Ensner, MD); Intensivstation, Kantonsspital Schaffhausen, Schaffhausen (Nadine Gehring, MD); Intensivstation, Spital Simmental-Thun-Saanenland AG, Thun (Antje Heise, MD), Division of Intensive Care, University Hospitals of Geneva, Geneva (Sara Cereghetti, MD; Filippo Boroli, MD; Jerome Pugin, MD, PhD).
*
These authors contributed equally.
Author contributions
Thomas Van Boeckel conceived the work, cleaned and analysed the data on ICU occupancy, and wrote the first version of the manuscript. Ms Cheng Zhao, and Dr Burcu Tepekule produced epidemic projections. Mr Nicola Criscuolo developed the Shiny web application. Pedro Wendel Garcia, and Matthias Hilty facilitated access to and pre-treated data from the RISC-19-ICU registry. Thierry Fumeaux, facilitated access to data from SSIM, and informed the model development. All authors critically revised and edited the manuscript.
References
1openZH/covid_19 [Internet]. Specialist Unit for Open Government Data Canton of Zurich; 2020 [cited 2020 Apr 18]. Available from: https://github.com/openZH/covid_19
2Federal Council to gradually ease measures against the new coronavirus [Internet]. [cited 2020 Apr 18]. Available from: https://www.admin.ch/gov/en/start/documentation/media-releases/media-releases-federal-council.msg-id-78818.html
3Streeck H, Hartmann G, Exner M, Schmid M. Vorläufiges Ergebnis und Schlussfolgerungen der COVID-19 Case-Cluster-Study (Gemeinde Gangelt). University of Bonn. Available from: https://www.land.nrw/sites/default/files/asset/document/zwischenergebnis_covid19_case_study_gangelt_0.pdf
4COVID-19 Antibody Seroprevalence in Santa Clara County. California | medRxiv [Internet]. [cited 2020 Apr 18]. Available from: https://www.medrxiv.org/content/10.1101/2020.04.14.20062463v1
5Entwicklung des Mobilitätsverhaltens während der COVID-19-Krise [Internet]. [cited 2020 Apr 18]. Available from: https://statistik.zh.ch/internet/justiz_inneres/statistik/de/aktuell/mitteilungen/2020/covid_mobilitaetsverhalten.html
6Monitoring COVID-19 spread in Switzerland [Internet]. [cited 2020 Apr 18]. Available from: https://bsse.ethz.ch/cevo/research/sars-cov-2/real-time-monitoring-in-switzerland.html
7Lemaitre J, Perez-Saez J, Azman A, Rinaldo A, Fellay J. Switzerland COVID-19 Scenario Report. École Polytechnique Fédérale de Lausanne; 2020.
8Real-time modeling and projections of the COVID-19 epidemic in Switzerland [Internet]. [cited 2020 Apr 18]. Available from: https://ispmbern.github.io/covid-19/swiss-epidemic-model/
9COVID-19 Epidemic in Switzerland: Growth Prediction and Containment Strategy Using Artificial Intelligence and Big Data | medRxiv [Internet]. [cited 2020 Apr 18]. Available from: https://www.medrxiv.org/content/10.1101/2020.03.30.20047472v2
10Suisse romande: Les soins intensifs ne manquent pas de lits ‒ News Suisse: Suisse romande ‒ 24heures.ch [Internet]. [cited 2020 Apr 18]. Available from: https://www.24heures.ch/suisse/suisse-romande/soins-intensifs-manquent-lits/story/20067350
11Pelda K. L’armée mène une opération secrète pour importer des masques par millions. TDG [Internet]. 2020 Apr 15 [cited 2020 Apr 18]; Available from: https://www.tdg.ch/suisse/armee-mene-operation-secrete-importer-masques-millions/story/12405340
12Coronavirus: la Suisse mobilise l’armée. Le Temps [Internet]. 2020 Mar 16 [cited 2020 Apr 18]; Available from: https://www.letemps.ch/suisse/coronavirus-suisse-mobilise-larmee
13
Houben
RM
,
Van Boeckel
TP
,
Mwinuka
V
,
Mzumara
P
,
Branson
K
,
Linard
C
, et al.
Monitoring the impact of decentralised chronic care services on patient travel time in rural Africa--methods and results in Northern Malawi. Int J Health Geogr. 2012;11(1):49. doi:.https://doi.org/10.1186/1476-072X-11-49
14
Macharia
PM
,
Odera
PA
,
Snow
RW
,
Noor
AM
. Spatial models for the rational allocation of routinely distributed bed nets to public health facilities in Western Kenya. Malar J. 2017;16(1):367. doi:.https://doi.org/10.1186/s12936-017-2009-3
15
Myers
BA
,
Fisher
RP
,
Nelson
N
,
Belton
S
. Defining Remoteness from Health Care: Integrated Research on Accessing Emergency Maternal Care in Indonesia. AIMS Public Health. 2015;2(3):257–73. doi:.https://doi.org/10.3934/publichealth.2015.3.256
16Coronavirus: Federal Council declares ‘extraordinary situation’ and introduces more stringent measures [Internet]. [cited 2020 Apr 18]. Available from: https://www.admin.ch/gov/en/start/documentation/media-releases.msg-id-78454.html
17FOPH FO of PH. New coronavirus: Measures, ordinance and explanations [Internet]. [cited 2020 Apr 30]. Available from: https://www.bag.admin.ch/bag/en/home/krankheiten/ausbrueche-epidemien-pandemien/aktuelle-ausbrueche-epidemien/novel-cov/massnahmen-des-bundes.html
18Estimating the generation interval for COVID-19 based on symptom onset data | medRxiv [Internet]. [cited 2020 Apr 29]. Available from: https://www.medrxiv.org/content/10.1101/2020.03.05.20031815v1
19Report 9 ‒ Impact of non-pharmaceutical interventions (NPIs) to reduce COVID-19 mortality and healthcare demand [Internet]. Imperial College London. [cited 2020 Apr 29]. Available from: http://www.imperial.ac.uk/medicine/departments/school-public-health/infectious-disease-epidemiology/mrc-global-infectious-disease-analysis/covid-19/report-9-impact-of-npis-on-covid-19/
20Estimates of the severity of coronavirus disease 2019: a model-based analysis ‒ The Lancet Infectious Diseases [Internet]. [cited 2020 Apr 29]. Available from: https://www.thelancet.com/journals/laninf/article/PIIS1473-3099(20)30243-7/fulltext
21Estimating clinical severity of COVID-19 from the transmission dynamics in Wuhan, China | Nature Medicine [Internet]. [cited 2020 Apr 29]. Available from: https://www.nature.com/articles/s41591-020-0822-7
22Ganyani T, Kremer C, Chen D, Torneri A, Faes C, Wallinga J, et al. Estimating the generation interval for COVID-19 based on symptom onset data. medRxiv. 2020 Mar 8;2020.03.05.20031815.
23R Interface to Stan [Internet]. [cited 2020 May 3]. Available from: https://mc-stan.org/rstan/
24
Weiss
DJ
,
Nelson
A
,
Gibson
HS
,
Temperley
W
,
Peedell
S
,
Lieber
A
, et al.
A global map of travel time to cities to assess inequalities in accessibility in 2015. Nature. 2018;553(7688):333–6. doi:.https://doi.org/10.1038/nature25181
25Shiny [Internet]. [cited 2020 Apr 18]. Available from: https://shiny.rstudio.com/
26R: The R Project for Statistical Computing [Internet]. [cited 2020 Apr 20]. Available from: https://www.r-project.org/
27Wynne A. Horrifying images show coronavirus patients in Madrid hospital [Internet]. Mail Online. 2020 [cited 2020 Apr 19]. Available from: https://www.dailymail.co.uk/news/article-8142013/Horrifying-images-coronavirus-patients-lying-floor-packed-Madrid-hospital.html
28Hume T. Coronavirus Has Northern Italy’s Hospitals on the Brink of Collapse [Internet]. Vice. 2020 [cited 2020 Apr 19]. Available from: https://www.vice.com/en_us/article/k7ex4a/coronavirus-has-northern-italys-hospitals-on-the-brink-of-collapse
29Keohane D. France’s TGV speeds Covid-19 patients to spare hospital beds [Internet]. 2020 [cited 2020 Apr 19]. Available from: https://www.ft.com/content/619bd7b0-7424-11ea-95fe-fcd274e920ca
30Coût de mesures d’urgence estimé à 35 milliards. TDG [Internet]. 2020 Jul 4 [cited 2020 Apr 19]; Available from: https://www.tdg.ch/economie/cout-mesures-urgence-estime-35-milliards/story/13977524
31Service d’appui : licenciement partiel du personnel sanitaire assorti de contraintes de disponibilité [Internet]. Swiss Armed Forces; 2020. Available from: https://www.vtg.admin.ch/fr/actualite/coronavirus.detail.news.html/vtg-internet/verwaltung/2020/20-04/20-04-17-arbeitgeberbrief_nr2.html
32Adjusted age-specific case fatality ratio during the COVID-19 epidemic in Hubei, China, January and February 2020 | medRxiv [Internet]. [cited 2020 Mar 21]. Available from: https://www.medrxiv.org/content/10.1101/2020.03.04.20031104v1
33
Foss
AM
,
Vickerman
PT
,
Chalabi
Z
,
Mayaud
P
,
Alary
M
,
Watts
CH
. Dynamic modeling of herpes simplex virus type-2 (HSV-2) transmission: issues in structural uncertainty. Bull Math Biol. 2009;71(3):720–49. doi:.https://doi.org/10.1007/s11538-008-9379-1
34Müller SA, Balmer M, Neumann A, Nagel K. Mobility traces and spreading of COVID-19. 2020 Mar 20 [cited 2020 Apr 30]; Available from: https://depositonce.tu-berlin.de/handle/11303/10945