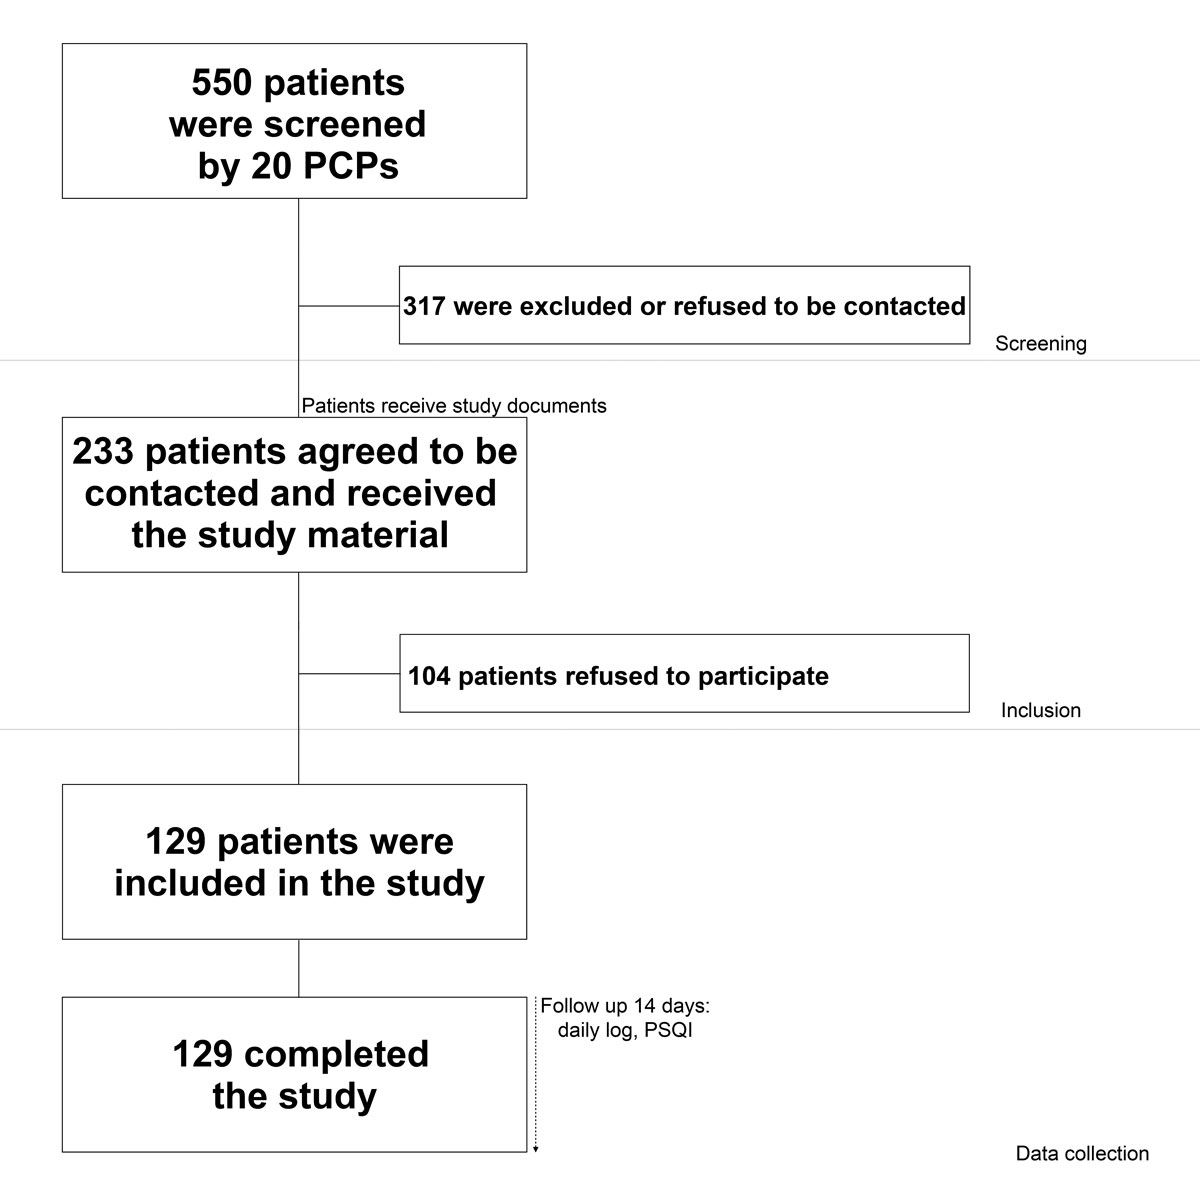
Figure 1 Study recruitment and follow-up.
DOI: https://doi.org/10.4414/smw.2020.20217
Nocturnal leg cramps (NLCs) are characterised by sudden and painful involuntary contractions of the lower limbs occurring during sleep or at rest [1–3]. Their pathophysiology remains poorly understood [3–5]. They are particularly common among older adults; nearly half of patients aged 60 years and over suffer from NLCs [6–9].
Little research has been carried out to assess the impact of NLCs on sleep quality [4, 10]. In a cross sectional study, Hawke and colleagues showed that NLCs were associated with impaired quality of life, and that this association was mediated through sleep disturbances [10]. In another observational study, Grandner and colleagues showed that moderate to severe NLCs were associated with a low quality of sleep and daytime sleepiness [4]. In addition, several authors showed that NLC-associated sleep disturbances could lead to physical and/or psychological disorders [11, 12].
There are currently no brief and valid questionnaires specifically designed to assess the level of sleep disturbance in patients with NLCs. The Pittsburgh Sleep Quality Index (PSQI) is a widely used, auto-administered, multiple item instrument developed to measure retrospective sleep quality and disturbance in clinical practice and research [13, 14]. The PSQI has been used and validated in a variety of populations [14]. Unfortunately, this instrument consists of 19 items and therefore takes a relatively long time to complete (approximately 10 minutes) [14]. Recruitment and participation are well-known issues in primary care research [15, 16]. In this context, the timeliness of completing questionnaires is a critical issue, and instruments such as the PSQI can be a challenge for patients and primary care physicians involved in research. In addition, the PSQI is validated only for retrospective data collection. The occurrence of NLCs is uncertain and most patients can live for long periods of time without cramps.
We therefore hypothesised that the use of a simple instrument in the form of a single question about sleep disturbance (“What was the level of sleep disturbance you experienced the previous night?”) could be an appropriate additional means of assessing sleep disorders related to NLCs.
The aims of this study were (i) to determine whether NLCs were associated with poor sleep quality in a sample of patients visiting primary care physicians (PCPs) and (ii) to assess the criterion validity of the single-item measure, comparing the score (averaged over the 2-week study period) with the PSQI score (chosen as the reference standard for the measurement of sleep disturbance).
This study was nested within a prospective observational study carried out from January 2015 to June 2016. The aim of the primary study was to determine the main features of NLCs in primary care patients [17]. We recruited a convenience sample of 20 PCPs practicing in the canton of Geneva; they were asked to enrol up to 20 consecutive patients who came to the practice for a scheduled consultation. To be included in the study, patients had to be over 50 years old, be able to understand and write French and have suffered from NLCs in the previous 3 months. As inclusion criteria for our study, we used the usual definition of NLCs, namely any cramp in the legs or feet occurring during sleep or at rest [3, 18]. Patients were excluded if they had an unplanned consultation and if they were suffering from a terminal illness or from disorders affecting their ability to consent. Patients with or without sleep disorders could be included in the study.
The Pittsburgh Sleep Quality Index (PSQI) assesses a broad range of sleep domains and consists of 19 self-rated questions that measure seven components of sleep that are scored from 0 to 3: sleep quality, sleep latency, sleep duration, habitual sleep efficiency, sleep disturbance, use of sleep medication and daytime dysfunction (appendix 1). The global score is the combination of the seven sub-scores and ranges therefore from 0 to 21, with higher scores for worse sleep quality; the cut-off point to define “poor sleepers” is >5 [13, 14]. This instrument has well-established internal consistency and test-retest reliability, as well as criterion, construct and content validity [13, 14]. The PSQI instrument has been translated and validated in French [19].
For the purpose of the study, we developed a single-item measure of sleep disturbance using a simple question (“What was the level of sleep disturbance that you experienced during the previous night?”) to be rated on a daily basis on a 10 cm long visual analogue scale from 0 (no sleep disturbance) to 10 (worst possible sleep disturbance). When using the scale, patients were asked to indicate a position along a continuous line between the two end-points.
Patients were selected by the PCPs during the medical visit and were provided with an information sheet, consent form, questionnaire and daily log. The PCPs orally explained to patients how to complete the study documents. This information was also available in written form on the information sheet.
Patients were asked to complete at home a questionnaire about their sociodemographic characteristics (age, sex, marital status and work status) and their estimated health status in response to the question “in general, would you say that your health is: excellent, very good, good, moderate or poor?”. In addition, they were asked to record on a daily basis (for two weeks) the number of cramps and the level of sleep disturbance recorded on the visual analogue scale. Finally, they were asked to complete the PSQI questionnaire at the end of the study (day 14). All completed documents were then returned using a postage-paid envelope.
Shortly after the medical visit and at weeks 1 and 2, seven research assistants previously trained to conduct telephone interviews phoned patients to verify that the questionnaire and daily log were correctly completed. They systematically checked with the patients whether the recruiting physicians had complied with the inclusion and exclusion criteria. They were previously trained to differentiate between NLC and other usual sleep-related disorders such as restless leg syndrome or periodic limb movement disorder. None of the patients recruited by the PCPs needed to be excluded by the research assistants for errors in the inclusion and exclusion criteria.
We pretested the questionnaire and the daily log in four primary care practices to minimise flaws in their design and to ensure that were easy to understand.
We used frequency tables to describe categorical variables, and means and standard deviations (SDs) or medians and interquartile ranges (IQRs) to summarise continuous variables. For each patient, we computed the PSQI mean global and component scores and the single-item mean score (averaged over the 2-week study period). We used the average score, because the PSQI, our gold standard with which we planned to compare our instrument, is not sensitive to day-to-day differences. Then these scores were compared between genders, age (both as continuous and categorical variables) and number of cramps (both as continuous and categorical variables) using negative binomial regression [20, 21], whereas the proportion of “poor sleepers” was compared between genders, age categories, general health status and numbers of cramps categories using a chi-square test. We also examined changes in the proportion of “poor sleepers” with age and number of cramps as continuous variables using univariate logistic regression.
To examine the criterion validity of the single-item mean score, we used Spearman’s rank correlation coefficients to determine the correlation between the PSQI global and component scores, and the single-item mean score (averaged over the 2-week study period). Correlations of 0.10 were considered as “small”, 0.30 as “medium” and 0.50 as “large”. [22]
We found that the number of missing data-points in this study was relatively high for the PSQI global score. Therefore, after discussion within the study team, we decided to repeat all of the analyses described in this section after replacing the missing data for the PSQI component scores with the average of the other available scores. For example, if for a patient there was one missing value for the first component score and the score for the other six component scores was 1, the missing component score was assigned the value 1 (the average of the available scores). If all component scores were missing, the global score was considered as missing data.
We computed the required sample size (n = 110 patients) for the primary study [17]. We asked the 20 physicians to recruit up to 20 patients, but we thought that a number of physicians would not be able to recruit as many (for example, due to lack of time). We also thought that the research assistants would exclude a number of patients recruited by the physicians, for example because they actually had other sleep-related disorders such as restless leg syndrome or periodic limb movement disorder. For the current study, we expected the average prevalence of poor sleepers in our sample to be 50%, and wanted a 95% confidence interval (95% CI) width of about 0.2 for the estimate. Given the formula for the estimation of a proportion, the minimal required sample size was 96. The sample size estimated for the primary study met these requirements. Statistical significance was set at a two-sided p-value of ≤0.05. All analyses were carried out with Stata version 12.0.
All data were collected in an anonymous manner. We presumed tacit consent from the PCPs if they accepted to participate in the study, whereas we obtained informed consent from all patients. The research protocol was approved by the Research Ethics Committee of Geneva (ref: 14-232).
Twenty PCPs agreed to recruit patients for the study. Of the 233 patients who were interested in the study and agreed to be contacted by the study investigators, 129 (55%) participated in the study and completed the questionnaire and daily journal (follow-up rate 100%). The recruitment process is summarised in Figure 1.
Figure 1 Study recruitment and follow-up.
Table 1 summarises patients’ main sociodemographic characteristics. Their mean age was 70 years (SD 9) and 67% were women. Most patients were married (60%), retired (62%) and reported an excellent or good general health status (86%). There were relatively few cramps recorded per patient during the study period (median number per week 2, IQR 3), and 16 patients (12%) did not report any cramps. However, 40 patients (31%) reported more than three cramps per week.
Table 1 Patients’ characteristics (n = 129).
| Characteristics | Number of patients | % |
|---|---|---|
| Women (n = 129) | 86 | 66.7% |
| Age (n = 128) ‒ mean (SD) 70.0 (9.3) | ||
| ‒ age <65 | 37 | 28.9% |
| ‒ age 65−75 | 47 | 36.7% |
| ‒ age >75 | 44 | 34.4% |
| Marital status (n = 126) | ||
| ‒ single | 11 | 8.7% |
| ‒ married | 76 | 60.3% |
| ‒ divorced or separated | 23 | 18.3% |
| ‒ widowed | 16 | 12.7% |
| Work status (n = 126) | ||
| ‒ occupational activity | 27 | 21.4% |
| ‒ retired | 78 | 61.9% |
| ‒ recipient of unemployment or invalidity insurance | 6 | 4.8% |
| ‒ other (mainly house-wife/husband and without employment) | 15 | 11.9% |
| General health status (n = 126) | ||
| ‒ excellent or very good | 36 | 28.6% |
| ‒ good | 72 | 57.1% |
| ‒ moderate or poor | 18 | 14.3% |
| Number of cramps per patient, per week (n = 129)* ‒ Median (IQR) = 2 (3) | ||
| ‒ 0 | 16 | 12.4% |
| ‒ 0.5−1 | 34 | 26.4% |
| ‒ 1.5−2 | 23 | 17.8% |
| ‒ 2.5−3 | 16 | 12.4% |
| ‒ >3 | 40 | 31.0% |
Table 2 shows the PSQI mean global and component scores, overall and stratified by gender and age group. The number of available data-points varied between 94 for the global score and 124 for the sleep quality component score. The global score was missing for a relatively high number of patients (n = 35) because it required the combination of all seven component scores. On average, the global score was 6.1/21 (SD 3.9) and the component scores varied from 0.5 to 1.2/3. There were no statistically significant gender or age-group differences in global and component scores. The results were similar with age as a continuous variable. The incident rate ratio (IRR) was 1.00 (95% CI 0.98−1.01, p = 0.73) for the global score (i.e., for every unit increase in age, there was no change in the global score) and fluctuated between 0.96 and 1.02 for the component scores.
Table 2 Pittsburgh Sleep Quality Index (PSQI) global and component scores (means and standard deviations), overall and stratified by gender and age group.
| Number of patients | Overall | Women | Men | p-value* | Age <65 | Age 65−75 | Age >75 | p-value* | |
|---|---|---|---|---|---|---|---|---|---|
| Global scores | 94 | 6.1 (3.9) | 6.3 (4.1) | 5.8 (3.7) | 0.56 | 6.1 (4.5) | 6.4 (4.3) | 5.7 (2.7) | 0.70 |
| Component scores | |||||||||
| Sleep quality | 124 | 1.0 (0.7) | 1.1 (0.7) | 1.0 (0.7) | 0.81 | 1.2 (0.8) | 1.1 (0.8) | 0.9 (0.5) | 0.17 |
| Sleep latency | 103 | 1.2 (1.0) | 1.3 (1.0) | 0.9 (1.0) | 0.11 | 1.1 (1.0) | 1.2 (1.1) | 1.2 (0.8) | 0.72 |
| Sleep duration | 122 | 0.6 (0.8) | 0.5 (0.8) | 0.6 (0.8) | 0.80 | 0.6 (0.9) | 0.7 (0.8) | 0.3 (0.6) | 0.10 |
| Habitual sleep efficiency | 122 | 0.8 (1.0) | 0.9 (1.0) | 0.8 (0.9) | 0.50 | 0.7 (1.0) | 1.0 (1.0) | 0.8 (0.9) | 0.68 |
| Sleep disturbance | 97 | 1.2 (0.6) | 1.2 (0.6) | 1.2 (0.5) | 0.97 | 1.1 (0.6) | 1.3 (0.6) | 1.0 (0.4) | 0.74 |
| Use of sleep medication | 107 | 0.8 (1.2) | 0.8 (1.2) | 0.7 (1.1) | 0.72 | 0.7 (1.2) | 0.7 (1.1) | 1.0 (1.2) | 0.41 |
| Daytime dysfunction | 105 | 0.5 (0.8) | 0.5 (0.8) | 0.6 (0.8) | 0.81 | 0.7 (0.9) | 0.6 (0.7) | 0.4 (0.6) | 0.07 |
* Univariate negative binomial regression
We also examined the PSQI scores according to the number of cramps. Global and component scores were not associated with the number of cramps; the global score was 6.3 (SD 5.2) for patients who did not have cramps during the study period, 6.0 (SD 3.8) for those who had between 0.5 and 3 cramps per week and 6.2 (SD 3.7) for those who had more than three cramps per week (p = 0.94). The results were similar with the number of cramps as a continuous variable. The IRR was 0.99 (95% CI 0.96−1.02, p = 0.63) for the global score.
The single-item mean score averaged over the 2-week study period was 2.6/10 (SD 2.5). There were no statistically significant differences by gender (women 2.7, SD 2.6; men 2.3 SD 2.1; p = 0.43), age group (<65 years 3.3, SD 3.0; 65−75 years 2.3, SD 1.9; >75 years 2.4, SD 2.5; p = 0.21) and number of cramps (no cramps 2.4, SD 3.3; 0.5−3 cramps per week 2.5, SD 2.7; >3 cramps per week 2.7, SD 2.0; p = 0.68). Using age and number of cramps as continuous variables, the IRR was 0.99 (95% CI 0.97−1.01, p =0.14) for age and 1.02 (95% CI 0.98−1.05, p = 0.36) for the number of cramps.
Table 3 presents the proportion of “poor sleepers” based on the PSQI cut-off score of >5, overall and stratified by patient characteristics. Almost half of the patients (46.8%, 95% CI 36.9−57.0%) were considered to be “poor sleepers”. There were no statistically significant differences by gender, age group, general health status and number of cramps. For a one-unit increase in age, the odds of being a “poor sleeper” increased by a factor of 1.01 (95% CI 0.97−1.06, p = 0.57] whereas for a one-unit increase in the number of cramps, this factor was 0.98 (95% CI 0.90−1.08, p = 0.71].
Table 3 Proportion of poor sleepers, overall and stratified by patient characteristics.
| Characteristics | Number of patients | Proportion of poor sleepers (%) | p-value* | |
|---|---|---|---|---|
| Overall | 94 | 46.8 | NA | |
| Gender (n = 94) | Male | 33 | 45.5 | 0.85 |
| Female | 61 | 47.5 | ||
| Age group (n = 94) | <65 | 28 | 42.9 | 0.80 |
| 65−75 | 39 | 46.2 | ||
| >75 | 27 | 51.9 | ||
| General health status (n = 93) | Excellent or good | 80 | 45.0 | 0.27 |
| Moderate or poor | 13 | 61.5 | ||
| Number of cramps per week (n = 94) | 0 | 12 | 33.3 | 0.56 |
| 0.5−3 | 49 | 46.9 | ||
| >3 | 33 | 51.5 | ||
* Chi-square test
Finally, table 4 shows the Spearman’s rank correlations between the PSQI global and component scores and the single-item mean score, and the scatter plot in figure 2 shows the relationship between the PSQI global score and the single-item mean score. All correlations that were examined were small (<0.15), except for the sleep latency component score where it was moderate (0.27).
Table 4 Correlations between Pittsburgh Sleep Quality Index (PSQI) global and component scores and single-item mean score.
| Spearman’s rank correlation coefficients (rho) | p-value | |
|---|---|---|
| Global scores | 0.08 | 0.51 |
| Component scores | ||
| Sleep quality | 0.11 | 0.26 |
| Sleep latency | 0.27 | 0.01 |
| Sleep duration | −0.13 | 0.20 |
| Habitual sleep efficiency | −0.10 | 0.31 |
| Sleep disturbance | 0.04 | 0.74 |
| Use of sleep medication | 0.08 | 0.48 |
| Daytime dysfunction | −0.06 | 0.61 |

Figure 2 Relationship between the PSQI global score and the single-item mean score.
As the number of missing data-points was relatively high for the PSQI global score (35 missing values), all analyses were repeated after replacing the missing data for the PSQI component scores with the average of the other available scores. This resulted in a global score for 124 patients (the remaining 5 patients did not respond at all). The differences we found were very small compared with the original data. On average, the global score was 5.9 (SD 3.9) compared with 6.1 (SD 3.9) with the original data, whereas the proportion of “poor sleepers” was 46.0% (95% CI 37.3−54.9%) compared with 46.8% (95% CI 36.9−57.0%). As was the case with the original data, there were no statistically significant associations between predictive and outcome variables.
In this sample of primary care patients above the age of 50 years, we found that the PSQI global score was 6.1 on average and the proportion of “poor sleepers” was 47%, without statistically significant differences according to patient characteristics and number of NLCs. We also found that the single-item mean score was not a valid instrument to screen for sleep disturbance among these patients.
Our study confirms that sleep quality is often impaired in patients over 50 years of age [23]. It also shows that the proportion of poor sleepers tends to increase with the number of cramps. The fact that the differences between the groups were not statistically significant could be due to the relatively small sample size of our study.
Little research has been carried out to assess the impact of NLCs on sleep quality. Interestingly, two recent studies showed a link between sleep quality and NLCs [4, 10]. A cross-sectional study carried out in the US, using the data from the National Health and Nutrition Examination Survey (NHANES), showed that moderate to severe NLCs (≥15 nights/month) were associated with a low quality of sleep: difficulty falling asleep (43 vs 15% for responders without NLCs, p <0.001); difficulty maintaining sleep (49 vs 17%, p <0.001); non-restorative sleep (58 vs 23%, p <0.001); daytime sleepiness (46 vs 15%, p <0.001) [4]. The authors of this study, however, did not use a validated instrument to measure sleep quality; this limited the validity of these findings. An Australian case-control study (80 cases, 80 age- and sex-matched controls) using the validated Medical Outcomes Study Sleep Survey (MOS-SS) also showed this link with sleep quality: sleep disturbance (median score 36 for cases vs 16 for controls, p <0.001); sleep adequacy (50 vs 70, p = 0.001); daytime somnolence (27 vs 20, p = 0.01); sleep problems index (33 vs 20, p <0.001). For all MOS-SS domains except sleep adequacy higher scores mean lesser quality sleep [10]
Whereas the association between age and prevalence of cramps is well known [1, 2, 4, 8], we found no association between age and sleep quality. This may have been due to the relatively small sample size of our study.
Since sleep disturbances are common among patients suffering from NLC, it would be useful if PCPs could use brief and valid instruments to assess sleep quality in these patients. Unfortunately, we found that scores on our proposed visual analogue scale were not correlated with the well-established PSQI instrument, and therefore should not be used to screen patients with NLC. A single-item measure is probably insufficient to explore the multiple dimensions and the complex mechanisms of sleep quality in these patients.
The PSQI instrument uses a retrospective design, and the responses to the questionnaire may therefore be subject to recall bias [14]; the measure could be less sensitive to assessing changes over time during this period. For this reason, it would probably be interesting in the future to combine this instrument with daily sleep diaries, and to compare the results with face-to-face diagnostic interviews and/or polysomnographic recordings.
Some limitations need to be kept in mind when considering our results. The study sample consisted only of patients recruited in the Geneva area, and the findings cannot necessarily be generalised to other regions in Switzerland or Europe. Selection bias cannot be completely excluded; indeed, we cannot be sure that all eligible patients were asked to participate by PCPs. We had planned not to collect data on patients who refused to participate in the study or on patients who did not meet the inclusion criteria, in order to minimise the recruitment effort by PCPs; therefore, we could not assess potential differences between responders and non-responders. Our data were based on a relatively small sample (number of patients 129). The methods used to collect the study data (self-administered questionnaires, daily logs and telephone interviews) may result in underreporting and/or measurement error. The number of missing data was relatively high for the PSQI global score (35 missing data). However, we believe that the risk of bias is probably not very high. Indeed, all analyses were repeated after replacing the missing data for the PSQI component scores with the average of the other available scores, and the analyses with these data and the original data were similar. Finally, as mentioned above, the PSQI instrument, which was considered as the “gold standard” to which the single-item measure was compared, may not be sufficiently sensitive to change; in future studies we should consider the use of face-to-face diagnostic interviews and/or polysomnographic recordings.
In summary, our study showed (i) that nearly half of the patients in our sample were poor sleepers, (ii) that this proportion was not associated with patient characteristics and the number of cramps, and (iii) that the single-item screening tool is not a valid instrument for detecting sleep disturbance in these patients. Future research should focus on the development of short and valid tools to assess sleep quality in patients with NLC.
The appendix is available as a separate file at https://smw.ch/article/doi/smw.2020.20217.
We would like to warmly thank all the doctors and patients who participated in this study, as well as Asmaa Dhina, Melody Favre, Romain Guemara, Dominique Ricard-Gauthier, Leandro Sanz, Farana Haque and Zoe Koul, the medical students who conducted the telephone interviews.
This project was supported by institutional funding from the Faculty of Medicine, University of Geneva.
No potential conflict of interest relevant to this article was reported.
1 Monderer RS , Wu WP , Thorpy MJ . Nocturnal leg cramps. Curr Neurol Neurosci Rep. 2010;10(1):53–9. doi:.https://doi.org/10.1007/s11910-009-0079-5
2 Allen RE , Kirby KA . Nocturnal leg cramps. Am Fam Physician. 2012;86(4):350–5.
3 Rabbitt L , Mulkerrin EC , O’Keeffe ST . A review of nocturnal leg cramps in older people. Age Ageing. 2016;45(6):776–82. doi:.https://doi.org/10.1093/ageing/afw139
4 Grandner MA , Winkelman JW . Nocturnal leg cramps: Prevalence and associations with demographics, sleep disturbance symptoms, medical conditions, and cardiometabolic risk factors. PLoS One. 2017;12(6):e0178465. doi:.https://doi.org/10.1371/journal.pone.0178465
5 Jansen PH , Lecluse RG , Verbeek AL . Past and current understanding of the pathophysiology of muscle cramps: why treatment of varicose veins does not relieve leg cramps. J Eur Acad Dermatol Venereol. 1999;12(3):222–9. doi:.https://doi.org/10.1111/j.1468-3083.1999.tb01032.x
6 Maisonneuve H , Chambe J , Delacour C , Muller J , Rougerie F , Haller DM , et al. Prevalence of cramps in patients over the age of 60 in primary care : a cross sectional study. BMC Fam Pract. 2016;17(1):111. doi:.https://doi.org/10.1186/s12875-016-0509-9
7 Abdulla AJ , Jones PW , Pearce VR . Leg cramps in the elderly: prevalence, drug and disease associations. Int J Clin Pract. 1999;53(7):494–6.
8 Naylor JR , Young JB . A general population survey of rest cramps. Age Ageing. 1994;23(5):418–20. doi:.https://doi.org/10.1093/ageing/23.5.418
9 Oboler SK , Prochazka AV , Meyer TJ . Leg symptoms in outpatient veterans. West J Med. 1991;155(3):256–9.
10 Hawke F , Chuter V , Burns J . Impact of nocturnal calf cramping on quality of sleep and health-related quality of life. Qual Life Res. 2013;22(6):1281–6. doi:.https://doi.org/10.1007/s11136-012-0274-8
11 Livingston G , Blizard B , Mann A . Does sleep disturbance predict depression in elderly people? A study in inner London. Br J Gen Pract. 1993;43(376):445–8.
12 Dew MA , Hoch CC , Buysse DJ , Monk TH , Begley AE , Houck PR , et al. Healthy older adults’ sleep predicts all-cause mortality at 4 to 19 years of follow-up. Psychosom Med. 2003;65(1):63–73. doi:.https://doi.org/10.1097/01.PSY.0000039756.23250.7C
13 Buysse DJ , Reynolds CF, 3rd , Monk TH , Berman SR , Kupfer DJ . The Pittsburgh Sleep Quality Index: a new instrument for psychiatric practice and research. Psychiatry Res. 1989;28(2):193–213. doi:.https://doi.org/10.1016/0165-1781(89)90047-4
14 Smith MT , Wegener ST . Measures of sleep: The Insomnia Severity Index, Medical Outcomes Study (MOS) Sleep Scale, Pittsburgh Sleep Diary (PSD), and Pittsburgh Sleep Quality Index (PSQI). Arthritis Care Res. 2003;49(S5):S184–96. doi:.https://doi.org/10.1002/art.11409
15 Voorhees JR , Xierali IM , Bazemore AW , Phillips RL, Jr , Jaén CR , Puffer JC . A small percentage of family physicians report time devoted to research. J Am Board Fam Med. 2013;26(1):7–8. doi:.https://doi.org/10.3122/jabfm.2013.01.120125
16 Sahin D , Yaffe MJ , Sussman T , McCusker J . A mixed studies literature review of family physicians’ participation in research. Fam Med. 2014;46(7):503–14.
17 Sebo P , Haller D , Cerutti B , Maisonneuve H . A prospective observational study of the main features of nocturnal leg cramps in primary care. Swiss Med Wkly. 2019;149:w20048. doi:.https://doi.org/10.4414/smw.2019.20048
18 Hallegraeff J , de Greef M , Krijnen W , van der Schans C . Criteria in diagnosing nocturnal leg cramps: a systematic review. BMC Fam Pract. 2017;18(1):29. doi:.https://doi.org/10.1186/s12875-017-0600-x
19 Blais FC , Gendron L , Mimeault V , Morin CM . [Evaluation of insomnia: validity of 3 questionnaires]. Encephale. 1997;23(6):447–53. Article in French.
20Negative Binomial Regression | Stata Annotated Output [Internet]. [cited 2019 Nov 2]. Available from: https://stats.idre.ucla.edu/stata/output/negative-binomial-regression/
21Negative Binomial Regression | Stata Data Analysis Examples [Internet]. [cited 2019 Nov 2]. Available from: https://stats.idre.ucla.edu/stata/dae/negative-binomial-regression/
22Cohen J. Statistical power analysis for the behavioral sciences. 2nd ed. Hillsdale, N.J: L. Erlbaum Associates: 1988.
23 Brewster GS , Riegel B , Gehrman PR . Insomnia in the Older Adult. Sleep Med Clin. 2018;13(1):13–9. doi:.https://doi.org/10.1016/j.jsmc.2017.09.002
This project was supported by institutional funding from the Faculty of Medicine, University of Geneva.
No potential conflict of interest relevant to this article was reported.