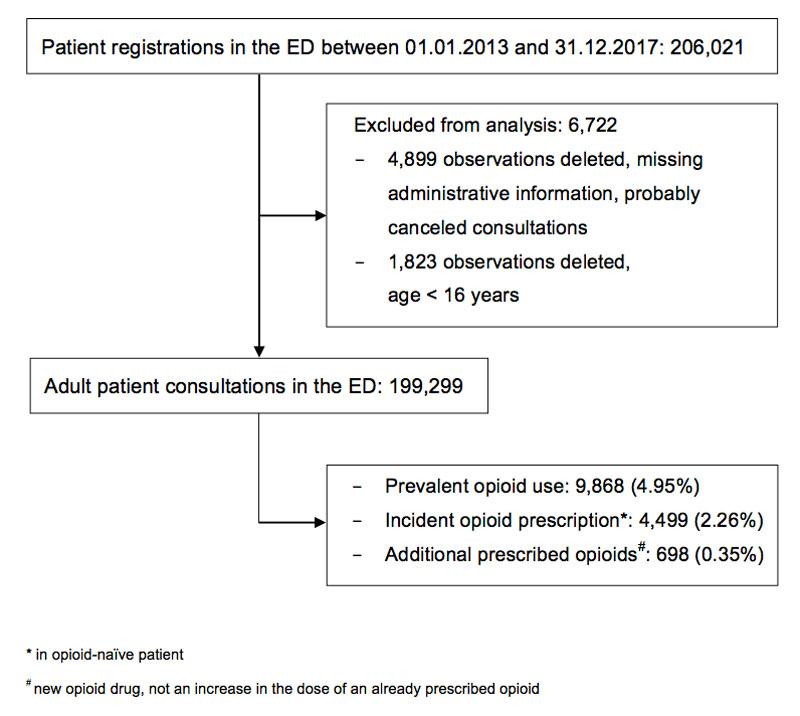
Figure 1 Patient inclusion and exclusion.
DOI: https://doi.org/10.4414/smw.2020.20202
Pain is the most common motive for seeking medical care, accounting for over half of the chief complaints in emergency departments (EDs) [1]. Opioid use disorders are estimated to have increased worldwide by 50% between 1990 and 2016 [2]. In the USA, opioid addiction has reached epidemic proportions, with 18,238 opioid-related deaths; in 2016, opioids were the fifth leading cause of death in men aged between 15 and 49 years [2, 3]. Patients discharged from the ED after an opioid overdose show increased mortality, particularly in the following 2 days [4].
In 2015, 36.4% of the population above 12 years in the USA used opioids and it was estimated that addiction associated with prescription opioids concerned 0.7% [5, 6]. The same percentage (0.7%) of the global population aged 15–64 years was assessed as misusing prescription drugs in 2016 [7].
In 2015, Switzerland was the world’s seventh largest consumer of opioids per capita [8] and the consumption of opioids in Switzerland increased by 100% between 2006 and 2013 [9]. An analysis of health insurance data of one of the major health insurers in Switzerland found that 14.3% of the 2,561,558 insured patients (about 29% of the Swiss population) made opioid claims between 2006 and 2014 [10].
In an analysis of 5308 young adult men from the Swiss cohort study on substance use risk factors, non-medical use of prescription opioids was strongly associated with traumatic events such as traffic accidents, earthquakes, severe illness or injury [11]. Most patients facing such events will be treated in an ED. Conversion to persistent opioid use has been shown to increase in patients receiving an opioid prescription in the ED [12].
Information about the prevalence and characteristics of patients who are taking or receiving opioids and consult an ED may be useful in increasing clinical awareness and in providing data for regional and national policymakers. Furthermore, information about trends in opioid prescription in recent years could provide information that might be exploited in interventions to reduce opioid prescriptions. Thus, we aimed (1) to determine the prevalence of opioid-consuming patients and prescriptions at the ED over the last 5 years and (2) to characterise consultations with first time (incident) opioid prescription.
This study was a retrospective data analysis at the ED of Bern University Hospital – with a catchment area of two million people, and about 45,000 ED consultations per year [13]. The study period was set from 1 January 2013 to 31 December 2017.
All patients registered in the ED documentation system E-Care (E-Care, ED 2.1.3.0, Turnhout, Belgium) between 2013 and 2017 were included in the analysis if they were at least 16 years of age at the time of their presentation.
The records of patients who had been prescribed at least one opioid (defined below) at either presentation or discharge were further analysed in full text to determine the incident and prevalent opioid use.
Opioids were defined as any medication with a code starting with N02A, i.e., opioid analgesics, as defined in the Anatomical Therapeutic Chemical (ATC) classification system [14].
On presentation at the ED, every patient receives a case identification number, which is used for the recordings in E-Care and further codified data analysis. Demographic (age, gender) and health-related data of ED patients was transferred into a database. The chief complaint and the triage category are routinely registered by specially trained nurses when the patient is admitted. The medication was screened for opioids as defined above. The E-Care interface is used for recording medication on presentation and discharge. The two relevant fields were automatically checked for relevant entries. These entries were made by physicians during their routine work and were used to identify patients who were either receiving opioids on arrival or were discharged on opioids. The ED medical reports of the identified consultations (opioid prescription on arrival or discharge) were analysed in full text (by SW) to determine the parameters: “prevalent opioid use” (consultations with at least one opioid on arrival), “incident opioid prescription in opioid-naïve patients” (consultations with a newly prescribed opioid without documented opioid intake on arrival) and “additional opioid prescription” (new opioid substance, not an increase in the dose), using an abstraction form. The extractor was blinded to the study year.
For quality control, the stored medication fields of 200 randomised consultations were manually checked for opioid medication and compared with the automatic extraction procedure. For training and validity purposes, the abstractor (SW) was briefed and the two variables “incident” and “additional” opioid prescription were manually coded and compared by two investigators (SW and MM) using 200 randomised consultations involving opioids. Cohen’s kappa was calculated to test interrater reliability. A Cohen’s kappa >0.800 was defined as an indicator for “high” agreement.
Year of admission, gender, age, reason for admission (chief complaint), type of admission, triage according to the Swiss triage scale [15] and revisits within 6 months were considered potential predictor variables for incident opioid prescription. These variables are all routinely stored in the ED documentation system.
The study was performed in accordance with Swiss law. The Bern ethics committee registered the study as a quality control study (Req-2019-00593) and waived the need for informed consent.
The statistical analysis was performed with Stata® 13.1 (StataCorp, The College Station, Texas, USA). The study period was divided in into ten time intervals, each of 6 months (half year; first half of 2013 to the second half of 2017). The relative number of the target parameters (incident and prevalent opioid prescription) was determined and presented, accompanied by its 95% confidence interval (CI) in total and in each timespan: for example, the number of consultations with newly prescribed opioids per half year divided by the total number of consultations in the studied half year. The association of opioid prescription (incident and prevalent) and time (half year) was tested using a chi-square test. In addition, the chi-square test for a linear trend – including the slope and standard error of the trend (Stata’s – ptrend command) – was used to test for a trend over the study period and presented within a scatter plot of the half year and the proportion. Associations of potential predictor variables with any of the target parameters were tested using a chi-square test. All potential predictor variables were presented as a proportion accompanied by the absolute number. For multivariable analysis, adjusted proportions with 95% CIs of incident and prevalent opioid prescription were obtained through multivariable logistic regression analysis, in order to ensure that potential differences in proportions were not caused by identified possible confounders – including all variables that had shown at least very weak evidence (p <0.2) for an association with incident opioid prescription as potential confounders. In addition, an interaction effect between age group and trauma was implemented in the logistic regression model.
A p-value of <0.05 was considered significant. No formal sample size calculation was performed but all eligible consultations were included in the study. There was no adjustment for multiple hypothesis testing.
Agreement was high for interrater values to determine opioid prescription on presentation or discharge (Cohen’s kappa = 0.960), newly prescribed (incident) opioid prescription (Cohen’s kappa = 0.952), as well as additional opioid prescription (Cohen’s kappa = 0.852).
Between January 2013 and December 2017, 206,021 patients were registered at the ED (fig. 1). Consultations with missing administrative information or consultations of patients below 16 years of age were excluded; thus, entries from 199,299 consultations were available for data analysis.
Figure 1 Patient inclusion and exclusion.
In 5 years, 14,367 consultations had at least one opioid documented on presentation or discharge (7.21%, 95% CI 7.10–7.32%). Around two thirds of these patients (n = 9868) were taking opioids at the time of presentation at the ED (prevalent opioid use: 4.95%, 95% CI 4.86–5.05%), and one third of the patients (n = 4499) were opioid naïve and were prescribed opioids for the first time (incident opioid prescription: 2.26%, 95% CI 2.19–2.32%). In 7.07% of patients (95% CI 6.57–7.58%), additional opioids were prescribed to patients already under opioid medication (0.35%, 95% CI 0.32–0.38% of all consultations).
Characteristics of patients with newly prescribed opioids are shown in table 1. In comparison with patients without incident opioid prescriptions, significant differences between the two groups were found for the age of the patients, type and time of admission, triage allocation and the chief complaint (all p <0.001). Relatively fewer patients between 16 and 24 years of age (7.69 vs 14.04%) and relatively more patients between 25 and 44 years of age (34.85 vs 31.71%) or 45 and 64 years of age (34.14 vs 28.21%) had been prescribed opioids. Opioid-naïve patients receiving opioids at the ED were predominantly walk-in patients (57.06 vs 45.28%) and the majority of them (61.30 vs 57.18%) visited during the daytime (06:00–17:00). The most prevalent designated chief complaints of patients requiring an opioid prescription at the ED were musculoskeletal problems, including rheumatological diseases (37.23 vs 13.03%) and physical trauma (27.01 vs 14.57%) (table 1).
Table 1 Patient characteristics according to incident opioid use (n = 199,299).
| Newly prescribed opioid |
Total
(n = 199,299) |
p-value | ||||||
|---|---|---|---|---|---|---|---|---|
|
No
(n = 194,803) |
Yes
(n = 4496) |
|||||||
| Day of the week, n (%) | Monday | 29,108 | (14.94) | 675 | (15.00) | 29,783 | (14.94) | 0.240 |
| Tuesday | 26,519 | (13.61) | 586 | (13.03) | 27,105 | (13.60) | ||
| Wednesday | 26,604 | (13.66) | 617 | (13.71) | 27,221 | (13.66) | ||
| Thursday | 26,936 | (13.83) | 610 | (13.56) | 27,546 | (13.82) | ||
| Friday | 28,496 | (14.63) | 666 | (14.80) | 29,162 | (14.63) | ||
| Saturday | 29,445 | (15.12) | 648 | (14.4) | 30,093 | (15.10) | ||
| Sunday | 27,692 | (14.22) | 697 | (15.49) | 28,389 | (14.24) | ||
| Time of admission, n (%) | Day (06:00 to 17:00) | 111,383 | (57.18) | 2758 | (61.30) | 114,141 | (57.27) | <0.001 |
| Evening (17:00 to 22:00) | 52,196 | (26.79) | 1048 | (23.29) | 53,244 | (26.72) | ||
| Night (22:00 to 06:00) | 31,221 | (16.03) | 693 | (15.4) | 31,914 | (16.01) | ||
| Saturday or Sunday admission (00:00 to 23:59), n (%) | 57,137 | (29.33) | 1345 | (29.9) | 58,482 | (29.34) | 0.411 | |
| Public and cantonal (Bern) holidays, n (%) | 3927 | (2.02) | 107 | (2.38) | 4034 | (2.02) | 0.088 | |
| Effective weekends (19:00 Friday to 06:59 Monday), n (%) | 66,042 | (33.90) | 1553 | (34.52) | 67,595 | (33.92) | 0.388 | |
| Effective days off (Sat., Sun. and public holidays), n (%) | 59,876 | (30.74) | 1417 | (31.5) | 61,293 | (30.75) | 0.276 | |
| Triage, n (%) | Life-threatening | 15,058 | (7.73) | 283 | (6.29) | 15,341 | (7.70) | <0.001 |
| Highly urgent | 45,290 | (23.25) | 915 | (20.34) | 46,205 | (23.18) | ||
| Urgent | 113,839 | (58.44) | 3048 | (67.75) | 116,887 | (58.65) | ||
| Semi-urgent | 13,243 | (6.80) | 163 | (3.62) | 13,406 | (6.73) | ||
| Non-urgent | 3182 | (1.63) | 49 | (1.09) | 3231 | (1.62) | ||
| Missing | 4188 | (2.15) | 41 | (0.91) | 4229 | (2.12) | ||
| Sex, n (%) | Male | 109,383 | (56.15) | 2557 | (56.83) | 111,940 | (56.17) | 0.361 |
| Female | 85,417 | (43.85) | 1942 | (43.17) | 87,359 | (43.83) | ||
| Age group, n (%) | 16–24 | 27,353 | (14.04) | 346 | (7.69) | 27,699 | (13.90) | <0.001 |
| 25–44 | 61,776 | (31.71) | 1568 | (34.85) | 63,344 | (31.78) | ||
| 45–64 | 54,961 | (28.21) | 1536 | (34.14) | 56,497 | (28.35) | ||
| 65–84 | 42,629 | (21.88) | 870 | (19.34) | 43,499 | (21.83) | ||
| ≥85 | 8081 | (4.15) | 179 | (3.98) | 8260 | (4.14) | ||
| Type of referral, n (%) | Walk-in | 88,205 | (45.28) | 2567 | (57.06) | 90,772 | (45.55) | <0.001 |
| Ambulance | 28,576 | (14.67) | 705 | (15.67) | 29,281 | (14.69) | ||
| External hospital | 14,924 | (7.66) | 167 | (3.71) | 15,091 | (7.57) | ||
| General practitioner | 10,727 | (5.51) | 216 | (4.80) | 10,943 | (5.49) | ||
| Internal referral | 7382 | (3.79) | 99 | (2.2) | 7481 | (3.75) | ||
| Air rescue | 2388 | (1.23) | 115 | (2.56) | 2503 | (1.26) | ||
| Police | 2172 | (1.11) | 13 | (0.29) | 2185 | (1.10) | ||
| Urgent care centre/doctor | 1767 | (0.91) | 49 | (1.09) | 1816 | (0.91) | ||
| Repatriation | 305 | (0.16) | 12 | (0.27) | 317 | (0.16) | ||
| Other | 730 | (0.37) | 7 | (0.16) | 737 | (0.37) | ||
| No information | 37,624 | (19.31) | 549 | (12.20) | 38,173 | (19.15) | ||
| Revisit in half year, n (%) | 33,998 | (17.45) | 782 | (17.38) | 34,780 | (17.45) | 0.901 | |
| Chief complaint, n (%) | Trauma | 28,386 | (14.57) | 1215 | (27.01) | 29,601 | (14.85) | <0.001 |
| Musculoskeletal including rheumatological problems | 25,379 | (13.03) | 1675 | (37.23) | 27,054 | (13.57) | ||
| Neurological problem | 22,918 | (11.76) | 233 | (5.18) | 23,151 | (11.62) | ||
| Infectious disease, including skin problems | 13,377 | (6.87) | 172 | (3.82) | 13,549 | (6.8) | ||
| Psychiatric problem, including self-harm | 12,836 | (6.59) | 9 | (0.20) | 12,845 | (6.45) | ||
| Ear/nose/throat problems | 12,188 | (6.26) | 109 | (2.42) | 12,297 | (6.17) | ||
| Cardiovascular problem | 11,811 | (6.06) | 201 | (4.47) | 12,012 | (6.03) | ||
| Eye problem | 11,968 | (6.14) | 0 | (0.00) | 11,968 | (6.01) | ||
| Respiratory problem | 6944 | (3.56) | 111 | (2.47) | 7055 | (3.54) | ||
| Genitourinary problem | 6160 | (3.16) | 162 | (3.60) | 6322 | (3.17) | ||
| Follow up | 4028 | (2.07) | 30 | (0.67) | 4058 | (2.04) | ||
| Gastrointestinal problem | 1375 | (0.71) | 38 | (0.84) | 1413 | (0.71) | ||
| Dental problem | 559 | (0.29) | 29 | (0.64) | 588 | (0.30) | ||
| Obstetric or gynaecological problem | 20 | (0.01) | 0 | (0.00) | 20 | (0.01) | ||
| Other | 21,022 | (10.79) | 293 | (6.51) | 21,315 | (10.69) | ||
| Missing | 15,829 | (8.13) | 222 | (4.93) | 16,051 | (8.05) | ||
The incidence of new opioid prescriptions was highest in the first half of 2014, at 2.54% (2.31–2.77%), and lowest in the first half of 2016 at 2.03% (1.84–2.22%) (fig. 2A, supplementary table S1A in appendix 1). The chi-square statistic for a linear trend showed a significant (p <0.001) negative trend over the study period (slope −0.041% per half year, standard error 0.012%, supplementary fig. S1A in appendix 1). If the analysis was restricted to out-patients only, the incidence for new prescriptions of opioids ranged between 1.97 and 2.62% (fig. 2B). The trend towards a decreased proportion of new opioid prescriptions was descriptively less prominent and nonsignificant (p = 0.069) in outpatients (slope −0.026% per half year, standard error 0.014%, fig. S1B) in the unadjusted analysis, although a significant association between incident opioid prescription and half year (p = 0.014) was found in outpatients (table S1A).
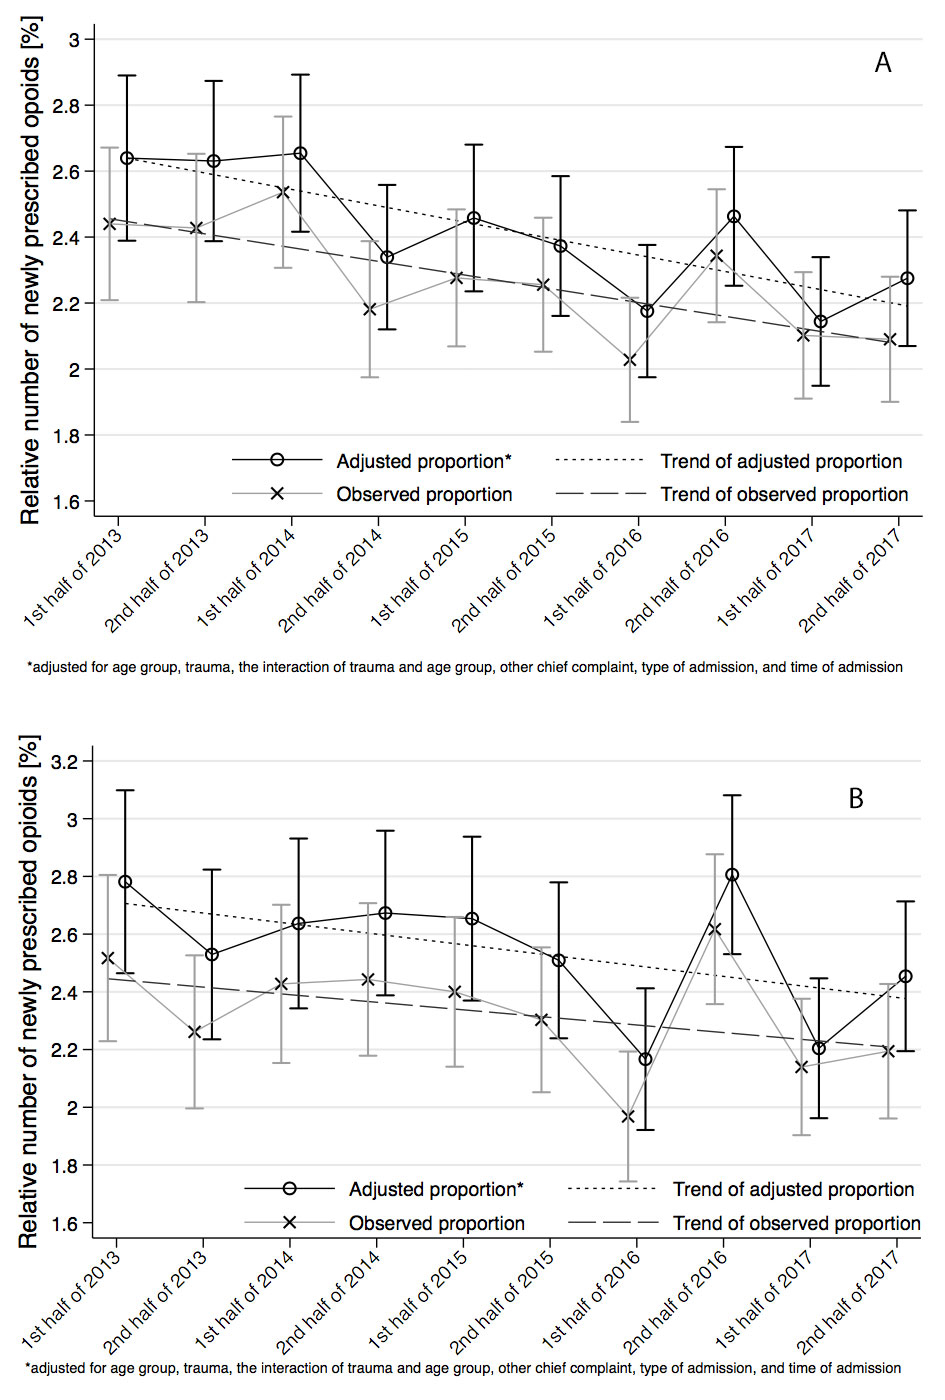
Figure 2 Observed and adjusted relative numbers of incident opioid prescription, i.e., newly prescribed opioids in opioid-naïve patients (A) in all patients, n = 199,299; (B) in outpatients, n = 134,468. The relative number per 6 months with accompanying 95% confidence interval and linear trends are presented.
For multivariable analysis the observed proportions were adjusted for variables that had shown at least very weak evidence (p <0.2) for an association with incident opioid use (see table 1). In the adjusted analysis, there was a significant association between incident opioid use and half year in all patients (p = 0.002), as well as in outpatients (p = 0.004), with significant linear decreasing trends both in all patients (slope −0.049, standard error 0.012, p <0.001) and in outpatients (slope −0.036, standard error 0.015%, p = 0.016), see figs 2A and 2B.
The proportion of patients per half year with documented opioid use on presentation over the study period is shown in figure 3 (table S1B and fig. S2 in appendix 1). The observed proportion ranged from 4.64% (95% CI 4.35–4.94%) in the second half of 2014 to 5.26% (95% CI 4.97–5.56%) in the second half of 2017 and showed a significant positive linear trend over time (p <0.001), corresponding to an increase in prevalent opioid consultations of about 0.06% per half year; see figure 3 (slope 0.058%, standard error 0.017%). In multivariable analysis, the increasing linear trend over the study period could not be confirmed (slope −0.001%, standard error 0.017, p = 0.736) as there was no significant association of the adjusted proportions and half year (p = 0.163) after adjustment for age group, trauma, the interaction of trauma and age group, other chief complaints, type of admission, and time of admission (fig. 3 and table S1B).
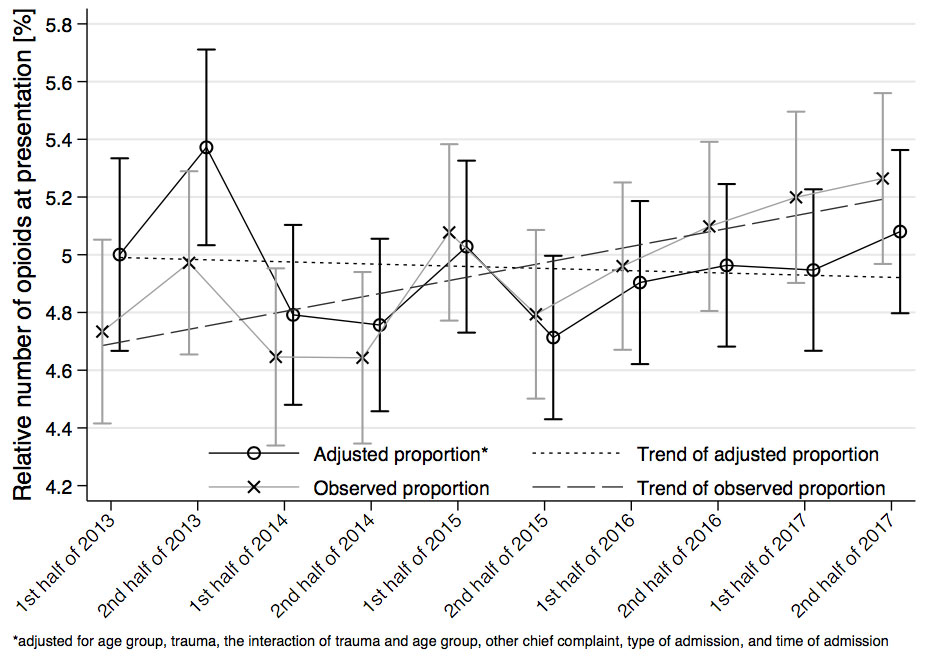
Figure 3 Observed and adjusted relative number of opioid use on presentation (prevalent opioid use) including a linear trend. The relative number per six months with accompanying 95% confidence interval are presented, n = 199,299.
In this sample, the average prevalence of opioid use was around 5% and incident opioid use in opioid-naïve patients was around 2.2%. The prevalence of opioid consumption appears to be higher at the ED than in the general population. For Europe, prevalence of opioid use was estimated as 2.2% in 2017 and in 2016 [5], and a survey in 11,000 participants from the Swiss population over 15 years of age indicated that 1.8% of the population used strong analgesics daily for at least 1 year [16]. This discrepancy is most probably due to the difference in the population profile of the ED when compared with the general population.
In 2013, incidental opioid use, as extrapolated from health insurance data for the Swiss population, was 4.8% for at least one weak opioid claim (with a morphine conversion factor of 0.3 or less, namely codeine and combinations, tilidine, tramadol and tapentadol) and 2.8% for at least one strong opioid claim (defined as no weak opioid) [9]. Thus, the average raw incidence of new prescriptions at the study centre appears to be relatively low.
The proportions of patients consuming opioids on presentation at the ED increased significantly over time, but the linear trend of this increase was not robust to adjustment for the identified confounders (age and diagnoses). Our data may support the findings of Gmel et al. [16] that use of strong analgesics increased in Switzerland until 2015 – especially in elderly patients. The patients using opioids when visiting the ED may have become older and the incidence of musculoskeletal pain possibly increased over the years.
Incidental opioid prescriptions at the ED were analysed as a quality assurance endpoint. It is promising that new opioid prescriptions at the ED exhibited a significant slightly decreasing trend in the logistic regression analysing all ED patients, which was robust to adjustment for the detected covariables. On the other hand, this difference was outside the threshold of the 95% CI and the findings may have been influenced by factors that were out of the scope of our study. In any case, there was no significant increase.
Changes in ED prescription practice might not substantially alter the prevalence of opioid use, as one retrospective analysis of the nationally representative Medical Expenditure Panel Survey in the Unites States found that the majority of the increase in opioid prescriptions between 1996 and 2012 was attributable to office visits and refills of previously prescribed opioids, and only modestly due to ED visits [17]. Thus, other sources of opioid prescription should be additionally targeted in order to decrease opioid use in the general population. Furthermore, the finding that opioid prevalence and incidence are associated with both age and disease in our sample raises the question as to whether and to what extent opioid use is in fact rather appropriate in our population and whether it presents any real problem.
There are several limitations that may influence the reliability of the present results. Firstly, prevalent and incidental opioid use, as well as the relative number of additional prescribed opioids, might be underestimated in the sample owing to documentation bias, as missing documentation of an opioid medication was handled as “no opioid medication”. Moreover, it is unclear what doses of opioids the patients consulting the ED had consumed and over what period. Furthermore, the trend for less opioid prescriptions at the ED may also be confounded by factors that were not part of our analysis. For example, transfer policy within the university clinic may have changed in such a way that patients in need for hospitalisation were transferred to the ward before treatment with strong analgesics at the ED.
Secondly, the reason for consultation (“chief complaint”, e.g., the principal symptom) does not cover all aspects of the morbidity of the patient and was, at least in some patients, not linked to the opioid therapy taken. Thus, the morbidity and health of the patient population may not have been adequately described. Furthermore, the type, dosage and duration of the opioid medication were not considered in this analysis. This limits the usefulness of the data in risk-benefit assessments on pain therapy at the ED and may qualify conclusions regarding public health concerns, such as non-medical use of prescription drugs.
Lastly, the conclusions are derived from a single centre analysis of a university hospital, so the external validity may be limited.
The prescriptions were not associated with repeated visits to the ED within 6 months. It can be assumed, however, that patients subsequently visited healthcare institutions other than the ED. In a nationwide cohort observation in the United States, the Consortium to Study Opioid Risks and Trends (CONSORT) found that 3–5.5% of patients who had initiated opioid consumption because of acute pain received long-term opioid therapy, defined as an episode of use lasting at least 90 days with at least 10 prescriptions and/or 120 days’ supply of opioids dispensed in the episode [18]. Another study found that 68% of opioids prescribed at the ED were left unused, and thus overprescribing may be present and result in large quantities of unused opioids and possible misuse and dependency [1]. In Switzerland, an average of 80 treatment days per person is estimated for opioids [8] and daily use is strongly correlated to older age as well as increased morbidity. Data on the actual number of patients under long-term opioid therapy or possibly inadequate prescriptions are unknown for Switzerland – nor does our data analysis provide any estimates of the duration and adequacy of the opioid therapy of the patients under such therapy on presentation. Although little is yet known about risk factors, optimal clinical assessment and treatment approaches related to concurrent chronic pain and substance misuse [19], it can be concluded that there are correlations between morbidity and opioid-related death and daily dose [20, 21], as well as between risk of misuse and type of opioid medication [22, 23]. In particular, patients with an additional opioid prescription might be at risk for misuse or opioid-related complications, and additional opioids may not even be of benefit [23, 24].
Adolescents may be another group at risk of opioid misuse. It was found in a nationwide survey of young adults in Switzerland that the self-reported non-medical use of opioids was 6.1% in the cohort [9]. The authors investigated patients at risk and found a correlation between users of prescription drugs, and emotional and physical traumatic events. Of all patients below 25 years of age visiting the ED, 1.2% (95% CI 1.06–1.34%) received opioids during their visit.
Although the numbers of opioid prescriptions had not risen in this single-centre analysis, more specific data on the type and dosage of opioids, as well as the patients at risk for permanent non-medical use, are needed to assure good clinical pain therapy [25]. This is especially important, because for outpatients the trend towards less opioid consumption was not significant in our analysis. Instruments like the Prescription Opioid Misuse Index (POMI) [26], the Prescription Opioid Difficulties Scale (PODS) [27] or the Prescription Drug Use Questionnaire (PDUQ) [28] may be helpful for future investigations.
This analysis of the prevalence of opioid medication and incident opioid prescriptions at the ED may be a first step to improve quality of opioid prescription. Although prevalence remained stable and the incidence of prescriptions between 2013 and 2017 has decreased after adjustment for confounders, the results cannot be generalised, as they derive from a single centre and there were many missing values. Further research should include patients’ profiles, prescription details and longitudinal results.
The study received no specific funding. MM was partially funded by a grant from the Clinical Trials Unit. The funding organisations had no role in the design and conduct of the study; the collection, management, analysis, and interpretation of the data; the preparation, review, or approval of the manuscript; and decisions to submit the manuscript for publication.
MM received a research grant from the Gottfried and Julia Bangerter-Rhyner Foundation. WEH received speaker fees from the AO Foundation Zurich and research funding from Mundipharma Medical Basel. The other authors have nothing to disclose.
1 Cordell WH , Keene KK , Giles BK , Jones JB , Jones JH , Brizendine EJ . The high prevalence of pain in emergency medical care. Am J Emerg Med. 2002;20(3):165–9. doi:.https://doi.org/10.1053/ajem.2002.32643
2 Degenhardt L , Charlson F , Ferrari A , Santomauro D , Erskine H , Mantilla-Herrara A , et al.; GBD 2016 Alcohol and Drug Use Collaborators. The global burden of disease attributable to alcohol and drug use in 195 countries and territories, 1990-2016: a systematic analysis for the Global Burden of Disease Study 2016. Lancet Psychiatry. 2018;5(12):987–1012. doi:.https://doi.org/10.1016/S2215-0366(18)30337-7
3Opioid deaths in the US: Findings from the Global Burden of Disease Study [Internet]. Institute for Health Metrics and Evaluation-IHME; 2019 [cited 2019 Jun 19]. Available from: http://www.healthdata.org/infographic/state-us-health-findings-global-burden-disease-study-gbd
4 Weiner SG , Baker O , Bernson D , Schuur JD . One-Year Mortality of Patients After Emergency Department Treatment for Nonfatal Opioid Overdose. Ann Emerg Med. 2020;75(1):13–7. doi:.https://doi.org/orgt/10.1016/j.annemergmed.2019.04.020
5 Guy GP, Jr , Zhang K , Bohm MK , Losby J , Lewis B , Young R , et al. Vital Signs: Changes in Opioid Prescribing in the United States, 2006-2015. MMWR Morb Mortal Wkly Rep. 2017;66(26):697–704. doi:.https://doi.org/10.15585/mmwr.mm6626a4
6 Hughes A , Williams MR , Lipari RN , Bose J , Copello EAP , Kroutil LA . Prescription drug use and misuse in the United States: Results from the 2015 National Survey on Drug Use and Health. NSDUH Data Rev. 2016. Available from: https://www.samhsa.gov/data/sites/default/files/NSDUH-FFR2-2015/NSDUH-FFR2-2015.htm.
7World drug report 2018 [Internet]. United Nation Office of Drug and Crime: UNODC; 2019 [cited 2019 Jun 19]. Available from: https://www.unodc.org/wdr2018/prelaunch/WDR18_Booklet_2_GLOBAL.pdf
8 Ruchat D , Suter MR , Rodondi PY , Berna C . Consommation d’opioïdes entre 1985 et 2015 : chiffres suisses et mise en perspective internationale [Opioid consumption from 1985 to 2015 : The situation in Switzerland, with an international comparison]. Rev Med Suisse. 2018;14(612):1262–6.
9 Wertli MM , Reich O , Signorell A , Burgstaller JM , Steurer J , Held U . Changes over time in prescription practices of pain medications in Switzerland between 2006 and 2013: an analysis of insurance claims. BMC Health Serv Res. 2017;17(1):167. doi:.https://doi.org/10.1186/s12913-017-2086-6
10 Wertli MM , Held U , Signorell A , Steurer J , Blozik E , Burgstaller JM . Opioid Prescription in Switzerland: Appropriate Comedication use in Cancer and Noncancer Pain. Pain Physician. 2019;22(6):537–48.
11 Rougemont-Bücking A , Grazioli VS , Marmet S , Daeppen JB , Lemoine M , Gmel G , et al. Non-medical use of prescription drugs by young men: impact of potentially traumatic events and of social-environmental stressors. Eur J Psychotraumatol. 2018;9(1):1468706. doi:.https://doi.org/10.1080/20008198.2018.1468706
12 Meisel ZF , Lupulescu-Mann N , Charlesworth CJ , Kim H , Sun BC . Conversion to Persistent or High-Risk Opioid Use After a New Prescription From the Emergency Department: Evidence From Washington Medicaid Beneficiaries. Ann Emerg Med. 2019;74(5):611–21. doi:.https://doi.org/10.1016/j.annemergmed.2019.04.007
13 Exadaktylos AK , Hautz WE . Emergency Medicine in Switzerland. ICU Manag Pr. 2015;15.
14WHO Collaborating Centre for Drug Statistics Methodology. ATC/DDD index [Internet]. 2018 [cited 2019 May 16]. Available from: https://www.whocc.no/atc_ddd_index/
15University Hospital Bern. Inselspital. University Emergency Centre. Triage [Internet]. [cited 2019 Jun 19]. Available from: http://www.notfallzentrum.insel.ch/de/information-fuer-patienten/triage/
16Gmel G, Notari L, Gmel C. Suchtmonitoring Schweiz - Einnahme von psychoaktiven Medikamenten in der Schweiz im Jahr 2016. [Addiction Monitoring Switzerland - intake of psychoactive drugs in Switzerland in 2016]. Lausanne, Switzerland: Sucht Schweiz; 2018.
17 Axeen S , Seabury SA , Menchine M . Emergency Department Contribution to the Prescription Opioid Epidemic. Ann Emerg Med. 2018;71(6):659–667.e3. doi:.https://doi.org/10.1016/j.annemergmed.2017.12.007
18 Von Korff M , Saunders K , Thomas Ray G , Boudreau D , Campbell C , Merrill J , et al. De facto long-term opioid therapy for noncancer pain. Clin J Pain. 2008;24(6):521–7. doi:.https://doi.org/10.1097/AJP.0b013e318169d03b
19 Voon P , Karamouzian M , Kerr T . Chronic pain and opioid misuse: a review of reviews. Subst Abuse Treat Prev Policy. 2017;12(1):36. doi:.https://doi.org/10.1186/s13011-017-0120-7
20 Gomes T , Mamdani MM , Dhalla IA , Paterson JM , Juurlink DN . Opioid dose and drug-related mortality in patients with nonmalignant pain. Arch Intern Med. 2011;171(7):686–91. doi:.https://doi.org/10.1001/archinternmed.2011.117
21 Dunn KM , Saunders K , Rutter CM , Banta-Green CJ , Merill JO , Sullivan MD , et al. Overdose and prescribed opioids: Associations among chronic non-cancer pain patients. Arch Intern Med. 2010;152(2):85–92. doi:https://doi.org/10.1059/0003-4819-152-2-201001190-00006
22 Sullivan MD , Edlund MJ , Fan MY , Devries A , Brennan Braden J , Martin BC . Risks for possible and probable opioid misuse among recipients of chronic opioid therapy in commercial and medicaid insurance plans: The TROUP Study. Pain. 2010;150(2):332–9. doi:.https://doi.org/10.1016/j.pain.2010.05.020
23 Glanz JM , Binswanger IA , Shetterly SM , Narwaney KJ , Xu S . Association Between Opioid Dose Variability and Opioid Overdose Among Adults Prescribed Long-term Opioid Therapy. JAMA Netw Open. 2019;2(4):e192613. doi:.https://doi.org/10.1001/jamanetworkopen.2019.2613
24 Busse JW , Mahmood H , Maqbool B , Maqbool A , Zahran A , Alwosaibai A , et al. Characteristics of patients receiving long-term opioid therapy for chronic noncancer pain: a cross-sectional survey of patients attending the Pain Management Centre at Hamilton General Hospital, Hamilton, Ontario. CMAJ Open. 2015;3(3):E324–30. doi:.https://doi.org/10.9778/cmajo.20140126
25 Manchikanti L , Kaye AM , Knezevic NN , McAnally H , Slavin K , Trescot AM , et al. Responsible, Safe, and Effective Prescription of Opioids for Chronic Non-Cancer Pain: American Society of Interventional Pain Physicians (ASIPP) Guidelines. Pain Physician. 2017;20(2S):S3–92. doi:.https://doi.org/10.36076/ppj.2017.s92
26 Knisely JS , Wunsch MJ , Cropsey KL , Campbell ED . Prescription Opioid Misuse Index: a brief questionnaire to assess misuse. J Subst Abuse Treat. 2008;35(4):380–6. doi:.https://doi.org/10.1016/j.jsat.2008.02.001
27 Merrill JO , Von Korff M , Banta-Green CJ , Sullivan MD , Saunders KW , Campbell CI , et al. Prescribed opioid difficulties, depression and opioid dose among chronic opioid therapy patients. Gen Hosp Psychiatry. 2012;34(6):581–7. doi:.https://doi.org/10.1016/j.genhosppsych.2012.06.018
28 Banta-Green CJ , Merrill JO , Doyle SR , Boudreau DM , Calsyn DA . Measurement of opioid problems among chronic pain patients in a general medical population. Drug Alcohol Depend. 2009;104(1-2):43–9. doi:.https://doi.org/10.1016/j.drugalcdep.2009.03.022
The study received no specific funding. MM was partially funded by a grant from the Clinical Trials Unit. The funding organisations had no role in the design and conduct of the study; the collection, management, analysis, and interpretation of the data; the preparation, review, or approval of the manuscript; and decisions to submit the manuscript for publication.
MM received a research grant from the Gottfried and Julia Bangerter-Rhyner Foundation. WEH received speaker fees from the AO Foundation Zurich and research funding from Mundipharma Medical Basel. The other authors have nothing to disclose.