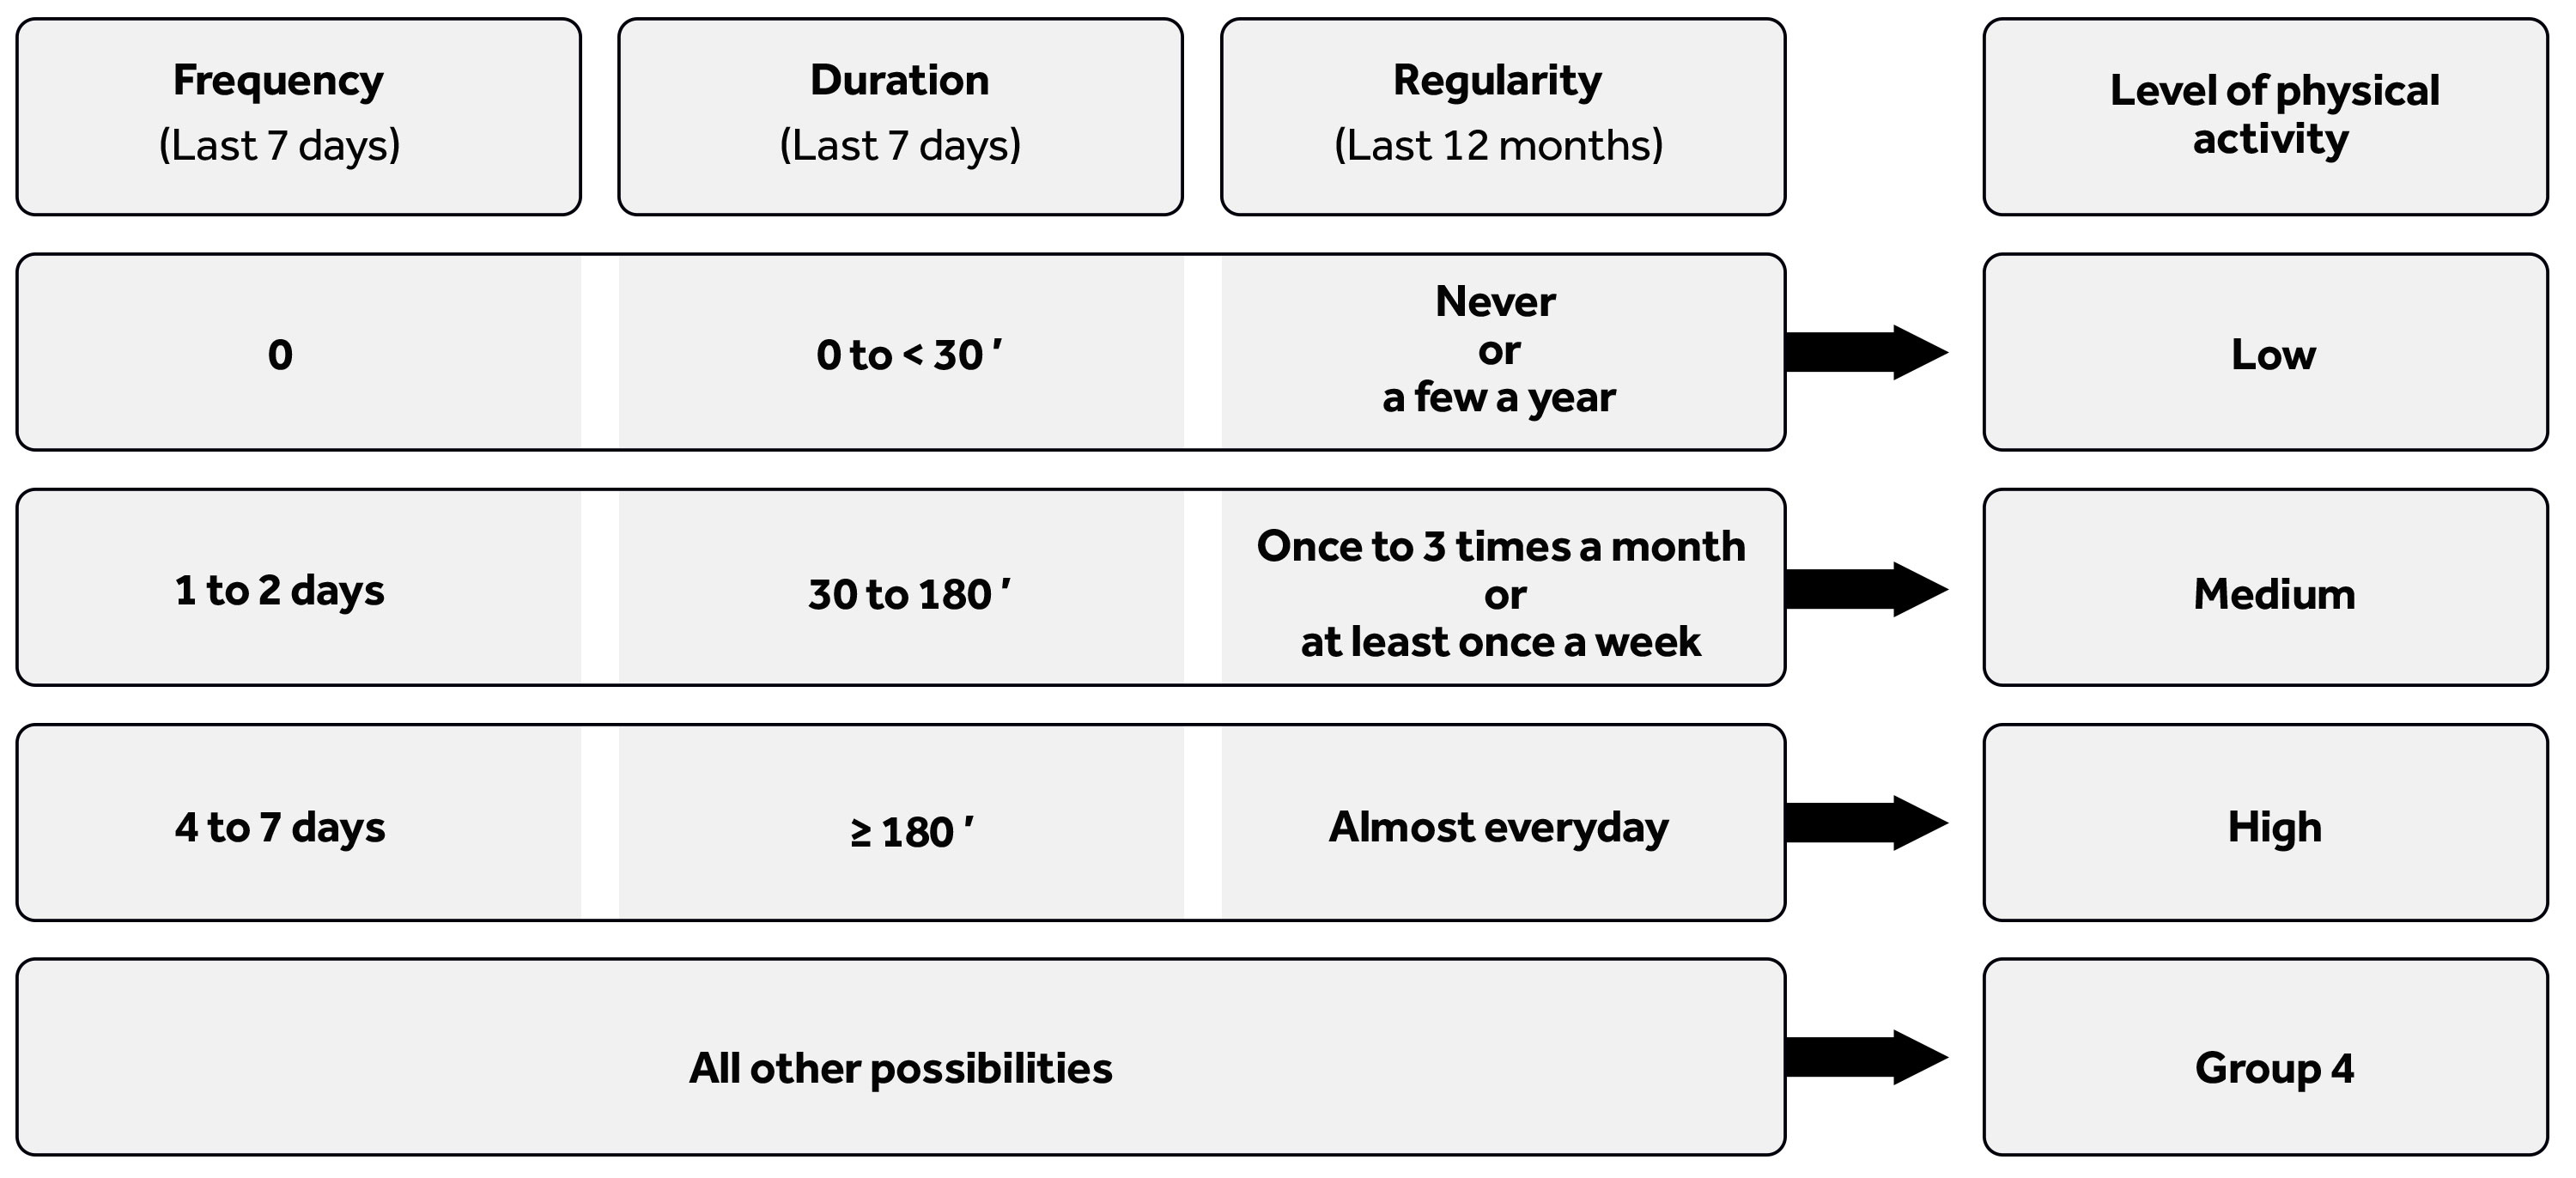
Figure 1 Partition of the respondents into four groups as a function of their answers to the three questions regarding frequency, duration and regularity of physical activity.
DOI: https://doi.org/10.4414/smw.2020.20197
Many adolescents and young adults experiment with substances, both legal and illegal [1]. Although most of these experimentations are brief and without important, long-time adverse consequences, they can sometimes have much more problematic outcomes, including developmental issues and addiction [2]. On the other hand, the practice of sport, or more generally of physical activity, at a high level implies, at least in the collective imagination, a healthy lifestyle. Therefore, there is a strong contrast between the usual experimentation during adolescence and the specific situation of people whose lifestyle involves a high level of physical activity. In this paper, we investigate the link between level of physical activity and substance use in a sample of Swiss male recruits. Our goals are to determine whether significant differences in substance use as a function of the level of physical activity exist, and whether the practice of physical activity at a high level can be considered a protective factor against substance use.
Adolescence is a period in life during which individuals seek independence from their parents and attain adult status. This transition implies a number of steps, such as moving from the education system to the job market, becoming sexually active, leaving the parental home and establishing lasting romantic partnerships [3]. Moreover, as a means of gaining independence and affirming their status as no-longer children, many adolescents also experiment with a wide range of behaviours, including incivility, risk taking and substance use, whether legal or illegal [4].
All these experimentations are considered normal within the context of adolescence, but if they are uncontrolled, they can have important adverse consequences in both the short and the long term. This is especially true for substance use, since the earlier a person is introduced to substance use, the more likely s/he is to develop addictions later on [5]. Without fully following the gateway theory [6, 7], we may say that adolescents commonly experiment with several substances, either successively or simultaneously, and specific patterns of substance initiation can be identified [8]. Moreover, the number of different substances (especially synthetic ones) and their availability seem to have increased during the last few decades [9], and the development of products such as energy drinks, alcopops (mixes of soda with strong alcohol), e-cigarettes and legal cannabis (cannabis without THC) is considered by experts to provide new ways of introducing young people to substance use [10, 11].
All individuals, whatever their level of physical activity, pass through the transition from childhood to adulthood, and they are therefore exposed to the possibility of substance use experimentation. However, people with a high level of physical activity, elite athletes for example, represent a specific case. Indeed, substance use can have a direct impact on their performances, either by diminishing them or by boosting them, perhaps illegally. In particular, as some substances, such as cannabis and cocaine, are considered doping products [12], competitive athletes should respect the legal frameworks governing their sports and totally avoid using these at all times [13, 14]. Moreover, substances can also be used by athletes to reduce the stress linked to competition and to help them recover after great exertion [15]. These factors might dissuade them from consuming substances or encourage them to use different substances to those consumed by their non-athlete peers. It should also be stressed that although substance use seems clearly in contradiction with the practice of sports at a high level, it is nevertheless known to be part of some situations related to sports, such as post-competition celebrations. Therefore, there is a strong interest in determining whether adolescent athletes follow the same pattern of experimental substance use as their non-athlete peers. This question extends beyond elite sport to all people with a high level of physical activity, including people with physically strenuous work, since the use of substances also interferes with their performance.
Overall, contradictory findings have been found regarding the prevalence and level of substance use among athletes. While tobacco and cannabis use were found to be less prevalent among adolescent athletes than their more sedentary peers [16, 17], other authors found a higher rate of alcohol abuse in college athletes than non-athletes [18]. A higher risk of excessive alcohol consumption has also been observed among sports-practising youths [19]. Moreover, the use of snus (a smokeless tobacco product) has been well documented among hockey players and other athletes [20–23], and many professional dancers are smokers or alcohol abusers [24].
In Switzerland, published data indicate that 46.7% of Swiss recruits participated in a vigorous sport or physical activity at least three times a week in 2011 [25], but there is no further indication of the regularity of this practice, nor of the length of each session. We also know that 34% of 15-24 year old males living in Switzerland consume tobacco, and that 78.9% drink alcohol. Finally, the life prevalences of cocaine, ecstasy and heroin consumption among 14-49 year old males living in Switzerland are 6.7%, 6.0% and 0.8% respectively [26]. However, even though substance users and people with a high level of physical activity are two population groups that have been the subjects of many studies, the general link between substance use and level of physical activity is much less discussed in the literature [16]. Moreover, studies have generally focused on only one substance, such as alcohol or tobacco. Therefore, we sought to fill this gap by taking a more comprehensive view and including many substances that are used specifically among people with a high level of physical activity, and by comparing them with their peers who have either a lower level of physical activity or almost no physical activity at all. We hypothesised that (1) young people with a high level of physical activity generally experiment with the same substances as other adolescents; (2) overall, the regularity of substance consumption decreases as the level of physical activity increases; and (3) for specific substances, the consumption reported by young people with high levels of physical activity can be higher than that of other people. Understanding both the differences in substance use according to the level of physical activity and the protective effect of sport and other physical activities will aid the development of efficient public health policies targeting athletes specifically.
Our data come from the baseline wave of the Cohort Study on Substance Use Risk Factors (C-SURF) [27], a Swiss survey conducted to study substance consumption among young males. The sample of the C-SURF study comprises male Swiss citizens recruited for mandatory military service in the Swiss army. In Switzerland, military service is mandatory for all male citizens, and a two-day recruitment period is organised each year. All young Swiss males who participated in this recruitment process during the period from August 23, 2010 to November 15, 2011 in three different recruitment centres, covering 21 of the 26 Swiss cantons, were invited to participate in the study (baseline). Two follow-ups were later held during the periods 2012–2014 and 2016–2018, but these data were not used in this article.
The sample includes recruits who agreed to answer the baseline questionnaire at home a few days after the recruitment. Of the 7556 individuals who signed the consent form, 5987 (79.2%) completed the questionnaire. The participants were asked questions on a variety of topics, including socio-professional status, family background, lifestyle, personality, substance consumption, use of the internet, gambling and gaming activities, sexuality, physical and mental health, and knowledge about other health-related aspects. Anonymity was guaranteed, with the contact details of the participants being managed independently of their answers.
More details about the design of the study and the data collection, including a flowchart of the participants, are available elsewhere [27] and on the C-SURF website (www.csurf.ch). The study protocol was approved by Lausanne University Hospital Clinical Research Ethics Committee (Protocol No. 15/07).
To address our research question, we split the sample according to the level of physical activity of the respondents in order to identify those participants with the highest levels of physical activity. However, the C-SURF questionnaires include no questions which directly identify such people. Therefore, we had to construct a synthetic variable from the answers to the following three questions:
The first two questions originate from the short version of the International Physical Activity Questionnaire (IPAQ) [28, 29], that makes no distinction between sports and job activities. Therefore, the answers might refer to sports activities, job activities, or both. For instance, a construction worker can score very high on these questions even if s/he never practises sports. It would have been possible to use the profession of the respondent to better discriminate between participants, but this information was not sufficiently precise in the C-SURF database.
When speaking of a high level of physical activity, it is implicit that this activity is long-term, so we had to ensure that we did not include in this group people who were practising intensively only at the time of their recruitment. Therefore, our definition of level of physical activity had to incorporate a measure of the regularity of this practice, hence the use of the third question above. We defined the meaningful groups based on both intensity and regularity of physical activity. By combining these two concepts, we were able to distinguish between people doing sports or physical activities regularly and at a high level, people doing physical activities regularly but at a much lower level, and people practising almost no physical activities. Formally, we defined four groups of respondents on the basis of the three questions above (fig. 1). The first three groups (low, medium and high levels of physical activity) are on the right of this figure and are well defined, but the fourth is much more composite. It comprises all respondents whose physical activity level was unclear or varied greatly over time. Therefore, we chose to exclude these people from consideration and performed substantive analyses on the first three groups only.
Figure 1 Partition of the respondents into four groups as a function of their answers to the three questions regarding frequency, duration and regularity of physical activity.
All substances considered in the C-SURF questionnaire were analysed, including alcohol, cannabis, tobacco (cigarettes, water pipes, cigars or cigarillos, snus, snuff, and chewing tobacco), other illicit drugs (e.g., hallucinogens, speed, cocaine, heroin), and prescription drugs used without a doctor’s prescription. For most substances, we had information on use (entire life and last 12 months), age at first use, and frequency and quantity of consumption. For an exhaustive list of all substances included in this study, please refer to tables 1 to 8 below.
For descriptive purposes, we also considered three socio-demographic variables, which we used to characterise the respondents in each group of physical activity level: age, Swiss language region (French or German) and education level.
The three activity groups were compared regarding all socio-demographic and substance use variables. We used the chi-squared test for categorical variables and a one-way ANOVA for continuous variables. When the test was significant at the 5% level, we performed post hoc analysis to compare the high physical activity group with each of the other groups. A Bonferroni adjustment was performed for these comparisons in order to avoid rejecting the null hypothesis too easily. Since we performed two post hoc comparisons for each substance, the p-values reported for post hoc comparisons should be compared to a Type I error of 2.5% instead of 5%. Stata 15.1 (Stata Corporation, College Station, TX, USA, http://www.stata.com) was used for all computations [30].
The design of the C-SURF study means that the sample comprised only male Swiss citizens from the French and German parts of the country. After deleting people with data missing for any of the variables used to define the groups of physical activity (n = 63), and without considering respondents assigned to the fourth group (n = 4274), we ended up with a sample of size n = 1650. Table 1 gives the main characteristics of this sample. At baseline, the mean age of the whole sample was 20.03 years (SD 1.28; range 18–26), 60.1% of the respondents were from the French-speaking part of the country, and 48.96% of them had mandatory education as their highest achieved education level. When we compare the high physical activity group with the two other groups, we see that its members are younger, that many more of them come from the German part of Switzerland, and that their education level is lower.
Table 1 Socio-demographic characteristics of the respondents belonging to the low, medium and high physical activity groups.
| Level of physical activity |
Overall
n = 1650 |
p-value | Post hoc test | |||||
|---|---|---|---|---|---|---|---|---|
|
Low (1)
n = 338 |
Medium (2)
n = 996 |
High (3)
n = 316 |
1 vs 3 | 2 vs 3 | ||||
| Age | 20.54 | 19.92 | 19.82 | 20.03 | <0.001 | <0.001 | 0.710 | |
| Swiss region | French-speaking | 81.07 | 61.04 | 34.49 | 60.06 | <0.001 | <0.001 | <0.001 |
| Education level | Mandatory | 38.02 | 50.15 | 56.96 | 48.96 | <0.001 | <0.001 | <0.001 |
| Vocational and other | 42.81 | 31.24 | 34.95 | 34.31 | ||||
| High school | 19.16 | 18.60 | 8.09 | 16.73 | ||||
Differences in alcohol consumption across the three levels of physical activity are very small (table 2). The main differences between the high group and the other two groups are regarding having consumed alcohol during the last year (more common in the high group than the low group, p <0.005, and less common in the high group than the medium group, p <0.001) and the usual number of days the respondents drink each week (no significant difference between high and low groups, but significantly fewer members of the high group usually drink twice a week compared to members of the medium group, p = 0.011). On the other hand, on days when alcohol is consumed, no significant difference is found between the three groups regarding the average number of drinks they take.
Table 2 Alcohol consumption by level of physical activity.
| Question | Category | Level of physical activity | Overall | p-value | Post hoc test | |||
|---|---|---|---|---|---|---|---|---|
| Low (1) | Medium (2) | High (3) | 1 vs 3 | 2 vs 3 | ||||
| Have you drunk at least one standard drink with alcohol? | Yes | 92.56 | 97.38 | 95.56 | 96.05 | <0.001 | 0.107 | 0.101 |
| At what age have you drunk at least one standard drink with alcohol? | 14.49 | 14.46 | 14.64 | 14.50 | 0.349 | |||
| How old were you when you were drunk for the first time? | 15.59 | 15.59 | 15.55 | 15.58 | 0.945 | |||
| Entire life: at least 12 drinks of any kind of alcohol? | Yes | 86.13 | 91.11 | 90.03 | 89.92 | 0.040 | 0.137 | 0.573 |
| Last 12 months: at least 1 drink of any kind of alcohol? | Yes | 82.74 | 95.87 | 90.45 | 92.15 | <0.001 | 0.005 | <0.001 |
| How many standard drinks do you drink on average on days when you drink alcohol? | 4.18 | 4.23 | 4.57 | 4.29 | 0.352 | |||
| How often do you usually drink alcohol? | Never | 3.61 | 0.84 | 3.17 | 1.78 | <0.001 | 0.480 | 0.011 |
| Almost 3 times a month | 31.77 | 29.94 | 31.34 | 30.54 | ||||
| Almost 2 days a week | 42.24 | 52.21 | 44.72 | 48.98 | ||||
| Almost 4 days a week | 13.36 | 12.92 | 15.49 | 13.48 | ||||
| At least 5 days a week | 9.03 | 4.10 | 5.28 | 5.22 | ||||
Overall, tobacco (whether smoked or not) had been tried by significantly fewer members of the high group than of the medium group (p = 0.008), but no difference was found between the high and low groups (table 3). However, important differences appear between the groups regarding the different tobacco products. Considering smoked products first, members of the high group are generally less likely to have consumed these than members of the other two groups, whatever the product (cigarette, water pipe, cigar, pipe). This is true for consumption of the product both ever and during the last 12 months, with the exception of pipes, where no significant differences were found, perhaps due to the small number of users. However, the age at first use did not differ significantly between the groups. Moreover, when the product is consumed, the frequency of consumption tends to be higher in the high group than in at least one of the other two groups, although these differences are not significant.
Table 3 Smoked tobacco consumption by level of physical activity.
| Question | Category | Level of physical activity | Overall | p-value | Post hoc test | |||||
|---|---|---|---|---|---|---|---|---|---|---|
| Low (1) | Medium (2) | High (3) | 1 vs 3 | 2 vs 3 | ||||||
| Have you ever consumed tobacco (smoked or not)? | Yes | 67.16 | 71.18 | 63.29 | 68.85 | 0.023 | 0.299 | 0.008 | ||
| Last 12 months: consumption of smoked tobacco at least once | Yes | 59.52 | 62.22 | 50.65 | 59.47 | 0.001 | 0.023 | <0.001 | ||
| Cigarettes | Entire life consumption | Yes | 64.50 | 62.44 | 53.18 | 61.09 | 0.005 | 0.003 | 0.004 | |
| Last 12 months consumption | Yes | 52.66 | 48.99 | 36.62 | 47.38 | <0.001 | <0.001 | <0.001 | ||
| Age at first use | 14.91 | 14.80 | 14.90 | 14.84 | 0.799 | |||||
| On a usual day, how many cigarettes do you smoke? | 11.27 | 6.81 | 9.41 | 8.21 | <0.001 | 0.078 | 0.001 | |||
| How many days a week? | 1 to 2 | 13.48 | 27.57 | 19.13 | 23.11 | <0.001 | 0.150 | 0.102 | ||
| 3 to 4 | 12.36 | 19.34 | 17.39 | 17.46 | ||||||
| 5 to 7 | 74.16 | 53.09 | 63.48 | 59.44 | ||||||
| Water pipe | Entire life consumption | Yes | 54.01 | 62.60 | 51.27 | 58.67 | <0.001 | 0.485 | <0.001 | |
| Age at first use | 15.76 | 15.47 | 15.35 | 15.50 | 0.050 | 0.066 | 1.000 | |||
| Last 12 months consumption | Yes | 33.79 | 44.55 | 35.02 | 40.64 | 0.001 | 0.757 | 0.005 | ||
| On a usual day, how many water pipes do you smoke? | 1.44 | 1.58 | 1.84 | 1.60 | 0.373 | |||||
| How many days a month? | 0 to 1 | 88.89 | 79.46 | 75.26 | 80.33 | 0.041 | 0.013 | 0.365 | ||
| At least 2 | 11.11 | 20.54 | 24.74 | 19.67 | ||||||
| Cigars | Entire life consumption | Yes | 41.25 | 48.49 | 30.79 | 43.61 | <0.001 | 0.006 | <0.001 | |
| Age at first use | 16.22 | 16.07 | 15.81 | 16.06 | 0.209 | |||||
| Last 12 months consumption | Yes | 23.15 | 31.38 | 18.10 | 27.15 | <0.001 | 0.112 | <0.001 | ||
| On a usual day, how many cigars/cigarillos do you smoke? | 1.69 | 1.76 | 1.84 | 1.76 | 0.038 | 0.033 | 0.346 | |||
| How many days a month? | 0 to 1 | 79.49 | 82.64 | 75.44 | 81.17 | 0.405 | ||||
| At least 2 | 20.51 | 17.36 | 24.56 | 18.83 | ||||||
| Pipe | Entire life consumption | Yes | 6.25 | 9.68 | 6.73 | 8.41 | 0.073 | |||
| Age at first use | 14.90 | 16.34 | 16.00 | 16.07 | 0.062 | |||||
| Last 12 months consumption | Yes | 2.38 | 4.34 | 2.88 | 3.66 | 0.184 | ||||
| On a usual day, how many pipes do you smoke? | 2.38 | 1.30 | 1.33 | 1.45 | <0.01 | 0.060 | 1.000 | |||
| How many days a month? | 0 to 1 | 62.50 | 79.07 | 66.67 | 75.00 | 0.502 | ||||
| At least 2 | 37.50 | 20.93 | 33.33 | 25.00 | ||||||
The picture is very different for smokeless tobacco products (table 4). Members of the high group are generally more likely to have consumed these products, especially during the last 12 months, and their frequency of consumption is systematically higher. In the case of snuff, they also started at a significantly lower age than members of the low and medium groups. However, it must be noted that these smokeless products are consumed much less overall than the smoked products. Snuff was used the most during the last 12 months (by 21.95% of the respondents), and chewing tobacco was used the least (0.43%).
Table 4 Smokeless tobacco consumption by level of physical activity.
| Question | Category | Level of physical activity | Overall | p-value | Post hoc test | ||||
|---|---|---|---|---|---|---|---|---|---|
| Low (1) | Medium (2) | High (3) | 1 vs 3 | 2 vs 3 | |||||
| Last 12 months: consumption of smoke- less tobacco at least once | Yes | 14.54 | 26.67 | 29.49 | 24.71 | <0.001 | <0.001 | 0.330 | |
| Chewing tobacco | Entire life consumption | Yes | 0.00 | 1.31 | 2.55 | 1.28 | 0.015 | 0.003 | 0.129 |
| Age at first use | - | 16.38 | 15.62 | 16.10 | 0.449 | ||||
| Last 12 months consumption | Yes | - | 0.30 | 1.27 | 0.43 | 0.028 | 0.038 | 0.040 | |
| On a usual day, how many portions of chewing tobacco do you take? | - | 1.00 | 2.00 | 1.57 | 0.093 | ||||
| How many days a month? | 0 to 1 | - | 100 | 25.00 | 57.14 | 0.047 | - | 0.047 | |
| At least 2 | - | 0.00 | 75.00 | 42.86 | |||||
| Snus | Entire life consumption | Yes | 9.50 | 14.36 | 20.45 | 14.52 | <0.001 | <0.001 | 0.010 |
| Age at first use | 16.44 | 16.84 | 16.56 | 16.71 | 0.388 | ||||
| Approximately how old were you when you started using snus on a daily basis? | 14.67 | 17.64 | 16.13 | 16.66 | 0.041 | 0.789 | 0.165 | ||
| Last 12 months consumption | Yes | 1.48 | 7.58 | 13.10 | 7.38 | <0.001 | <0.001 | 0.003 | |
| How many portions do you consume on a usual day? | 2.80 | 2.76 | 3.90 | 3.15 | 0.455 | ||||
| How many days a month? | <2 to 3 / month | 80.00 | 77.03 | 65.85 | 73.33 | 0.406 | |||
| At least 4 / per month | 20.00 | 22.97 | 34.15 | 26.67 | |||||
| Snuff | Entire life consumption | Yes | 33.23 | 43.61 | 40.32 | 40.85 | 0.004 | 0.061 | 0.304 |
| Age at first use | 15.22 | 15.27 | 14.49 | 15.11 | <0.001 | 0.012 | <0.001 | ||
| Approximately how old were you when you started using snuff on a daily basis? | 14.75 | 15.58 | 14.81 | 15.19 | <0.001 | <0.001 | <0.001 | ||
| Last 12 months consumption | Yes | 14.20 | 23.29 | 26.03 | 21.95 | <0.001 | <0.001 | 0.320 | |
| On a usual day, how many portions do you take? | 2.37 | 2.70 | 4.35 | 3.04 | 0.026 | 0.063 | 0.049 | ||
| How many days a month? | <2 to 3 / month | 87.50 | 88.31 | 70.37 | 84.17 | 0.001 | 0.026 | <0.001 | |
| At least 4 / month | 12.50 | 11.69 | 29.63 | 15.83 | |||||
Given the observed differences in prevalence between smoked and smokeless tobacco, we decided to examine the relationship between the two types of tobacco product and level of physical activity in more detail. Therefore, we separated our sample into four groups: respondents without any tobacco consumption during the last 12 months, respondents who had consumed only smoked tobacco, respondents who had consumed only smokeless products, and respondents who had consumed both types of products. Table 5 summarises our findings. The results show that although more of the high group have consumed smokeless tobacco, a highly significant proportion of this same group (22.26%) have consumed both smokeless and smoked tobacco. Therefore, we cannot really speak of substitution between the two types of tobacco product, and a large majority of tobacco consumers in the high group have used smoked tobacco.
Table 5 Relationship between smoked and smokeless tobacco consumption during the last 12 months.
| Category | Level of physical activity | Overall | p-value | Post hoc test | |||
|---|---|---|---|---|---|---|---|
| Low (1) | Medium (2) | High (3) | 1 vs 3 | 2 vs 3 | |||
| No tobacco consumption | 39.88 | 35.39 | 42.26 | 37.61 | <0.001 | <0.001 | <0.001 |
| Smoked tobacco only | 45.83 | 38.02 | 28.39 | 37.80 | |||
| Smokeless tobacco only | 0.60 | 2.43 | 7.10 | 2.94 | |||
| Both smoked and smokeless tobacco | 13.69 | 24.17 | 22.26 | 21.65 | |||
The percentage of respondents who have ever consumed cannabis (table 6) is significantly lower in the high group than in the low and medium groups (41.27% vs 50.15% and 51.76%). Consumption during the last 12 months follows the same trend (20.00% vs 32.05% and 36.08%). On the other hand, the age at first use of cannabis is similar in all three groups, with no significant differences found. Moreover, among cannabis consumers, the distribution of the frequency of consumption does not differ significantly between the high and the other two groups. Members of the high group consume cannabis mainly for fun (96.61%). This is similar to what is observed in the medium group, but it differs significantly from the low group, where 19.44% of respondents declare that consuming cannabis is part of their daily life.
Table 6 Cannabis consumption by level of physical activity.
| Question | Category | Level of physical activity | Overall | p-value | Post hoc test | |||
|---|---|---|---|---|---|---|---|---|
| Low (1) | Medium (2) | High (3) | 1 vs 3 | 2 vs 3 | ||||
| Have you ever smoked cannabis (hashish, marihuana, grass), more than one drag to try it out? | Yes | 50.15 | 51.76 | 41.27 | 49.42 | 0.005 | 0.023 | 0.001 |
| Age at first use | 15.77 | 15.88 | 15.89 | 15.86 | 0.719 | |||
| Last 12 months consumption | Yes | 32.05 | 36.08 | 20.00 | 32.18 | <0.001 | <0.001 | <0.001 |
| How often do you smoke cannabis? | Almost once per month | 38.89 | 60.72 | 53.97 | 55.47 | <0.001 | 0.198 | 0.565 |
| 2 to 4 times per month | 12.04 | 10.58 | 9.52 | 10.75 | ||||
| 2 to 3 times per week | 8.33 | 11.42 | 11.11 | 10.75 | ||||
| 4 to 5 times per week | 10.19 | 8.08 | 9.52 | 8.68 | ||||
| Almost every day | 30.56 | 9.19 | 15.87 | 14.34 | ||||
| Which of the following statements best fits your personal situation? | I smoke cannabis for fun, because it is something special. | 80.56 | 95.21 | 96.61 | 92.34 | <0.001 | 0.004 | 0.634 |
| I smoke cannabis out of habit, because it is part of my daily life. | 19.44 | 4.79 | 3.39 | 7.66 | ||||
| Consumption mode: joint of pure cannabis (without tobacco) | Never | 50.94 | 61.58 | 52.46 | 58.35 | 0.235 | ||
| Rarely | 35.85 | 25.99 | 31.15 | 28.60 | ||||
| Sometimes | 13.21 | 12.43 | 16.39 | 13.05 | ||||
| Consumption mode: joint of cannabis and tobacco | Never | 1.87 | 1.96 | 4.76 | 2.28 | 0.022 | 0.018 | 0.384 |
| Rarely | 8.41 | 21.01 | 22.22 | 18.60 | ||||
| Sometimes | 89.72 | 77.03 | 73.02 | 79.13 | ||||
| Consumption mode: water pipe (bong) with tobacco | Never | 65.38 | 72.32 | 69.35 | 70.58 | 0.014 | 0.273 | 0.004 |
| Rarely | 22.12 | 21.47 | 12.90 | 20.58 | ||||
| Sometimes | 12.50 | 6.21 | 17.74 | 8.85 | ||||
| Consumption mode: water pipe (bong) without tobacco | Never | 74.53 | 80.68 | 72.58 | 78.46 | 0.044 | 0.700 | 0.015 |
| Rarely | 15.09 | 14.49 | 12.90 | 14.42 | ||||
| Sometimes | 10.38 | 4.83 | 14.52 | 7.12 | ||||
| Consumption mode: mixed with food (cooking, tea, etc.) | Never | 50.94 | 63.20 | 55.56 | 59.81 | 0.197 | ||
| Rarely | 35.85 | 28.37 | 33.33 | 30.48 | ||||
| Sometimes | 13.21 | 8.43 | 11.11 | 9.71 | ||||
| Consumption mode: other ways | Never | 84.91 | 91.76 | 80.95 | 89.06 | 0.066 | ||
| Rarely | 10.38 | 5.68 | 12.70 | 7.49 | ||||
| Sometimes | 4.72 | 2.56 | 6.35 | 3.45 | ||||
Differences between the groups regarding the different modes of cannabis consumption are small, but members of the high group consume joints made of a mix of tobacco and cannabis (a process called mulling) less often than members of the low group, and they use a water pipe to consume cannabis, with or without added tobacco, more often.
Few respondents in our sample are consumers of hallucinogens, amphetamines, speed, ecstasy or other illicit substances. The overall proportions of respondents who have consumed such substances during their entire life and during the last 12 months are 10.07% and 6.42% respectively (table 7). More participants (5.76%) have ever consumed hallucinogens than any of the other substances, while amphetamines have been used the least. Regarding use in the last 12 months, ecstasy and MDMA were consumed by the most participants (3.52%), and amphetamines were used the least. Differences between the groups were found for most substances. All the substances were consumed more by members of the low group than by members of the others (except speed during the last 12 months), but no significant differences between the medium and high groups were found.
Table 7 Consumption of other illicit substances by level of physical activity.
| Question | Category | Level of physical activity | Overall | p-value | Post hoc test | ||||
|---|---|---|---|---|---|---|---|---|---|
| Low (1) | Medium (2) | High (3) | 1 vs 3 | 2 vs 3 | |||||
| Entire life | At least one consumption of an illegal substance | Yes | 15.09 | 8.94 | 8.23 | 10.07 | 0.003 | 0.007 | 0.695 |
| Hallucinogens, magic mushrooms, psilocybin, peyote, mescaline | Yes | 9.17 | 4.82 | 5.06 | 5.76 | 0.01 | 0.042 | 0.864 | |
| Other hallucinogens (LSD, PCP/Angel dust, 2-CB, 2-CI) | Yes | 8.31 | 3.12 | 2.85 | 4.13 | <0.001 | 0.003 | 0.808 | |
| Speed | Yes | 6.80 | 3.83 | 5.06 | 4.68 | 0.076 | |||
| Amphetamine, metamphetamine, amphetaminsulphate (e.g., dexedrine, benzedrine) | Yes | 6.21 | 2.52 | 2.22 | 3.22 | 0.002 | 0.012 | 0.764 | |
| Ecstasy, MDMA | Yes | 10.36 | 4.63 | 2.53 | 5.40 | <0.001 | <0.001 | 0.102 | |
| Last 12 months | At least one consumption of an illegal substance | Yes | 9.76 | 5.72 | 5.06 | 6.42 | 0.018 | 0.023 | 0.656 |
| Hallucinogens, magic mushrooms, psilocybin, peyote, mescaline | Yes | 5.04 | 2.41 | 2.22 | 2.91 | 0.032 | 0.055 | 0.843 | |
| Other hallucinogens (LSD, PCP/Angel dust, 2-CB, 2-CI) | Yes | 4.14 | 1.91 | 2.22 | 2.43 | 0.068 | |||
| Speed | Yes | 2.97 | 2.31 | 3.48 | 2.67 | 0.497 | |||
| Amphetamine, metamphetamine, amphetaminsulphate (e.g., dexedrine, benzedrine) | Yes | 3.55 | 1.51 | 0.95 | 1.82 | 0.023 | 0.026 | 0.458 | |
| Ecstasy, MDMA | Yes | 7.10 | 2.81 | 1.90 | 3.52 | <0.001 | 0.001 | 0.372 | |
The consumption of these substances is quite low in our sample (table 8). The overall proportion of participants who have consumed any of the substances during the last 12 months is 11.04%. The most used substance is strong painkillers (6.14% of the respondents), followed by sleeping pills and tranquilizers (3.28% each). No significant differences between the three groups were found regarding sleeping pills and strong painkillers. Regarding the other drugs, the use of antidepressants was more prevalent in the low group than in the high group, and the use of anabolic steroids was more prevalent in the high group than in the medium group.
Table 8 Consumption of prescribed drugs without medical prescription by level of physical activity.
| Question | Category | Level of physical activity | Overall | p-value | Post hoc test | |||
|---|---|---|---|---|---|---|---|---|
| Low (1) | Medium (2) | High (3) | 1 vs 3 | 2 vs 3 | ||||
| Last 12 months: at least one consumption of prescribed drugs without prescription | Yes | 12.13 | 10.25 | 12.38 | 11.04 | 0.446 | ||
| Sleeping pills | Yes | 5.03 | 2.71 | 3.17 | 3.28 | 0.117 | ||
| Tranquilizers | Yes | 5.92 | 2.81 | 1.90 | 3.28 | 0.007 | 0.009 | 0.376 |
| Strong painkillers | Yes | 6.53 | 5.73 | 7.01 | 6.14 | 0.674 | ||
| Stimulants and amphetamine | Yes | 3.55 | 1.31 | 1.90 | 1.88 | 0.032 | 0.199 | 0.440 |
| Antidepressants | Yes | 2.67 | 0.40 | 0.64 | 0.91 | 0.001 | 0.044 | 0.591 |
| Anabolic steroids | Yes | 1.19 | 0.50 | 2.56 | 1.04 | 0.007 | 0.197 | 0.001 |
In this study we examined the relationship between level of physical activity and substance consumption in young Swiss men. We hypothesised that (1) young people with a high level of physical activity generally experiment with the same substances as other adolescents; (2) overall, the regularity of substance consumption decreases as the level of physical activity increases; and (3) for specific substances, the consumption reported by young people with high levels of physical activity can be higher than that of other people.
Overall, these hypotheses are supported by our results, but with several nuances, especially regarding the first hypothesis. The prevalence of alcohol consumption does not differ between the high physical activity level group and the other two groups, and excessive alcohol consumption is observed in all groups. This is in line with the literature [17, 19]. However, this is not the case for smoked tobacco products, cannabis, other illicit drugs and prescribed drugs. Although a sizeable number of young adults doing physical activity at a high level experiment with these substances, fewer do so than among their less athletic peers. However, non-smoking tobacco products constitute an exception, since these substances have been tried at least once by more members of the high group than of the other two groups.
Concerning the second and third hypotheses, consumption in the high group of all substances, except alcohol and smokeless tobacco, during the last 12 months was overall lower than or equal to that in the low and medium groups. For alcohol, the level of consumption in the high group fell between that of the two other groups, while for smokeless tobacco the high group systematically consumed more than the other two groups. This last finding confirms the third hypothesis.
The consumption of substances affects all individuals, regardless of their level of physical activity. For instance, alcohol consumption is almost the same across the three groups. This contradicts the idea that people with a high level of physical activity, and especially elite athletes, avoid substance use. Thus, even the most athletic people might be at risk of addiction, and so they should receive particular attention in prevention policies. In the high group, the prevalence of consumption is very significant for some substances and modest for others. Consistent with the literature [14, 22], and especially with a study of 1,138 young German athletes [16], alcohol was the most consumed substance in the high group.
Regarding tobacco and cannabis, a statistically significant difference in lifetime prevalence of consumption between different levels of physical activity was found. Our findings confirm those of studies on young people in Greece [31], Germany [16] and the United States [32, 33]. Overall, the high group are less likely to consume smoked tobacco, but this is in part compensated by a higher level of consumption of smokeless tobacco products such as snuff and snus, as has also been found in previous studies [16, 21, 22]. This can be explained by awareness of the harmful nature of tobacco smoke on physical performance and on health in general [22], which could in turn explain the attractiveness of smokeless tobacco. However, these explanations are only partial, since most users of smokeless tobacco in the high group also consume smoked tobacco. The overall consumption level of other illicit substances and non-prescribed drugs is lower than for other substances, especially among the high group.
The main strengths of this study are that it is one of the first to specifically consider differences in substance use as a function of level of physical activity, that we included a large number of substances, and that we considered different consumption modes for tobacco and cannabis. However, a number of limitations must also be stressed. First of all, although the C-SURF study gives access to a very large sample, it concerns only male Swiss citizens. Moreover, even if the questionnaire was not answered during the recruitment, but at home a few days after, the military context, with its strict rules, could have influenced the way some people answered sensitive questions such as the ones related to substance use. Unfortunately, we do not have a way to measure the extent of this possible bias. Demographic characteristics were significantly different across the three levels of physical activity. Members of the high group were younger, had a lower level of education, and came mainly from the German part of the country. Therefore, the results are not fully generalisable, but this is not crucial, since our main objective was to compare the different physical activity level groups, not to obtain population prevalence figures. Indeed, as stated by Moore and colleagues [21], substance use can differ as a function of gender and the type of physical activity. This is in line with the findings of Henchoz and colleagues [34], who concluded that demographic characteristics can be considered determinants of physical activity in young people. Additional research is therefore required.
Detailed information regarding the sports and other physical activities practised was not available, so we had to rely on a combination of three different variables to define our physical activity level groups. Since the question regarding the regularity of physical activity during the last 12 months was also available in the two follow-ups of the C-SURF study, it would have been useful to have been able to incorporate it into the definitions of the groups in order to better identify people with high long-term physical activity levels, but the large amount of missing data in the two follow-ups meant we were not able to do so. Moreover, less than half of the recruits answered the baseline questionnaire, so selection bias is possible, although the design of our study, based on the comparison of three well-defined groups, limits this issue. In addition, item-level missing data were present in the database, so the final sample for this study was much smaller than the initial sample, and data from the two follow-ups could not be included. This decrease in the sample size is also due to our requirement for a very precise definition of the three physical activity level groups, but given the study objectives, it was essential to work with well-defined, homogeneous groups. Finally, the literature suggests that specific substance use behaviours could be related to specific sports, such as the consumption of snus among hockey players [22]. That could explain some results, but we were unable to investigate this further, since the sports practised by the respondents were not available in the C-SURF database.
Whatever their level of physical activity, adolescents and young adults are confronted with substances. Given the fact that adolescence is known as a period of experimentation, it is not surprising to see that the behaviour of people practising physical activity at a high level does not differ fundamentally from that of less active people. However, clear differences do appear when we look more specifically at the level of consumption and at the types of substances consumed. These differences call for a more specific approach towards substance consumption among athletes, and the creation of specific messages and campaigns directed at elite athletes and other people with high levels of physical activity. They must be reminded that many substances are prohibited, and that even those which are allowed (such as alcohol and tobacco) can negatively affect their performances in the short and the long term, as well as have possible consequences for their general health status.
We thank our colleagues Serguei Rouzinov and Kevin Emery for their input to this work. We would also like to acknowledge the principal investigator of the C-SURF study, Dr Gmel, as well as Dr Joseph Studer and Dr Mohamed Faouzi, for providing the C-SURF data and for their input.
The C-SURF study is conducted by the Lausanne University Hospital and the University of Zurich, and is financed by the Swiss National Science Foundation (grant numbers 33CSC0-122679 and 33CS30-139467). This publication benefited from the support of the Swiss National Centre of Competence in Research LIVES – Overcoming Vulnerability: Life Course Perspectives, which is financed by the Swiss National Science Foundation (grant number 51NF40-160590). The authors are grateful to the Swiss National Science Foundation for its financial assistance.
No potential conflicts of interest relevant to this article were reported.
1 Michaud P-A , Berchtold A , Jeannin A , Chossis I , Suris J-C . Secular trends in legal and illegal substance use among 16 to 20 year old adolescents in Switzerland. Swiss Med Wkly. 2006;136(19-20):318–26.
2 Whyte AJ , Torregrossa MM , Barker JM , Gourley SL . Editorial: Long-Term Consequences of Adolescent Drug Use: Evidence From Pre-clinical and Clinical Models. Front Behav Neurosci. 2018;12:83. doi:.https://doi.org/10.3389/fnbeh.2018.00083
3Levesque RJR, ed. Encyclopedia of Adolescence. 2nd edition. Cham, Switzerland: Springer International Publishing; 2018.
4 Miller PM , Plant M . Drinking, smoking, and illicit drug use among 15 and 16 year olds in the United Kingdom. BMJ. 1996;313(7054):394–7. doi:.https://doi.org/10.1136/bmj.313.7054.394
5 Odgers CL , Caspi A , Nagin DS , Piquero AR , Slutske WS , Milne BJ , et al. Is it important to prevent early exposure to drugs and alcohol among adolescents? Psychol Sci. 2008;19(10):1037–44. doi:.https://doi.org/10.1111/j.1467-9280.2008.02196.x
6 Kandel D . Stages in adolescent involvement in drug use. Science. 1975;190(4217):912–4. doi:.https://doi.org/10.1126/science.1188374
7Kandel DB, ed. Stages and pathways of drug involvement: Examining the gateway hypothesis. New York, US: Cambridge University Press; 2002.
8 Berchtold A , Akré C , Jeannin A , Michaud P-A , Suris J-C . First consumption ever of multiple substances: applying an expert-based taxonomy to a Swiss national sample of adolescents. Addict Behav. 2011;36(1-2):68–72. doi:.https://doi.org/10.1016/j.addbeh.2010.08.023
9United Nations Office on Drugs and Crime. World drug report. https://wdr.unodc.org/wdr2019/index.html, 2019. Accessed 05 August 2019.
10 Barrense-Dias Y , Berchtold A , Akre C , Surís J-C . Consuming energy drinks at the age of 14 predicted legal and illegal substance use at 16. Acta Paediatr. 2016;105(11):1361–8. doi:.https://doi.org/10.1111/apa.13543
11 McCabe SE , West BT , McCabe VV . Associations between early onset of E-cigarette use and cigarette smoking and other substance use among US adolescents: A national study. Nicotine Tob Res. 2018;20(8):923–30. doi:.https://doi.org/10.1093/ntr/ntx231
12World Anti-Doping Agency. Prohibited list. https://www.wada-ama.org/sites/ default/files/wada_2019_english_prohibited_list.pdf, 2019. Accessed 20 August 2019.
13 Striegel H , Ulrich R , Simon P . Randomized response estimates for doping and illicit drug use in elite athletes. Drug Alcohol Depend. 2010;106(2-3):230–2. doi:.https://doi.org/10.1016/j.drugalcdep.2009.07.026
14 Glick ID , Stillman MA , Reardon CL , Ritvo EC . Managing psychiatric issues in elite athletes. J Clin Psychiatry. 2012;73(5):640–4. doi:.https://doi.org/10.4088/JCP.11r07381
15 Morente-Sánchez J , Zabala M . Doping in sport: a review of elite athletes’ attitudes, beliefs, and knowledge. Sports Med. 2013;43(6):395–411. doi:.https://doi.org/10.1007/s40279-013-0037-x
16 Diehl K , Thiel A , Zipfel S , Mayer J , Schneider S . Substance use among elite adolescent athletes: findings from the GOAL Study. Scand J Med Sci Sports. 2014;24(1):250–8. doi:.https://doi.org/10.1111/j.1600-0838.2012.01472.x
17 Rainey CJ , McKeown RE , Sargent RG , Valois RF . Patterns of tobacco and alcohol use among sedentary, exercising, nonathletic, and athletic youth. J Sch Health. 1996;66(1):27–32. doi:.https://doi.org/10.1111/j.1746-1561.1996.tb06254.x
18 Nelson TF , Wechsler H . Alcohol and college athletes. Med Sci Sports Exerc. 2001;33(1):43–7. doi:.https://doi.org/10.1097/00005768-200101000-00008
19 Bélanger RE , Ohl F , Berchtold A , Akre C , Suris J-C . Social contexts of sports-practicing youths’ hazardous drinking. Swiss Med Wkly. 2012;142(0708):w13526. doi:.https://doi.org/10.4414/smw.2012.13526
20 Davis TC , Arnold C , Nandy I , Bocchini JA , Gottlieb A , George RB , et al. Tobacco use among male high school athletes. J Adolesc Health. 1997;21(2):97–101. doi:.https://doi.org/10.1016/S1054-139X(97)00032-3
21 Moore MJ , Werch CE . Sport and physical activity participation and substance use among adolescents. J Adolesc Health. 2005;36(6):486–93. doi:.https://doi.org/10.1016/j.jadohealth.2004.02.031
22 Henninger S , Fischer R , Cornuz J , Studer J , Gmel G . Physical activity and snus: is there a link? Int J Environ Res Public Health. 2015;12(7):7185–98. doi:.https://doi.org/10.3390/ijerph120707185
23 Zandonai T , Chiamulera C , Mancabelli A , Falconieri D , Diana M . A preliminary investigation on smokeless tobacco use and its cognitive effects among athletes. Front Pharmacol. 2018;9:216. doi:.https://doi.org/10.3389/fphar.2018.00216
24 Sekulic D , Peric M , Rodek J . Substance use and misuse among professional ballet dancers. Subst Use Misuse. 2010;45(9):1420–30. doi:.https://doi.org/10.3109/10826081003682198
25 Wyss T , Roos L , Studer F , Mäder U , Beuchat C , Staub K . Development of physical fitness performance in young Swiss men from 2006 to 2015. Scand J Med Sci Sports. 2019;29(4):586–96. doi:.https://doi.org/10.1111/sms.13376
26Swiss Statistics. Statistiques de la Santé 2019. Neuchâtel, Switzerland: Office fédéral de la statistique (OFS); 2019. Accessed 8 January 2020.
27 Gmel G , Akre C , Astudillo M , Bähler C , Baggio S , Bertholet N , et al. The Swiss cohort study on substance use risk factors – findings of two waves. Sucht. 2015;61(4):251–62. doi:.https://doi.org/10.1024/0939-5911.a000380
28 Craig CL , Marshall AL , Sjöström M , Bauman AE , Booth ML , Ainsworth BE , et al. International physical activity questionnaire: 12-country reliability and validity. Med Sci Sports Exerc. 2003;35(8):1381–95. doi:.https://doi.org/10.1249/01.MSS.0000078924.61453.FB
29 Gauthier AP , Lariviere M , Young N . Psychometric properties of the IPAQ: a validation study in a sample of northern Franco-Ontarians. J Phys Act Health. 2009;6(s1, Suppl 1):S54–60. doi:.https://doi.org/10.1123/jpah.6.s1.s54
30Stata. Stata Statistical Software: Release 15. College Station, TX: StataCorp LLC, 2017.
31 Papaioannou A , Karastogiannidou C , Theodorakis Y . Sport involvement, sport violence and health behaviours of Greek adolescents. Eur J Public Health. 2004;14(2):168–72. doi:.https://doi.org/10.1093/eurpub/14.2.168
32 Baumert PW, Jr , Henderson JM , Thompson NJ . Health risk behaviors of adolescent participants in organized sports. J Adolesc Health. 1998;22(6):460–5. doi:.https://doi.org/10.1016/S1054-139X(97)00242-5
33 Pate RR , Trost SG , Levin S , Dowda M . Sports participation and health-related behaviors among US youth. Arch Pediatr Adolesc Med. 2000;154(9):904–11. doi:.https://doi.org/10.1001/archpedi.154.9.904
34 Henchoz Y , Baggio S , N’Goran AA , Studer J , Deline S , Mohler-Kuo M , et al. Health impact of sport and exercise in emerging adult men: a prospective study. Qual Life Res. 2014;23(8):2225–34. doi:.https://doi.org/10.1007/s11136-014-0665-0
The C-SURF study is conducted by the Lausanne University Hospital and the University of Zurich, and is financed by the Swiss National Science Foundation (grant numbers 33CSC0-122679 and 33CS30-139467). This publication benefited from the support of the Swiss National Centre of Competence in Research LIVES – Overcoming Vulnerability: Life Course Perspectives, which is financed by the Swiss National Science Foundation (grant number 51NF40-160590). The authors are grateful to the Swiss National Science Foundation for its financial assistance.
No potential conflicts of interest relevant to this article were reported.