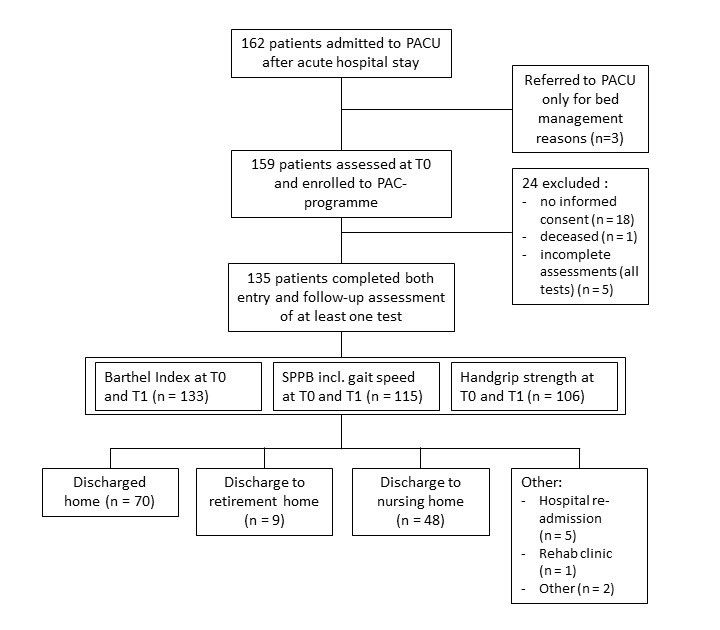
Figure 1 Flow diagram of study participation. PAC = post-acute care; PACU = post-acute care units; SPPB = Short Physical Performance Battery; T0 = time point of assessment at admission; T1 = time point of assessment at discharge
DOI: https://doi.org/10.4414/smw.2020.20198
The world's aging population is a major challenge to today's healthcare systems. This is especially true for Europe and the United States, where the population aged 65 and older is expected to at least double within the next four decades [1, 2]. Already today, every fourth patient treated in a Swiss hospital is 70 years or older [3]. With an increasing proportion of older inpatients and a continuing trend towards shorter lengths of stay in acute care [4], post-acute care (PAC) programmes seem to be of growing importance. They are most relevant for the care of frail older adults, who face a very high risk of functional decline and loss of autonomy in the face of acute illness or trauma [5, 6].
Before the introduction of diagnosis-related groups (DRG) in Switzerland in 2012, it was discussed that with case-based reimbursement, older patients might be discharged too early, while they still have ongoing care needs and a functional status worse than their prior baseline [7, 8]. Consequently, a Swiss federal law on PAC was introduced to bridge this potential gap between inpatient and outpatient care for older adult patients who do not otherwise qualify for specific rehabilitation. Today, there are several approaches to implementing PAC in Switzerland, one of them being a temporary stay at a nursing home [9].
Comparable programmes in Norway, the US and Taiwan were able to demonstrate significant improvements in functional status and activities of daily living (ADL) in older adult patients undergoing PAC after acute hospital care [6, 10–12]. Additional studies reported reduced mortality rates and lower risk of permanent institutionalisation [11, 13]. However, it remains unclear which patients benefit most from referral to PAC [14]. Furthermore, data on the different types of PAC approach in Switzerland are scarce. To our knowledge, no scientific data on the outcome of PAC in a nursing home setting in Switzerland have been reported so far.
The aim of our study was to investigate the effects of PAC in a nursing home on functional status in patients aged 60 years and older transferred from acute care. In addition, we investigated the influences of gender, age and frailty status (robust and pre-frail vs frail) on these outcomes to confirm the hypothesis that even frail and very old patients could benefit from such PAC programmes.
We conducted a prospective cohort study at four PAC wards (71 beds in total) located in three nursing homes in the city of Zurich, Switzerland. All patients aged 60 years and older admitted to these wards after acute hospitalisation between August and September 2016 were screened for inclusion. The patients were preselected by the referring medical staff according to the criteria shown in supplementary table S1 (appendix 1). Exclusion criteria were refusal of informed consent, death during PAC and incomplete data sets for all three functional outcomes (see below). Our study was approved by the local ethics committee of the Canton of Zurich (BASEC 2016-01069). All patients or proxies provided written informed consent.
The individual PAC programme was based on a detailed, comprehensive geriatric assessment (CGA) performed by an interdisciplinary team (nursing staff, physical and occupational therapists, staff physicians and social workers) at each PAC ward within the first week after admission. The CGA included, among other components, cognitive screening with the Mini-Mental State Examination (MMSE) [15] and a clock drawing test (CDT) [16]. A MMSE score of 25–30 points was considered normal, 19–24 points mild, 10–18 points moderate and below 9 points severe cognitive impairment. Mini Nutritional Assessment (MNA) was performed for malnutrition screening [17]. Physical function and mobility were assessed with the Short Physical Performance Battery (SPPB), which includes an assessment of gait speed, a five times chair rise test and a balance test [18, 19]. It results in scores between 0 and 12, where 10–12 points is considered normal, 7–9 points as at risk of increasing mobility impairment, and 6 points or lower as at high risk of mobility impairment and loss of independence. In addition, a standardised handgrip strength test (HGS) was performed. Three consecutive measurements were obtained for each hand using a Martin Vigorimeter (KLS Martin GmbH & Co.KG, Tuttlingen, Germany) and the best result of the dominant hand was recorded. Basic activities of daily living (ADL) were assessed with the Barthel Index (BI) [20]. Frailty status was determined using an adapted Fried frailty phenotype consisting of five domains (self-reported fatigue, unintentional weight loss, weakness, slowness and low activity level) [21]. Fried scores range from 0 to 5, where 0 indicates robustness, 1–2 individuals at risk (pre-frailty), and ≥3 frailty.
The PAC programme was supervised by a board-certified geriatrician and consisted of one-to-one training sessions with a physical therapist five times a week, occupational therapy during the first days and continued as needed, and activating nursing care (i.e. goal-directed instruction and training of ADL). A social worker discussed discharge options with the patients and their families and took care of discharge planning. Interdisciplinary team meetings took place every second week. The effective date of discharge was set individually based on the staff's evaluation, the needs of the patient and his or her social network, and the possibility and availability of a potential discharge location. The pre-determined maximum duration of stay at the PAC units was 10 weeks.
Primary outcomes were changes in BI, SPPB (including gait speed) and HGS over the time of stay. These measures were recorded shortly after admission and repeated within the last three days before discharge from PAC. We also recorded MMSE, CDT and MNA scores and frailty status as measured in the CGA.
In addition, anthropometric and demographic information, including age, gender, body mass index (BMI), length of stay (LOS), allocating acute care hospital and its medical specialty, location of discharge after PAC and level of formal education (according to the International Standard Classification of Education [ISCED]; higher education was defined as ISCED level 5–6, i.e., tertiary education), as well as prior living arrangement and use of at-home nursing services before hospital admission, was collected at baseline. Number of regularly prescribed drugs and ICD-10 coded medical diagnosis lists were also included in the data set. Two researchers (MT, TT) uniformly performed data collection from electronic health records at each site.
Differences between men and women were analysed using Student’s t-test for continuous variables and the χ2 (chi-square) test or Fisher’s exact test for categorical variables. In the text and tables, categorical variables are presented as n (%) whereas continuous variables are presented, in the corresponding unit of measurement, as mean (SD) or least-square mean (adjusted mean, LSM) (95% CI).
In the unadjusted analysis, differences in the functional tests (BI, SPPB, gait speed and HGS) between admission (T0) and discharge (T1) were analysed using paired Student’s t-tests. In the adjusted analysis, the multivariable linear models included an indicator variable for time (representing the change between T0 and T1) and were further adjusted for baseline age, gender, BMI, LOS, number of medications, MMSE score and living status prior to acute hospital care (alone vs not alone and prior use of at-home nursing services [with help vs without help]) for all functional test outcomes (BI, SPPB, gait speed, and HGS). These adjustment variables were selected either because they are the usual adjustments used in health-related observational research (age, gender, BMI, LOS) or based on clinical experience regarding potential influences (number of medications, MMSE score, living status prior to acute hospital care). In order to better visualise the extent of the changes, the percentage change, based on the value at admission (=100%), was also included in the presentation of the results.
Moreover, subgroup analysis by gender, age (<85 vs ≥85 years) and frailty status (robust/pre-frail vs frail) was performed for the changes in functional status between admission (T0) and discharge (T1) using the same multivariable-adjusted models as described above, except that the gender and age subgroup models were not adjusted for gender and age respectively. Significant differences in the changes in functional status between individual subgroups were identified by including an interaction term (subgroup × time) in the models. Since fulfilling the criteria for frailty was positively correlated with prior use of at-home nursing services (help vs without help), the subgroup analysis by frailty was performed without adjusting for prior use of at-home nursing services in the multivariable-adjusted model.
The model assumptions, including a linear relationship between the outcome and the explanatory variables, low correlation (Pearson) between the explanatory variables, normally distributed model residuals, and homoscedasticity of the residuals, were evaluated and found to be met sufficiently.
All p-values are two-sided, and a p-value of <0.05 was considered statistically significant. All calculations and analyses were performed using SAS 9.4 (SAS Institute Inc., Carey, USA) and R, version 3.3.6 (R Foundation for Statistical Computing, Vienna, Austria).
A total of 162 consecutive patients referred from acute care were admitted during the observation period. A flow diagram of the study participants is shown in figure 1. Our final sample included 135 patients with complete data sets for at least one out of the three functional outcomes.
Figure 1 Flow diagram of study participation. PAC = post-acute care; PACU = post-acute care units; SPPB = Short Physical Performance Battery; T0 = time point of assessment at admission; T1 = time point of assessment at discharge
Baseline characteristics of the total sample (n = 135) are presented in table 1. Mean age was 84.21 (SD 8.5) years and 86 (63.7%) of the 135 patients were female. Mean LOS in PAC was 31.7 (SD 16.2) days. Nearly half the referrals (n = 62, 45.9%) to PAC were from acute care medicine wards. Prior to acute hospital care, 86 (63.4%) patients lived at home alone, while 44 (31.4%) lived with a spouse or shared their household. Only eight individuals (5.9%) had higher education (ISCED 5–6). The mean MMSE score was 24.2 (SD 4.4) points, and 44 patients (34.1%) had a MMSE score below 24 points. Seventy-five patients (55.6%) were frail at admission according to the Fried phenotype, and another 31 (23%) individuals were pre-frail. After completion of PAC, 51.9% (n = 70) of patients returned home.
Table 1 Patient characteristics at admission to post-acute care.
|
Men
(n = 49) |
Women
(n = 86) |
Difference
(p-value) |
Total
(n = 135) |
||
|---|---|---|---|---|---|
| Age (years) | 82.5 (8.3) | 85.2 (8.5) | 0.09 | 84.2 (8.5) | |
| Patients ≥85 years, n (%) | 25 (51%) | 57 (66.3%) | 0.08 | 82 (60.7%) | |
| Body mass index (kg/m2) | 25.5 (5.8) | 25.1 (5.3) | 0.68 | 25.2 (5.5) | |
| Referring specialty, n (%) | Geriatrics | 6 (12.2%) | 11 (12.8%) | 17 (12.6%) | |
| Medicine | 22 (44.9%) | 40 (46.5%) | 62 (45.9%) | ||
| Surgery | 11 (22.4%) | 26 (30.2%) | 37 (27.4%) | ||
| Living alone prior to recent hospital stay, n (%) | 23 (46.9%) | 62 (72.9%) | 0.005 | 85 (63.4%) | |
| Living without at-home nursing services prior to recent hospital stay, n (%) | 34 (69.4%) | 50 (58.1%) | 0.03 | 84 (62.2%) | |
| Length of PAC stay (days) | 30.0 (14.1) | 32.7 (17.2) | 0.35 | 31.7 (16.2) | |
| Number of medications (n) | 8.65 (4.3) | 8.17 (3.7) | 0.49 | 8.35 (3.9) | |
| MMSE score (0–30) | 24.8 (4.1) | 23.9 (4.5) | 0.27 | 24.2 (4.4) | |
| Patients with MMSE score <24, n (%) | 14 (30.4%) | 30 (36.1%) | 0.64 | 44 (34.1%) | |
| MNA score (0–14) | 8.8 (2.7) | 8.7 (2.7) | 0.86 | 8.7 (2.7) | |
| Higher education (ISCED 5–6), n (%) | 7 (14.3%) | 1 (1.16%) | 0.001 | 8 (5.9%) | |
| Frail patients (Fried phenotype), n (%) | 25 (51.0%) | 50 (58.1%) | 0.52 | 75 (55.6%) | |
| Pre-frail patients (Fried phenotype), n (%) | 14 (28.6%) | 17 (19.8%) | 0.71 | 31 (23.0%) | |
| Barthel Index score (0–100) | 64.6 (18.0) | 60.8 (20.1) | 0.28 | 62.2(19.4) | |
| SPPB score (0–12) | 5.8 (2.8) | 4.9 (2.9) | 0.07 | 5.2 (2.9) | |
| Patients with SPPB score <7, n (%) | 31 (63.3%) | 56 (70.9%) | 0.08 | 87 (68.0%) | |
| Gait speed (m/s) | 0.60 (0.31) | 0.46 (0.28) | 0.01 | 0.51 (0.30) | |
| Handgrip strength (kPa) | 45.3 (14.3) | 36.4 (12.8) | < 0.001 | 39.7 (14.0) | |
ISCED = International Standard Classification of Education (higher education was defined as ISCED level 5–6 i.e. tertiary education); MMSE = Mini-Mental State Examination; MNA = Mini Nutritional Assessment; PAC = post-acute care; SPPB = Short Physical Performance Battery Data (n = 135) are crude means (SD) or n (%). Differences between men and women were assessed using Student’s t-test for continuous variables and a χ2 test or Fisher’s exact test for categorical variables. All p-values are two-sided; statistical significance was set at p <0.05.
In the adjusted analysis of the total sample (table 2) all functional parameters, except for HGS, improved significantly. We observed (LSM [95% CI] at admission vs discharge; % change; all p <0.001) a 10.6 point increase in BI (69.0 [65.0–72.9] vs 79.6 [75.6–83.6]; +15.4%), a 0.10 m/s increase in gait speed (0.55 [0.48–0.62] vs 0.65 [0.58–0.71] m/s; +18.2%) and a 1.3 point increase in SPPB score (5.5 [5.0–6.1] vs 6.9 [6.3–7.4]; +24%).
Table 2 Change in functional measures between admission to and discharge from post-acute care.
| Functional measures | Unadjusted analysis | Adjusted analysis | ||||||||||
|---|---|---|---|---|---|---|---|---|---|---|---|---|
| n |
Admission
LSM (95% CI) |
Discharge
LSM (95% CI) |
Δ
change |
%
change |
p-value | n |
Admission
LSM (95% CI) |
Discharge
LSM (95% CI) |
Δ
change |
% change | p-value | |
| Barthel Index score (0–100) | 134 | 62.2 (58.9, 65.4) |
72.7 (69.3, 76.1) |
10.5 (8.1, 12.9) |
16.9 | <0.001 | 127 | 69.0 (65.0, 72.9) |
79.6 (75.6, 83.6) |
10.6 (8.1, 13.1) |
15.4 | <0.001 |
| SPPB score (0–12) | 123 | 5.2 (4.7, 5.7) |
6.6 (6.1, 7.1) |
1.4 (1.0, 1.7) |
26.0 | <0.001 | 118 | 5.5 (5.0, 6.1) |
6.9 (6.3, 7.4) |
1.3 (1.0, 1.7) |
24.0 | <0.001 |
| Gait speed (m/s) |
118 | 0.51 (0.46, 0.56) |
0.62 (0.56, 0.67) |
0.10 (0.06, 0.15) |
19.6 | <0.001 | 113 | 0.55 (0.48, 0.62) |
0.65 (0.58, 0.71) |
0.10 (0.06, 0.14) |
18.2 | <0.001 |
| Handgrip strength (kPa) |
118 | 39.7 (37.3, 42.1) |
40.1 (37.5, 42.8) |
0.5 (−1.6, 2.6) |
1.1 | 0.67 | 114 | 42.4 (39.2, 45.6) |
43.3 (40.0, 46.5) |
0.9 (−1.2, 2.9) |
2.0 | 0.42 |
CI = confidence interval; LSM = least-squares mean; SPPB = Short Physical Performance Battery
In the adjusted analyses of the age and gender subgroups (see supplementary table S2 in appendix 1), the changes in BI, SPPB, gait speed, and HGS from admission to discharge between men and women or between patients <85 years and ≥85 years were similar, and the differences not statistically significant. Only for gait speed did the difference in the changes from admission to discharge between the age subgroups approach (p = 0.07), (though it still did not reach) statistical significance. Notably, women had significantly lower absolute HGS (mean [95% CI] at admission and discharge; 38.8 [35.4–42.2] and 39.7 [36.7–42.7] kPa) compared to men (47.1 [42.7–51.5] and 47.8 [42.7–53.0] kPa), p <0.001.
In the adjusted analysis of the frailty status subgroups (table 3), the changes in BI, SPPB, and gait speed from admission to discharge were similar, and the differences between the subgroups were not statistically significant (robust/pre-frail patients vs frail patients). Notably, frail individuals showed improvements (LSM [95% CI] of change between admission and discharge; % change) in BI (+9.3 [6.1– 12.5] points; +14.1%), SPPB (+1.4 [0.8–1.9] points; +25%), and gait speed (+0.12 [0.06–0.17] m/s; +24%) that were comparable to those of their robust/pre-frail counterparts (BI +11.5 [7.6–15.4] points, +16.5%; SPPB +1.3 [0.9–1.7] points, +19.7%; gait speed +0.08 [0.01–0.14] m/s, +12.7%). Furthermore, frail patients showed significant improvements in HGS (+2.7 [0.2–5.2] kPa, +6.7%, p = 0.03), while there was no significant change in HGS for robust/pre-frail individuals. Improvement in HGS over time were therefore significantly greater among frail compared to robust/pre-frail patients (pinteraction = 0.05).
Table 3 Changes in functional measures in frail vs robust/pre-frail participants undergoing post-acute care.
| Functional measures | n |
Admission to PAC
LSM (95% CI) |
Discharge from PAC
LSM (95% CI) |
Δ change | % Change | ptime * | |
|---|---|---|---|---|---|---|---|
| Barthel index score (0–100) | 133 | ||||||
| Robust/pre-frail | 58 | 69.8 (66.0, 73.7) | 81.3 (77.4, 85.3) | 11.5 (7.6, 15.4) | 16.5 | <0.001 | |
| Frail | 75 | 65.9 (60.2, 71.7) | 75.3 (69.2, 81.3) | 9.3 (6.1, 12.5) | 14.1 | <0.001 | |
| pinteraction † | 0.39 | ||||||
| SPPB score (0–12) | 115 | ||||||
| Robust/pre-frail | 48 | 6.6 (6.0, 7.2) | 7.9 (7.3, 8.6) | 1.3 (0.9, 1.7) | 19.7 | <0.001 | |
| Frail | 65 | 5.0 (4.2, 5.7) | 6.3 (5.6, 7.1) | 1.4 (0.8, 1.9) | 28.0 | <0.001 | |
| pinteraction * | 0.87 | ||||||
| Gait speed (m/s) | 115 | ||||||
| Robust/pre-frail | 48 | 0.63 (0.55, 0.72) | 0.71 (0.64, 0.78) | 0.08 (0.01, 0.14) | 12.7 | 0.02 | |
| Frail | 65 | 0.50 (0.41, 0.60) | 0.62 (0.53, 0.72) | 0.12 (0.06, 0.17) | 24.0 | <0.001 | |
| pinteraction * | 0.36 | ||||||
| Handgrip strength (kPa) | 106 | ||||||
| Robust/pre-frail | 42 | 43.9 (40.3, 47.4) | 42.1 (38.6, 45.7) | −1.7 (−5.1, 1.6) | −3.9 | 0.31 | |
| Frail | 63 | 40.2 (35.9, 44.6) | 43.0 (38.5, 47.4) | 2.7 (0.2, 5.2) | 6.7 | 0.03 | |
| pinteraction * | 0.05 | ||||||
BMI = body mass index; CI = confidence interval; LSM = least-squares (i.e., adjusted) mean; PAC = post-acute care; SPPB = Short Physical Performance Battery Data (n = 135) are LSM (95% CI) of multivariable-adjusted linear regression models by subgroups of frailty. Models included an indicator variable for time and were further adjusted for baseline age, gender, BMI, length of stay, number of medications, Mini-Mental State Examination test score, and living alone prior to acute care (alone vs not alone). The p-values are two-sided. Statistical significance was set at p <0.05. * p-value for the difference in LSM between admission and discharge from PAC † p-value for the interaction between individual subgroups and the change in LSM
Our investigation of PAC under real-life conditions in a nursing home environment suggests that it provides statistically and clinically significant functional improvements in geriatric patients transferred from acute care. Notably, improvements in basic ADL and physical performance were independent of the patients’ frailty status and age.
Comparisons of our findings to other similar works are limited, as the exact definition, setting and average duration of PAC programmes vary considerably between healthcare systems and countries in the published literature.
Prior studies on PAC and geriatric post-acute rehabilitation have reported ADL improvements between 17 and 26% as measured on the BI [11, 12, 22]. For example, Lee et al. investigated 251 patients with a mean age of 82.7 (±5.5) years over a mean LOS of 32.3 (±14.3) days in a community hospital setting in Taiwan and observed an increase in BI score from 42.2 (±34.1) to 64.9 (±33.7) points (p <0.001) [12]. Chen et al. selected 96 Taiwanese veterans (mean age 85.7 ± 5.1 years) for a PAC intervention and reported a change in BI score from 46.3 (±29.0) to 71.9 (±31.3) points over a four-week period [11]. Finally, Seematter-Bagnoud et al. investigated the outcomes of 2754 participants aged 65 years and older undergoing geriatric post-acute care at Lausanne University Hospital, Switzerland, where the patients’ BI scores improved from 62.2 (±20.3) to 79.5 (±18.9) points over a mean LOS of 22 (15–30) days [22]. Instead of using absolute gain, they defined achieving functional recovery as an improvement in BI score of at least 30% of the maximum possible improvement from the score at admission (e.g., BI at admission = 70 points, maximum achievable BI = 100 points, so BI at discharge = 80 points indicates a 33% improvement, i.e., functional recovery achieved) in order to avoid a ceiling effect. Other groups have considered an absolute gain of ≥20 points on the BI as indicating functional recovery in geriatric patients [23].
In this context, our finding of an average BI improvement of 10.6 points over an average PAC stay of approximately four weeks seems moderate. However, the participants in the above-mentioned studies did not achieve higher final scores than the individuals in our study (mean BI at discharge was 79.6 points in our study and was, e.g., 79.5 points in the Seematter-Bagnoud paper) [22]. However, in the latter study, 70% of patients achieved functional recovery at geriatric rehabilitation wards in a tertiary hospital, whereas in our study in a nursing home setting only 47.4% (n = 63) of patients achieved functional recovery. Nevertheless, our findings are comparable with a retrospective analysis conducted at Spanish “convalescence units”, a setting that appears more similar to Swiss nursing homes. This analysis observed functional improvement (defined as a ≥1 item ADL improvement) in 47% of participants over a median LOS of 35 days [24].
The mean increase in SPPB sum score in our adjusted model was 1.3 points. In the literature, the minimally clinically important difference (MCID) of the SPPB sum score is considered to be between 0.3 and 0.8 points, and a change of between 0.4 and 1.5 points is regarded as a substantial improvement [25, 26]. Consequently, the reported changes in SPPB score in our study would be considered clinically important. Furthermore, our results on physical performance as measured by the SPPB are in line with a recent randomised-controlled trial conducted by a Spanish group, which found a mean increase in the SPPB sum-score of 1 point after a six-week multicomponent intervention for frail older individuals [27].
Regarding gait speed, the current literature considers an increment of 0.1 to 0.2 m/s the MCID [25, 26, 28, 29]. Therefore, we consider the improvements described in our study sample to be substantial and relevant.
It is notable that over 50% of our study population was considered frail, which illustrates the high vulnerability of this population. However, the benefits of PAC appeared to be independent of frailty status. Frail individuals’ improvements in BI, SPPB and gait speed were comparable to those of their robust counterparts. As mentioned above, the frail subgroup also showed a statistically significant increase in HGS. In contrast to a recent review by Roberts et al., who argue that frail patients require unique rehabilitation programmes, our results suggest that PAC had a positive effect independent of frailty status [30].
Our study has several strengths. The reported outcomes were assessed under real-life conditions in consecutive patients undergoing PAC in three nursing homes. The great variability of health and functional status in old age is reflected by the heterogeneity of our patients. Such variability is usually not represented by a more discreetly chosen study population. Furthermore, we collected our data prospectively using a standardised CGA, which included a uniform frailty screening with the Fried phenotype. To the best of our knowledge, our study is the first to report outcomes of PAC at designated wards in nursing homes in the German-speaking part of Switzerland.
Our study also has limitations. First, our assessments were not performed by independent assessors and the PAC programme was not rigorously standardised in general, but adapted to the individual needs and wants of each participant. Hence, the content and intensity of the different therapy sessions depended on the patient’s cooperation and capabilities. Furthermore, due to the lack of a matching patient group in a different setting or the resources to create a control setting ourselves, we were not able to include a control group not undergoing PAC to assess natural improvement over time versus improvements related to PAC. In addition, given the moderate sample size of our study, the statistical power for detecting a significant subgroup effect is limited. Finally, due to preselection by admission triage, individuals with progressed dementia where excluded, so this study doesn’t provide information about the effects of PAC in severely cognitively impaired patients.
In summary, our study found significant and clinically relevant improvements in functional status for geriatric patients transferred from acute care to PAC. Further research in this field, namely randomised, controlled trials with larger samples and independent assessment teams and which extend to long-term outcomes, for example at 12 months after completion of PAC, are needed.
Table S1 Admission criteria* for post-acute care units.
| Return home within 10 weeks seems possible and is aimed for by the patient. In addition, an increase in self-dependence by activating care and therapy sessions appears likely. | ||
| The patient’s momentary need for care and assistance exceeds the possibilities of his or her social network and at-home nursing services. | ||
| Declaration of intent: the patient agrees to actively participate in the rehabilitation programme and work towards the discharge goal. | ||
| Patients meeting the following criteria were not admitted to PAC: | ||
| Established diagnosis of dementia (including typification) | ||
| Patient in need of assistance in everyday life on a regular basis for at least 6 months | ||
| Delirium has been excluded | ||
| Patients with special care and treatment needs: | ||
| Tracheostomised/ventilated patients | ||
| Carriers of multiresistant bacteria or communicable diseases | ||
| Severe obesity (body weight >150 kilograms) | ||
| Peritoneal dialysis | ||
| Patients in need of intravenous drip or medicaments | ||
* from admission criteria as defined by the City of Zurich’s Nursing Homes, 2016
Table S2 Changes in functional measures in men vs women, and participants <85 vs ≥85 years undergoing post-acute care.
| Functional measures | n |
At admission to PAC
LSM (95% CI) |
At discharge from PAC
LSM (95% CI) |
Δ change | ptime * | |
|---|---|---|---|---|---|---|
| Barthel index score (0–100) | 133 | |||||
| Men | 49 | 66.6 (61.3, 72.0) | 77.3 (72.3, 82.3) | 10.7 (6.5, 14.8) | <0.001 | |
| Women | 84 | 67.2 (62.8, 71.6) | 77.8 (73.3, 82.4) | 10.7 (7.5, 13.8) | <0.001 | |
| pinteraction † | 0.98 | |||||
| <85 years | 52 | 65.2 (59.6, 70.8) | 75.8 (69.5, 82.0) | 10.6 (6.5, 14.7) | <0.001 | |
| ≥85 years | 81 | 69.4 (64.5, 74.3) | 80.1 (75.5, 84.7) | 10.7 (7.6, 13.8) | <0.001 | |
| pinteraction † | 0.98 | |||||
| SPPB score (0–12) | 115 | |||||
| Men | 41 | 5.9 (5.2, 6.6) | 7.2 (6.5, 7.9) | 1.3 (0.6, 2.0) | 0.0002 | |
| Women | 74 | 5.2 (4.6, 5.9) | 6.6 (5.9, 7.3) | 1.4 (1.0, 1.8) | <0.001 | |
| pinteraction † | 0.99 | |||||
| <85 years | 46 | 5.8 (5.0, 6.7) | 7.5 (6.6, 8.4) | 1.7 (1.0, 2.3) | <0.001 | |
| ≥85 years | 69 | 5.1 (4.5, 5.8) | 6.3 (5.65, 7.0) | 1.1 (0.7, 1.6) | <0.001 | |
| pinteraction † | 0.21 | |||||
| Gait speed (m/s) | 115 | |||||
| Men | 41 | 0.63 (0.53, 0.74) | 0.70 (0.60, 0.80) | 0.07 (−0.00, 0.14) | 0.07 | |
| Women | 74 | 0.49 (0.41, 0.57) | 0.61 (0.54, 0.68) | 0.12 (0.06, 0.17) | <0.001 | |
| pinteraction † | 0.43 | |||||
| <85 years | 46 | 0.57 (0.47, 0.68) | 0.73 (0.62, 0.85) | 0.16 (0.09, 0.23) | <0.001 | |
| ≥85 years | 69 | 0.51 (0.43, 0.59) | 0.58 (0.51, 0.65) | 0.07 (0.02, 0.13) | 0.01 | |
| pinteraction † | 0.07 | |||||
| Hand grip strength (kPa) | 106 | |||||
| Men | 35 | 47.1 (42.7, 51.5) | 47.8 (42.7, 53.0) | 0.7 (−3.8, 5.2) | 0.75 | |
| Women | 71 | 38.8 (35.4, 42.2) | 39.7 (36.7, 42.7) | 0.9 (−1.1, 3.0) | 0.38 | |
| pinteraction † | 0.83 | |||||
| <85 years | 40 | 45.2 (39.9, 50.4) | 45.3 (39.8, 50.8) | 0.2 (−3.8, 4.1) | 0.94 | |
| ≥85 years | 66 | 38.9 (35.3, 42.4) | 40.4 (37.2, 43.5) | 1.5 (−0.6, 3.6) | 0.17 | |
| pinteraction † | 0.56 | |||||
BMI = body mass index; CI = confidence interval; LSM = least-squares (i.e., adjusted) mean; PAC = post-acute care; SPPB = Short Physical Performance Battery Data (n = 135) are LSM (95% CI) of multivariable-adjusted linear regression models by subgroups of age and gender. Models included an indicator variable for time and were adjusted for baseline age (except in age subgroups), gender (except in gender subgroups), BMI, length of stay, number of medications, Mini-Mental State Examination test score, and living status prior to acute care (alone vs not alone and with vs without prior use of at-home nursing services). P values are two-sided. Statistical significance was set at p <0.05. * p-value for the difference in LSM between admission and discharge to PAC † p-value for the interaction between individual subgroups and the change in LSM
We would like to thank all the staff members at the involved nursing homes for their untiring enthusiasm for this study and the very important work they are doing every day.
No financial support and no other potential conflict of interest relevant to this article was reported.
1Population Reference Bureau. America’s Aging Population. Washington, DC: Population Reference Bureau; 2011.
2Ageing Working Group of the Economic Policy Committee and European Commission’s Directorate-General for Economic and Financial Affairs. The 2018 Ageing Report., Luxembourg: Publications Office of the European Union; 2017.
3Bundesamt für Statistik. Medizinische Statistik der Krankenhäuser 2014 – Standardtabellen. Neuchâtel: Bundesamt für Statistik; 2016. p. 60.
4Gächter T, Leu A, Elger B. 365 Tage SwissDRG: Anreize, Instrumente, Wirkungen. 2013.
5 Theou O , Squires E , Mallery K , Lee JS , Fay S , Goldstein J , et al. What do we know about frailty in the acute care setting? A scoping review. BMC Geriatr. 2018;18(1):139. doi:.https://doi.org/10.1186/s12877-018-0823-2
6 Abrahamsen JF , Haugland C , Nilsen RM , Ranhoff AH . Three Different Outcomes in Older Community-dwelling Patients Receiving Intermediate Care in Nursing Home after Acute Hospitalization. J Nutr Health Aging. 2016;20(4):446–52. doi:.https://doi.org/10.1007/s12603-015-0592-y
7 Busato A , von Below G . The implementation of DRG-based hospital reimbursement in Switzerland: A population-based perspective. Health Res Policy Syst. 2010;8(1):31. doi:.https://doi.org/10.1186/1478-4505-8-31
8 Koné I , Zimmermann B , Wangmo T , Richner S , Weber M , Elger B . Hospital discharge of patients with ongoing care needs: a cross-sectional study using data from a city hospital under SwissDRG. Swiss Med Wkly. 2018;148:w14575.
9Bundesamt für Gesundheit. Kennzahlen der Schweizer Pflegeheime 2016, BAG, ed. Bern: Schweizerische Eidgenossenschaft; 2016.
10 Young J , Green J , Forster A , Small N , Lowson K , Bogle S , et al. Postacute care for older people in community hospitals: a multicenter randomized, controlled trial. J Am Geriatr Soc. 2007;55(12):1995–2002. doi:.https://doi.org/10.1111/j.1532-5415.2007.01456.x
11 Chen LK , Chen YM , Hwang SJ , Peng LN , Lin MH , Lee WJ , et al.; Longitudinal Older Veterans Study Group. Effectiveness of community hospital-based post-acute care on functional recovery and 12-month mortality in older patients: a prospective cohort study. Ann Med. 2010;42(8):630–6. doi:.https://doi.org/10.3109/07853890.2010.521763
12 Lee WJ , Peng LN , Cheng YY , Liu CY , Chen LK , Yu HC . Effectiveness of short-term interdisciplinary intervention on postacute patients in Taiwan. J Am Med Dir Assoc. 2011;12(1):29–32. doi:.https://doi.org/10.1016/j.jamda.2010.01.002
13 Bachmann S , Finger C , Huss A , Egger M , Stuck AE , Clough-Gorr KM . Inpatient rehabilitation specifically designed for geriatric patients: systematic review and meta-analysis of randomised controlled trials. BMJ. 2010;340(apr20 2):c1718. doi:.https://doi.org/10.1136/bmj.c1718
14 Singh I , Gallacher J , Davis K , Johansen A , Eeles E , Hubbard RE . Predictors of adverse outcomes on an acute geriatric rehabilitation ward. Age Ageing. 2012;41(2):242–6. doi:.https://doi.org/10.1093/ageing/afr179
15 Folstein MF , Folstein SE , McHugh PR . “Mini-mental state”. A practical method for grading the cognitive state of patients for the clinician. J Psychiatr Res. 1975;12(3):189–98. doi:.https://doi.org/10.1016/0022-3956(75)90026-6
16 Thalmann B , Spiegel R , Monsch AU . Dementia Screening in General Practice: Optimised Scoring for the Clock Drawing Test. Brain Aging. 2002;2(2):36–43.
17 Rubenstein LZ , Harker JO , Salvà A , Guigoz Y , Vellas B . Screening for undernutrition in geriatric practice: developing the short-form mini-nutritional assessment (MNA-SF). J Gerontol A Biol Sci Med Sci. 2001;56(6):M366–72. doi:.https://doi.org/10.1093/gerona/56.6.M366
18 Guralnik JM , Simonsick EM , Ferrucci L , Glynn RJ , Berkman LF , Blazer DG , et al. A short physical performance battery assessing lower extremity function: association with self-reported disability and prediction of mortality and nursing home admission. J Gerontol. 1994;49(2):M85–94. doi:.https://doi.org/10.1093/geronj/49.2.M85
19 Guralnik JM , Ferrucci L , Pieper CF , Leveille SG , Markides KS , Ostir GV , et al. Lower extremity function and subsequent disability: consistency across studies, predictive models, and value of gait speed alone compared with the short physical performance battery. J Gerontol A Biol Sci Med Sci. 2000;55(4):M221–31. doi:.https://doi.org/10.1093/gerona/55.4.M221
20 Mahoney FI , Barthel DW . Functional Evaluation: The Barthel Index. Md State Med J. 1965;14:61–5.
21 Fried LP , Tangen CM , Walston J , Newman AB , Hirsch C , Gottdiener J , et al.; Cardiovascular Health Study Collaborative Research Group. Frailty in older adults: evidence for a phenotype. J Gerontol A Biol Sci Med Sci. 2001;56(3):M146–56. doi:.https://doi.org/10.1093/gerona/56.3.M146
22 Seematter-Bagnoud L , Lécureux E , Rochat S , Monod S , Lenoble-Hoskovec C , Büla CJ . Predictors of functional recovery in patients admitted to geriatric postacute rehabilitation. Arch Phys Med Rehabil. 2013;94(12):2373–80. doi:.https://doi.org/10.1016/j.apmr.2013.06.024
23 Baztán JJ , González M , Morales C , Vázquez E , Morón N , Forcano S , et al. Variables asociadas a la recuperación funcional y la institucionalización al alta en ancianos ingresados en una unidad geriátrica de media estancia [Variables associated with functional recovery and post-discharge institutionalization of elderly cared in an average stay geriatric unit]. Rev Clin Esp. 2004;204(11):574–82. Article in Spanish. doi:.https://doi.org/10.1016/S0014-2565(04)71550-7
24 Salvà A , Roqué M , Vallès E , Bustins M , Bullich I , Sanchez P . Prognostic factors of functional status improvement in individuals admitted to convalescence care units. Eur Geriatr Med. 2015;6(4):341–7. doi:.https://doi.org/10.1016/j.eurger.2014.11.012
25 Perera S , Mody SH , Woodman RC , Studenski SA . Meaningful change and responsiveness in common physical performance measures in older adults. J Am Geriatr Soc. 2006;54(5):743–9. doi:.https://doi.org/10.1111/j.1532-5415.2006.00701.x
26 Kwon S , Perera S , Pahor M , Katula JA , King AC , Groessl EJ , et al. What is a meaningful change in physical performance? Findings from a clinical trial in older adults (the LIFE-P study). J Nutr Health Aging. 2009;13(6):538–44. doi:.https://doi.org/10.1007/s12603-009-0104-z
27 Abizanda P , López MD , García VP , Estrella JD , da Silva González Á , Vilardell NB , et al. Effects of an Oral Nutritional Supplementation Plus Physical Exercise Intervention on the Physical Function, Nutritional Status, and Quality of Life in Frail Institutionalized Older Adults: The ACTIVNES Study. J Am Med Dir Assoc. 2015;16(5):439.e9–16. doi:.https://doi.org/10.1016/j.jamda.2015.02.005
28 Bohannon RW , Glenney SS . Minimal clinically important difference for change in comfortable gait speed of adults with pathology: a systematic review. J Eval Clin Pract. 2014;20(4):295–300. doi:.https://doi.org/10.1111/jep.12158
29 Peel NM , Navanathan S , Hubbard RE . Gait speed as a predictor of outcomes in post-acute transitional care for older people. Geriatr Gerontol Int. 2014;14(4):906–10. doi:.https://doi.org/10.1111/ggi.12191
30 Roberts PS , Goud M , Aronow HU , Riggs RV . Frailty in a Post-Acute Care Population: A Scoping Review. PM R. 2018;10(11):1211–20. doi:.https://doi.org/10.1016/j.pmrj.2018.03.009
No financial support and no other potential conflict of interest relevant to this article was reported.