Identifying cancer driver genes from functional genomics screens
DOI: https://doi.org/10.4414/smw.2020.20195
Trupti
Togarab, Sanket
Desaiab, Rohit
Mishraa, Prachi
Terwadkara, Manoj
Ramtekea, Malika
Ranjana, Dhananjay
Kawlea, Bikram
Sahooa, Ankita
Pala, Pawan
Upadhyayab, Amit
Duttab
a
Integrated Genomics Laboratory, Advanced Centre for Treatment, Research and Education in Cancer, Tata Memorial Centre, Navi Mumbai, India
bTraining School Complex, Homi Bhabha National Institute, Anushakti Nagar, Mumbai, India
Summary
With the emerging advances made in genomics and functional genomics approaches, there is a critical and growing unmet need to integrate plural datasets in order to identify driver genes in cancer. An integrative approach, with the convergence of multiple types of genetic evidence, can limit false positives through a posterior filtering strategy and reduce the need for multiple hypothesis testing to identify true cancer vulnerabilities. We performed a pooled shRNA screen against 906 human genes in the oral cancer cell line AW13516 in triplicate. The genes that were depleted in the screen were integrated with copy number alteration and gene expression data and ranked based on ROAST analysis, using an integrative scoring system, DepRanker, to compute a Rank Impact Score (RIS) for each gene. The RIS-based ranking of candidate driver genes was used to identify the putative oncogenes AURKB and TK1 as essential for oral cancer cell proliferation. We validated the findings, showing that shRNA mediated genetic knockdown of TK1 or pharmacological inhibition of AURKB by AZD-1152 HQPA in AW13516 cells could significantly impede their proliferation. Next we analysed alterations in AURKB and TK1 genes in head and neck cancer and their association with prognosis using data on 528 patients obtained from TCGA. Patients harbouring alterations in AURKB and TK1 genes were associated with poor survival. To summarise, we present DepRanker as a simple yet robust package with no third-party dependencies for the identification of potential driver genes from a pooled shRNA functional genomic screen by integrating results from RNAi screens with gene expression and copy number data. Using DepRanker, we identify AURKB and TK1 as potential therapeutic targets in oral cancer. DepRanker is in the public domain and available for download at http://www.actrec.gov.in/pi-webpages/AmitDutt/DepRanker/DepRanker.html.
Abbreviations:
-
AURKB
-
aurora kinase B
- CR
-
copy number alteration rank
- DepRanker
-
dependency ranker
- DR
-
depletion rank
- FC
-
fold change
- GR
-
gene expression rank
- GUI
-
graphic user interface
- MOI
-
multiplicity of infection
- RIS
-
Rank Impact Score
- RNAi
-
RNA interference
- RR
-
ROAST rank
- TCGA
-
The Cancer Genome Atlas
-
TK1
-
thymidine kinase 1
- W
-
weight
Introduction
Cancer is a disease defined by several genetic alterations, such as mutations, gene expression changes and copy number changes, in addition to epigenomic alterations [1]. While most of the alterations are passenger alterations with no significant effect on cellular phenotype, cancer cells are dependent on a few driver genes for the constitutive activation of the signalling pathways which aid cellular proliferation, a phenomenon described as oncogene addiction [2]. Targeting oncogenic-dependent genes has resulted in success, as demonstrated in several cancer types [3, 4]. Often, the discovery or identification of a cancer-associated driver oncogene based on a genomics approach requires screening for significant genetic alterations using stringent statistical methods, followed by functional validation. On the other hand, a complementary functional genomics approach using RNAi or CRISPR effectively uses this structural knowledge of the cancer genome to define the functional consequences of the alterations in an unbiased manner, and may be performed in a pooled or arrayed format [5]. Methods which perform genome-wide RNAi screens on human cancer cell lines using a pooled human shRNA library as experimental models offer a powerful methodology for the identification of those genes essential for the survival of the cells. These efforts provide a new opportunity to fundamentally alter the extent to which we are able to understand and validate molecules that, when targeted, lead to therapeutic benefits in cancer patients.
Typically, a pooled RNAi screen analysis involves a quality assessment and normalisation of the data, followed by differential shRNA/sgRNA representation. The differential analysis is performed either by custom scripts or by packages like edgeR [6]. The “tags” (shRNA) are ranked according to their differential effects among classes of samples, and are further organised into a ranked list of genes by packages like RIGER [7], RSA [8], ROAST [9], camera [10] and others. Moreover, there are specialised algorithms like DEMETER2 [11] which measure the on/off-target effect and also estimate gene-dependency by deriving ‘essentiality scores’ from the RNAi experiments. The genes obtained from these experiments may be further validated, either by performing specific knock-down experiments or by extended secondary screens.
An alternative approach used to define dependency from pooled screen experiments is the integration of genomic data with the gene essentiality results. A classic example of this approach is the cancer dependency map [12], which integrates genomic features such as expression, copy number and mutation information with the gene dependencies obtained from screens performed on cancer cell lines representing various tumour types. Few computational methods incorporate such genomic features when predicting driver or essential genes for pooled RNAi screen experiments [13]. Building on this integrative approach, we have developed a gene ranking or scoring method, DepRanker, which incorporates other genomic datasets like gene expression and copy number information of the same cell line to prioritise genes from pooled screen results for their essentiality. DepRanker consists of two modules that can be executed using a single, user-friendly GUI. Module I analyses the pooled screen data to calculate the depletion of the tags and prioritise the genes. Module II integrates the results obtained from Module I with the genome-wide datasets to compute the Rank Impact Score (RIS) for individual genes.
We performed a functional kinome screen using pooled shRNA, comprised of 5419 constructs targeting 906 human kinases in AW13516 cells, in two independent screens. The genes depleted in the screen were integrated with copy number alteration data and gene expression data for the AW13516 cells using DepRanker, allowing us to identify AURKB and TK1 as potential therapeutic targets in oral cancer.
Materials and methods
Cell lines and cell culture
Indian patient-derived head and neck cancer cell lines – AW13516 cells and other cells used in the study, namely 293FT, HCT116 and SiHa cells – were maintained in Dulbecco’s Modified Eagle Medium (Gibco) supplemented with 10% FBS (Gibco) and 1% Penicillin-Streptomycin solution (Sigma). Cells were grown at 37°C in a 5% CO2 incubator. Cells were treated with Mycoplasma elimination kit (EZKill solution, Himedia) prior to use.
Lentivirus production and transduction in HNSCC cell line
Lentivirus comprised of 5419 pZIP-SFFV pooled shRNA constructs (8.1 Kb) targeting 906 human kinases were obtained from TransOMIC Technologies, USA. For the pooled shRNA screen, 18 million AW13516 cells were seeded in T-150 flasks at 60-70% confluency. Lentivirus was transduced at an MOI of 0.3 in the presence of 8 µg/ml Polybrene (Sigma) at 1000-fold representation of each shRNA in the screen. Cells were grown at 37°C for 16 hours post virus addition, and the medium was replaced. Cells were selected in the presence of 1 µg/ml puromycin (Sigma). Half the cells were harvested within 3-4 days after selection and this sample was termed the day 0 (control) sample. The remaining cells were further expanded and maintained at 37°C, and collected as test samples at the day 10 and day 20 time points.
PCR amplification of shRNA and barcode sequencing by NGS
Genomic DNA was extracted from the day 0, day 10 and day 20 samples of the AW13516 cells using a QIAamp DNA blood kit (Qiagen). DNA concentration estimation was done using a Nanodrop 2000c spectrophotometer (Thermo Fischer Scientific). Instructions provided in the TransOmics manual for performing PCR for shRNA amplification were followed, with some modifications. To provide a 1000-fold representation of shRNA, 36 µg of genomic DNA was used to amplify the shRNA cassette as per the calculation, and primary PCR was performed (sequence information in supplementary table S1 in appendix 1) as follows: 10 µl of 5X HF buffer, 1.5 µl of each of the forward and reverse primary PCR primers at concentrations of 10 µM, 1 µl of 10 mM dNTP mix, 5% DMSO, 3 mM MgCl2, 0.5 µl of Phusion High-Fidelity Polymerase Enzyme (Thermo Fischer Scientific) and 850 ng of genomic DNA in a total reaction volume of 50 µl. Primary PCR was performed at thermocycler conditions: 98°C for 5 min, 25 cycles of 95°C for 30 sec, 57°C for 30 sec and 72°C for 30 sec, and a final extension at 72°C for 5 min. The PCR product was separated on 1.5% agarose gel to visualise an amplicon of 406 bp. Next, the primary PCR product was pooled and purified using Nucleospin Gel and a PCR clean-up kit (Macherey-Nagel) and quantified using the Nanodrop 2000c spectrophotometer. 2 µg of purified primary PCR was used for setting up nested secondary PCR (primer sequence information in supplementary (table S1) with indexed reverse primers that add a unique barcode sequence to each sample to facilitate sample pooling during NGS sequencing. The secondary PCR reaction mixture was comprised of 10 µl of 5X HF buffer, 1.5 µl of each of the forward and indexed reverse secondary PCR primers at concentrations of 10 µM, 1 µl of 10 mM dNTP mix, 5% DMSO, 0.5 µl of Phusion High-Fidelity Polymerase Enzyme (Thermo Fischer Scientific) and 500 ng of primary PCR product in a total reaction volume of 50 µl. Secondary PCR was performed at thermocycler conditions: 98°C for 5 min, 15 cycles of 94°C for 30 sec, 52°C for 30 sec and 72°C at 30 sec, and a final extension at 72°C for 5 min. The secondary PCR product was separated on 1.5% agarose gel to visualise a band of 408 bp. It was then pooled and subjected to purification using Agencourt Ampure XP beads (NEB) and quantitated using a Qubit Fluorometer (Thermo Fischer Scientific). About 8-20 pM of purified secondary PCR product (indexed library) was loaded on an Illumina HiSeq 2500 platform and 50 bp single-end sequencing was done.
Data analysis of pooled shRNA using the edgeR pipeline
Raw data was obtained as fastq files and further processed using the edgeR package [6] for analysis of pooled shRNA data. Counts per sample were obtained for each shRNA by mapping reads with the kinase shRNA sequence library. For screen 1 data, shRNA with control sample (day 0) counts less than 1000 were excluded, since the experiment was performed at 1000-fold representation. For screens 2 and 3, a cut-off of 100 shRNA in the control sample (day 0) was used for further analysis. Data normalisation was performed within and across the control and test samples. The screen data was analysed using the classical method of two group comparisons. Statistical analysis was done to estimate the significance of the observed changes in shRNA abundance. The edgeR package provided a list of depleted shRNAs by calculating the log fold change (logFC). Based on these results, the top enriched and depleted shRNAs from the screen were identified and further converted to a gene-level ranking using the gene set analysis tool ‘ROAST’ [9]. Kinases represented by at least two shRNAs were considered for further analysis. A list of the kinases that were depleted in cells at day 20 compared to day 0 was obtained. Data from screens 1, 2 and 3 were not considered as data in triplicate because the screen 1 data output was enormous and captured existing shRNA uniformly, whereas the screen 2 and screen 3 data outputs were comparatively lower, suggesting that some of the shRNAs were not captured (table 1). Therefore, the screen 2 and screen 3 data were used as replicates. Hence, the combined results of screen 2 and screen 3 are referred to as screen 2 data hereafter.
DepRanker assigned impact score for the identification of potential kinases using genomic alteration data
To further prioritise the candidate kinases obtained from the RNAi screen analysis, we developed a scoring method named DepRanker (Dependency Ranker). DepRanker calculates a Rank Impact Score (RIS) for the individual kinases, which are derived from the kinome screen, by integrating gene expression and copy number data from the same sample. The RIS is derived using the following equation:
RIS (Kinase A) = DR (Kinase A) + RR (Kinase A) + GR (Kinase A) + CR (Kinase A)
(where DR = depletion rank, RR = ROAST rank, GR = gene expression rank and CR = copy number alteration rank).
We used a mean-rank method to calculate the scores for each feature as described below. The DR is derived by converting the logFC values obtained from the edgeR depletion analysis into rankings. The kinase showing the highest depletion in the screen is assigned the highest rank and the one showing the lowest depletion is assigned a rank of ‘1’. The RR is based on the ranking given by the ROAST algorithm, in which those genes which are represented by at least three shRNAs are considered, and the kinases are sorted based on their p-value. The gene which is least prioritised by ROAST is given a rank of ‘1’ and the most prioritised gene is assigned the highest rank. To calculate GR and CR, gene expression and copy number alteration data for all the kinases showing significant depletion in the pooled screen analysis is extracted for the relevant cell line, AW13516 cells in this analysis (as described previously [14]). The log transformed FPKM gene expression levels were extracted for this subset of kinases (all those showing significant depletion in the pooled screen), and the kinase showing the lowest gene expression was assigned a rank of 1 while the gene with the highest expression was assigned the highest rank. Similar rankings were assigned to the copy number levels for individual kinases from the AW13516 cells in order to derive CR. All four scores (DR, RR, GR, CR) were added together to compute the RIS. This scoring approach enabled us to identify potential kinases with biological roles from the list. To combine the results obtained from two screens performed on the same cell line, we converted the RIS for an individual kinase into a weight (range between 0 and 1) based on its relevance in a particular screen.
Furthermore, to combine the results from both screens, we assigned a weighting to each of the kinases by considering their RIS for both screens. The weights were calculated using the formula W = (RIS for kinase A) / (sum of RIS for all the kinases). The results from both screens were combined and sorted based on the assigned weightings. In the case of kinases with overlap in both screens, the kinase with the higher weight was retained.
Implementation of DepRanker and graphical user interface
This scoring system is implemented as a python-based package. DepRanker takes the output from edgeR analysis of pooled shRNA screens and the results provided by ROAST, along with gene expression data and copy number variation data for individual genes belonging to the cell line, and outputs the list of candidate kinases with their Rank Impact Scores. The package is available at http://www.actrec.gov.in/pi-webpages/AmitDutt/DepRanker/DepRanker.html, along with complete installation instructions and a user manual. The GUI was designed using the Tkinter python package. A detailed user manual for the GUI is available. The GUI provides two modules for analysis. The first module is the pooled shRNA screen analysis module, which takes in the fastq, hairpin and sample information file to perform the depletion analysis. The depletion analysis can be performed using either a generalised linear model (GLM) or an exact-test based method. The users are advised to refer to the screen analysis manual of Zuber et al. (http://bioinf.wehi.edu.au/shRNAseq/pooledScreenAnalysis.pdf) for guidance on selecting a suitable method for their screen data analysis. Internally, the GUI calls the Bioconductor packages edgeR and ROAST to perform the depletion analysis and the gene prioritisation respectively. The results from this module (edgeR toptags result and ROAST result file), along with the copy number and gene expression data for the cell line analysed, should be provided to the DepRanker module. This module provides the rank-based scores for the individual kinases identified from the pooled screen. The DepRanker GUI package is freely available for download.
Survival analysis of HNSCC datasets
Genomic alteration data from TCGA provisional HNSCC datasets from cBioPortal [15], consisting of 528 samples with gene expression, copy number and mutation information, was assessed. Kaplan-Meier survival plots were generated for patients with alterations in AURKB and TK1 genes.
Real time PCR for amplification of shRNA
Real time primers were designed for each shRNA of AURKB and TK1 wherein the forward primer sequence was complementary to the kinase shRNA sequence and the reverse primer was common for all, binding to the 3′ miR vector sequence. PCR was performed using purified primary PCR product as a template. An amplicon of 100 bp was expected. Primer sequences are provided in supplementary table S1 (appendix 1)
MTT assay for functional validation of hit obtained from screen
An MTT assay was performed using the AURKB inhibitor AZD1152-HQPA (Sigma). The colon cancer cell line HCT116 (sensitive) and the cervical cell line SiHa (resistant) were used as control cells for the MTT assay. In brief, 1000 cells of AW13516, 1500 cells of HCT116 and 2000 cells of SiHa were seeded in 96 well plates. The cells were treated with AZD1152-HQPA inhibitor for 72 hours before the MTT (0.5 mg/ml) reagent was added and the cells were incubated for 3 hours at 37°C in a CO2 incubator. DMSO was used for developing and a reading was obtained at 570 nm using a microplate reader (iMark microplate reader, Biorad). The percentage cell viability was calculated with respect to the untreated control cells. The assay was performed three times.
Generation of TK1 knockdown clones of AW13516
pZIP-hCMV shRNA constructs targeting TK1 genes and a scrambled control (TransOmics Technologies, USA) were used along with Lipofectamine 3000 transfection reagent (Invitrogen) for lentiviral production in 293FT cells. Lentivirus was harvested at 48 and 72 hours and filtered using a 0.4 µM filter. AW13516 cells were transduced with virus in the presence of 8 µg/ml concentration of polybrene and selection was done using 1 µg/ml puromycin for 4-5 days. The cells selected were positive for GFP expression. The shRNA sequences are as follows: TK1 sh1 – AAGCAGACAAGTACCACTCCG and TK1 sh2 – CCCAGGTGATTCTCGGGCCGA.
Western blotting
The cells were lysed in RIPA lysis buffer (Sigma) supplemented with 1 mM dithrothreitol (DTT) and protease inhibitor cocktail (Calbiochem, Merck), and quantitated using the BCA protein estimation method. 40 µg of protein was loaded on 12% SDS-PAGE gel and transferred onto PVDF membrane (Amersham Hybond, GE healthcare) by electro blotting. The membrane was stained with Ponceau to confirm protein transfer. Blocking was done in 5% BSA (prepared in 1X Tris Buffered Saline buffer with Tween-20) and blots were incubated with primary antibody overnight at 4°C, and then with secondary HRP conjugated antibody for one hour at room temperature. Blots were then washed in 1X TBST buffer and developed using Pierce ECL western blotting substrate (Thermo Fischer Scientific). Luminescence was captured on a Chemidoc System (Biorad). Primary antibody for TK1 (cell signalling) was used at a dilution of 1:1000 and secondary HRP conjugated goat anti-rabbit antibody (Santa Cruz Biotechnologies) was used at 1:2000 dilution.
Cell proliferation assay
Twenty thousand cells/well were seeded in a 24 well plate. Cell growth was assessed at 24 and 96 hours and the cells were counted using a haemocytometer. The percentage cell proliferation was calculated with respect to the scrambled control cells. The experiments were repeated in triplicate.
Results
A pooled kinome shRNA screen to identify oncogenic dependency in head and neck cancer cells
In order to identify essential genes in head and neck cancer, we performed a pooled kinome shRNA screen in the head and neck cancer cell line AW13516, derived from a tongue cancer patient from India, using 5419 pooled shRNA constructs targeting 906 human kinases. About 14 million cells were transduced with lentiviral particles harbouring shRNA against kinases at an MOI of 0.3. Following transduction, the cells were subjected to puromycin selection (1 µg/ml) and half the cells were harvested 3 or 4 days post selection. These cells were called the day 0 sample and served as a control. The remaining cells were passaged for 20 days in culture and collected at day 10 and day 20. Genomic DNA was extracted, shRNA amplification was performed, and barcode sequences were added by PCR (fig. 1). Each sample was tagged with a unique barcode to allow identification of the shRNAs belonging to each sample in order to enable sample multiplexing during sequencing.
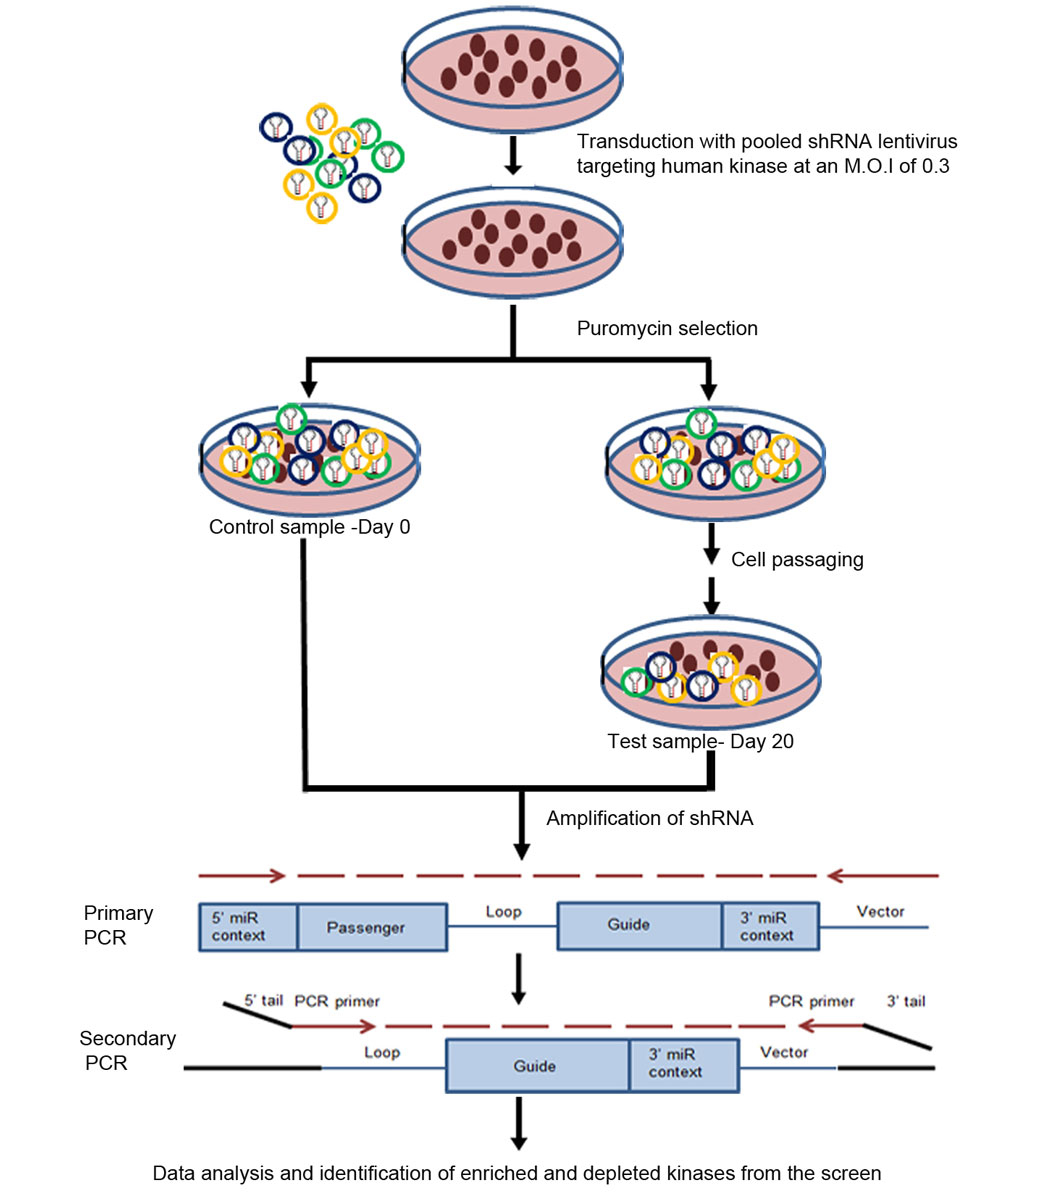
Figure 1
Schematic representation of pooled shRNA screen in AW13516 cells. AW13516 cells were transduced with pooled shRNA lentivirus targeting 906 human kinases at an MOI of 0.3. Cells were selected in puromycin and half the cells were collected as the day 0 sample, which was used as the reference or control sample, as it represents all the shRNA after transduction. The remaining half of the cells were passaged for up to 20 days in culture and collected as the day 20 sample. Genomic DNA was extracted from both samples and shRNA sequences were amplified by primary and secondary PCR. Then the indexed library, secondary PCR product was sequenced and shRNA counts were obtained for both samples. The shRNA sequences which were depleted in the day 20 compared to the day 0 ones were considered. Depleted kinases are those which have an oncogenic role in these cells.
Data deconvolution was performed using the edgeR package. Briefly, reads with shRNA sequences were mapped to the human kinome library and the percent mapping was estimated. Data QC revealed that about 75% of reads mapped to kinome references in AW13516 (table 1). shRNA hairpins with low counts (less than 0.5 counts per million) at day 0 were excluded from the analysis since the screen was performed at 1000-fold representation. The relative shRNA abundances in the day 0, day 10 and day 20 samples were estimated after performing within- and across-sample normalisation. A list of enriched and depleted shRNA hairpins was obtained by comparing the day 20 samples with the day 0 control samples. For screen 1, a time series analysis of the kinases enriched and depleted at day 10 and day 20 was done using the day 0 sample as a control. Data from screen 2 and screen 3 were used as replicates to identify shRNA hairpins that were enriched and depleted at day 20 compared to day 0. Gene-level information was derived for these shRNAs using the ‘ROAST’ module, and kinases that were de-regulated were ranked according to their depletion (supplementary table S2 in appendix 2). Kinases that are lost from the screen over time have potential roles as oncogenes, since depletion of these kinases by shRNA in cells is inducing a cell death phenotype, whereas kinases that get enriched may be acting as tumour-suppressors. Knockdown of these enriched kinases tends to promote cell proliferation, and therefore enrichment of shRNA is observed over the time.
Table 1 QC data from sequencing showing the percentage of the reads mapping to the kinome library for all three samples for each of the three screens of the AW13516 cell line.
| |
AW13516 Screen1
|
AW13516 Screen2
|
AW13516 Screen3
|
| Sample |
Day 0 |
Day 10 |
Day 20 |
Day 0 |
Day 10 |
Day 20 |
Day 0 |
Day 10 |
Day 20 |
| Total reads |
7,306,986 |
24,734,650 |
12,806,948 |
768,023 |
3,116,132 |
1,932,070 |
932,563 |
1,626,831 |
929,280 |
| Total reads mapping to kinome |
6,885,742 |
23,167,685 |
11,999,717 |
574,936 |
1,940,642 |
1,522,511 |
635,114 |
996,063 |
466,771 |
| Percent mapping to Kinome |
94.23 |
93.66 |
93.69 |
79.18 |
65.23 |
81.89 |
78.65 |
81.49 |
78.58 |
An integrated scoring system and analytical package, DepRanker, to rank biologically relevant genes
The GUI based pooled shRNA screen analysis and gene prioritisation package DepRanker was used to rank and identify biologically relevant genes. In screen 1, 127 kinases that were depleted in AW13516 cells and had available gene expression and copy number data were identified, while 146 such kinases were identified in screen 2 (table S3 in appendix 2). Gene expression and copy number alteration data for all the kinases showing significant depletion in the pooled screen were analysed for AW13516 cells [14]. Next, we used DepRanker to integrate genomics data such as the gene expression data, copy number data, ranking given by ROAST analysis and average logFC value of all the shRNAs associated with a gene to calculate the Rank Impact Score (RIS) for each kinase in the screen (fig. S1), as described in the methodology. The results from both screens were pooled together by considering the mean weight assigned to each kinase as described in the methodology (table S4). The kinase rankings for both screens are shown in table S5.
DepRanker ranked AURKB and TK1 as the top genes after combining the results from the two screens using the assigned weights (fig. 2). Due to the non-inclusion of the normal immortalised oral cells, the essential role of AURKB and TK1 in oral cancer cells couldn’t be established exclusively based on the screens performed. However, given that AURKB and TK1 are overexpressed and show high copy gain in AW13516 oral cancer cells, the data, along with the functional screen, suggest their potential oncogenic role in oral cancer (table S4). To confirm the reproducibility of the results obtained from our bioinformatics analysis, the counts for each shRNA in the day 0, day 10 and day 20 samples were validated using real time PCR for the selected candidate kinases. The shRNA counts targeting AURKB and TK1 were observed to be depleted in the day 10 and day 20 samples compared to the day 0 control sample, suggesting that these kinases confer oncogenic dependence in head and neck cancer cell lines and are essential for cell survival, as knockdown of these kinases resulted in the elimination of the corresponding shRNAs from the population over time (data not shown). These results were consistent with our bioinformatics analysis, wherein we observed a depletion of the shRNA constructs targeting AURKB and TK1 in the day 10 and day 20 samples compared to the day 0 sample. Here, we considered the mean CPM (counts per million) of each shRNA construct for both genes across all three screens. The percent shRNA counts at each time point are plotted in figure 3. All three shRNAs of AURKB show consistent depletion at day 10 and day 20.
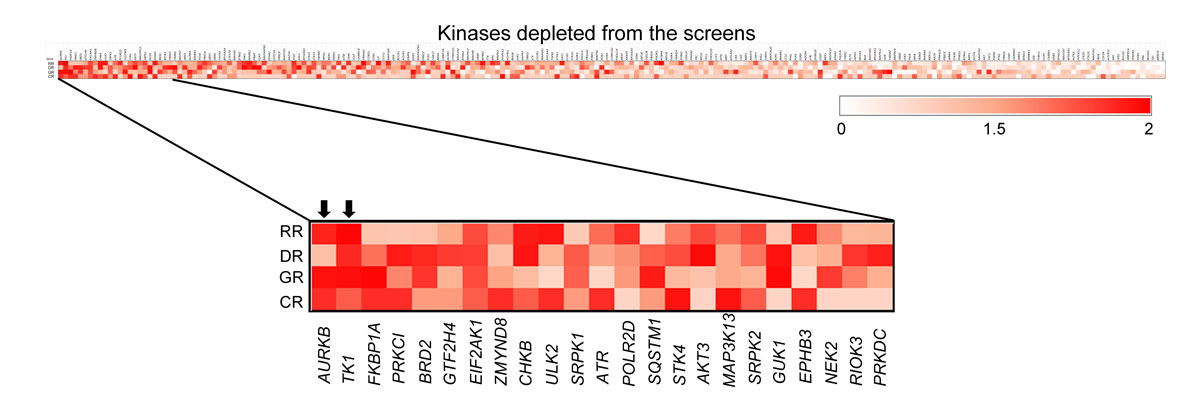
Figure 2
Heatmap representation of depleted kinases in the screen considering overall Rank Impact Score (RIS). Heatmap representation of the kinases depleted in the screen which have a high impact score according to the ranking assigned by considering ROAST, gene expression data, copy number data and the average logFC of the depleted shRNA for that kinase. The enlarged view shows the top 10 kinases with the highest impact scores. AURKB and TK1 kinases top the list.
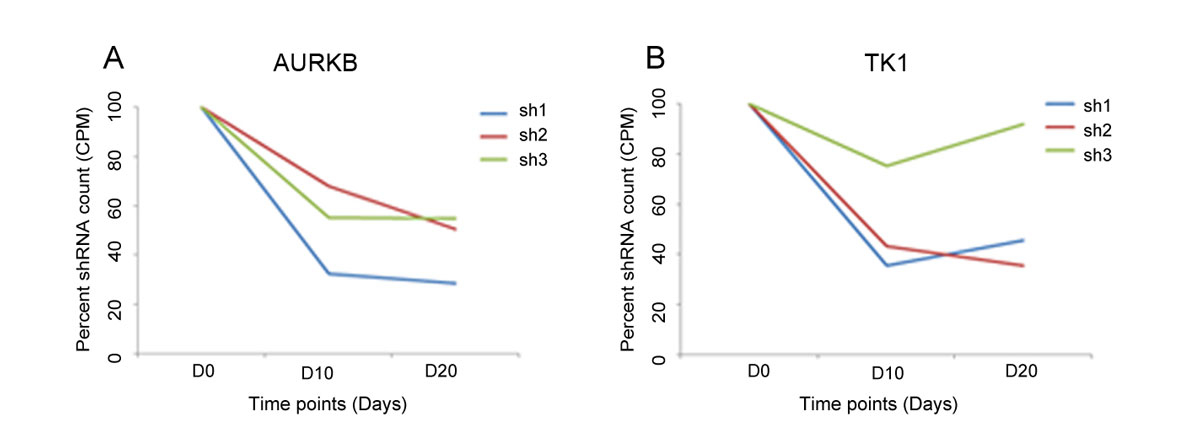
Figure 3
Graph showing percent shRNA counts at day 0, day 10 and day 20 for three shRNAs of AURKB and TK1. The mean CPM counts of each shRNA construct for both genes across all three screens were obtained and the percent shRNA counts at each time point are plotted.
AURKB and TK1 kinases confer oncogenic dependency in AW13516 cells
AURKB is a chromosomal passenger protein which is critical for the accurate segregation of chromosomes during cell division [16]. However, in several cancers over-expression of AURKB is often associated with poor prognosis [17]. AURKB-mediated phosphorylation suppresses the activity of p53 through several mechanisms [18, 19]. However, several studies have also reported that inhibitors of AURKB are effective at inhibiting cell growth in p53 mutant cell lines [20, 21]. AW13516 cells harbour the p53 mutations p.R273H and p.R72fs*51.
To confirm AURKB as a potential oncogenic kinase conferring cell survival of AW13516 cells, we performed an MTT assay on AW13516 cells using AZD1152-HQPA inhibitor. We observed that the AW13516 cells were sensitive to the inhibitor, with an IC50 value of 40 nM. HCT116 colon cells were used as a sensitive cell line for the assay, and cervical cancer SiHa cells were used as resistant cells (fig. 4A). These results suggest that the AURKB-specific inhibitor AZD1152-HQPA could inhibit the cell viability of p53 mutant AW13156 cells. The results are consistent with the sensitivity of this inhibitor to other cells, such as HT29 cells with the similar p53 mutation p.R273H [20].
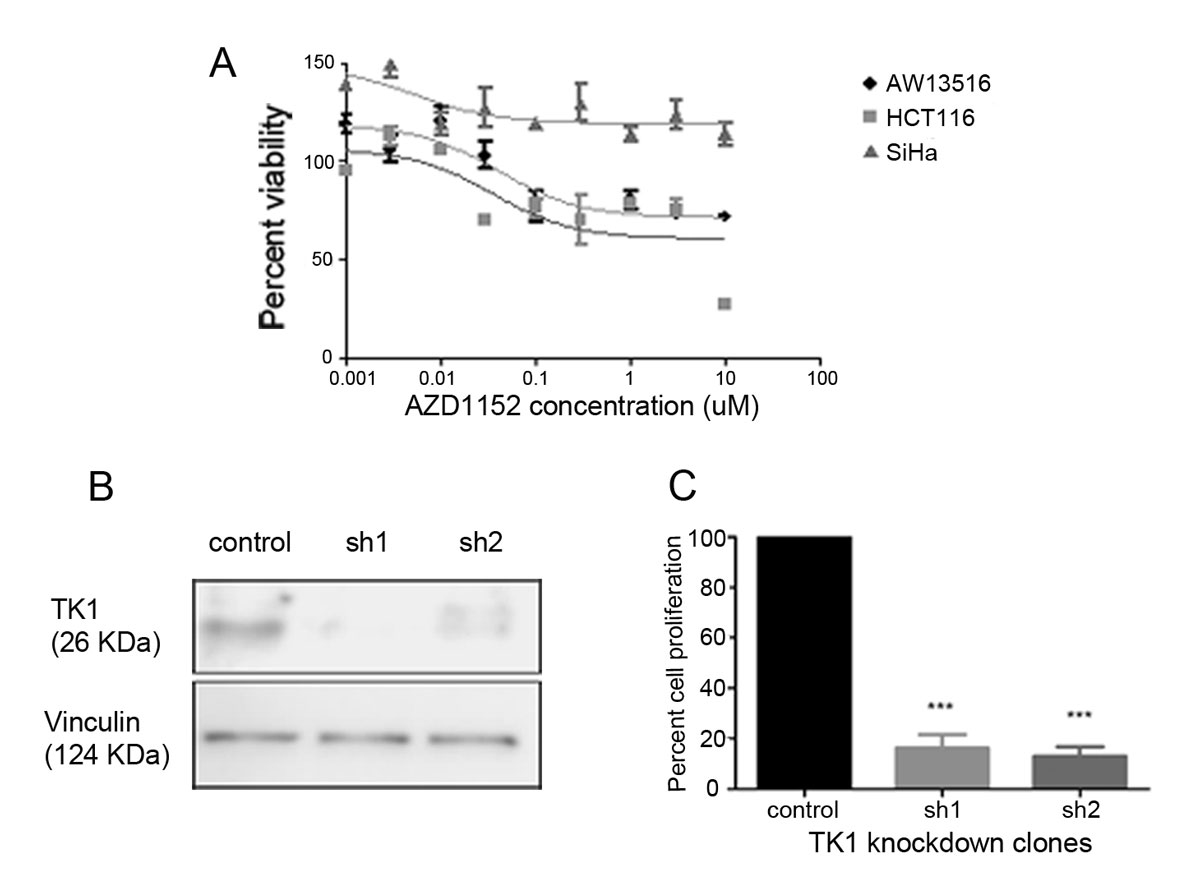
Figure 4
AURKB and TK1 show oncogenic dependency in AW13516 cells. (A) MTT assay with AZD1152-HQPA inhibitor in AW13156, HCT116 and SiHa cells. (B) Knockdown confirmation of TK1 in AW13516 cells by western blotting. (C) Cell proliferation assay in control and TK1 knockdown clones of AW13516 cells.
Thymidine kinase 1 (TK1) was identified from the screen as another potential target. TK1 is an enzyme that plays a role in the first step of the biosynthesis of dTTP during DNA synthesis in cells [22]. High expression of TK1 in cancer tissues is associated with disease progression and poor prognosis [23]. Serum TK1 levels are used as a prognostic biomarker in several cancers, including head and neck cancer, to predict the outcome of treatment [24]. TK1 is thus an attractive target. To functionally characterise the role of TK1, we performed knockdown of TK1 in AW13156 cells and confirmed the knockdown by western blotting. We performed a cell proliferation assay and observed that proliferation was significantly (p <0.0001) affected in the knockdown clones compared to the scrambled control cells (figs 4B and 4C).
Patients with AURKB alterations show a poor overall survival
To assess the impact of AURKB alterations on the survival of patients, we accessed gene alteration data for AURKB and TK1 from cBioPortal [15]. TCGA provisional HNSCC data sets comprising mutations, copy number changes and mRNA upregulation across 528 samples were analysed. Survival analysis using Kaplan-Meier plots suggests that patients with AURKB alteration display a poor survival of 18 months, compared to a survival of 56 months in the non-altered group (fig. 5A). The survivals of the TK1-altered and the non-altered cohorts were 22 and 56 months respectively (fig. 5B), suggesting poor survival in the TK1 genetic alteration group.
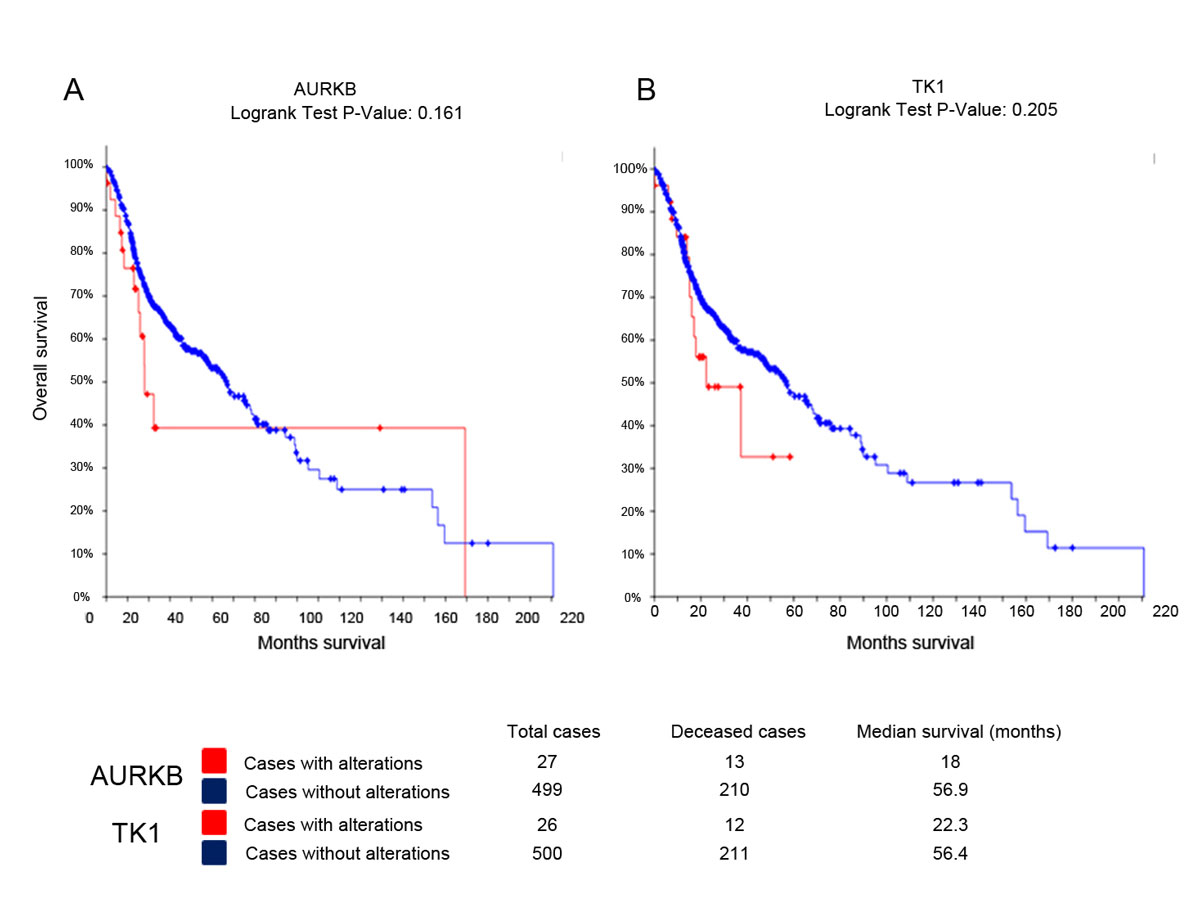
Figure 5 Kaplan-Meier survival analysis in TCGA-HNSCC dataset.
Discussion
Pooled shRNA screens are a powerful tool for the identification of specific gene targets that are essential for the survival of cancer cells. However, heterogeneous data sets often have limited reproducibility, as indicated by multiple studies, and several approaches are adopted to minimise the noise generated by non-reproducible hits [25]. Other factors that contribute to the variability and complexity of screen data are the effective delivery of shRNA, random integration for the stable expression of shRNA, processing of shRNA hairpins into silencing complexes, and off-target effects [26]. Therefore, to overcome these limitations due to variability in the reproducibility of the data, several robust computational approaches have emerged [27, 28]. Some analysis methods integrate genomic data such as gene expression and copy number information to provide insights into and predict essential genes in cancer [12, 13].
Although several data integration tools and packages for analysing the dataset from the screen are available, most have their specific third-party needs and necessitate intense computational infrastructure that cannot be run by researchers without specialised and advanced computational expertise. Thus, the lack of a simplified scoring system allowing a functional biologist to rank genes from the screen data by integrating the genomics data remains a limitation. To address this, we have developed a scoring system, DepRanker, which calculates a Rank Impact Score for each gene identified in the screen by considering the gene expression and copy number data.
Two different screens in AW13516 cells were analysed using different approaches, and were also sequenced at different depths. Because of the major differences in the overall capture of the libraries, we expected the results from the screens to be different. Since neither of the screens were performed at a high enough saturation, we analysed the data following separate protocols. The candidate genes AURKB and TK1, identified from both the screens using an integrated genomics approach, were validated by inhibitor and knockdown assays. DepRanker is a step towards reducing noise due to differences in the capture of libraries, sequencing depth and analysis methods. This approach can be useful specifically for identifying dependencies in cell lines.
AURKB and TK1 are reported to have oncogenic functions in several cancer types, including HNSCC. A previous study on p53 mutant HNSCC cell lines using a kinome screen was also able to identify certain aurora kinases and thymidine kinases as therapeutic targets [29], which is consistent with our findings.
AW13516 cells display high copy amplification and gene expression of the AURKB gene. Overexpression or amplification of AURKB has been reported in several cancer types [16, 18]. AURKB is a chromosomal protein involved in the segregation of chromosomes and cytokinesis [30], and its overexpression leads to aneuploidy in the cells. It is also associated with aggressive tumour progression [31]. There are several pieces of evidence that point towards the oncogenic role of AURKB in head and neck cancer. High AURKB expression has been observed to be associated with increased cell proliferation and lymph node metastasis [32], involved in the activation of the RAS-MAPK pathway, and contributing to cetuximab resistance [33]. Also, AURKB is one of the essential genes most commonly identified from pooled RNAi and CRISPR screens on cancer cell lines, as identified by a search for this gene in the DepMap portal [12]. We observed that AW13516 cells were sensitive to the AURKB inhibitor AZD1152-HQPA. In addition, survival analysis of TCGA HNSCC data indicated that patients with AURKB genes alterations display poor overall survival, which suggests it plays a role in carcinogenesis in HNSCC. AURKB is a potential therapeutic target for the treatment of HNSCC, and several AURKB inhibitors are in clinical trials [16, 34].
Similarly, the TK1 target identified in the screen also exhibited high copy gain and increased gene expression in AW13516 cells. Thymidine kinase 1 (TK1) has a role in regulating the cell cycle [22]. Serum TK1 levels are used to determine disease prognoses and to predict treatment outcomes [23]. A study of head and neck cancer showed that patients treated with chemotherapy and surgery showed decreased serum TK1 levels, whereas patients with stable disease displayed elevated TK1 levels. Hence, TK1 can be used as a biomarker to evaluate disease outcomes [24, 35]. We functionally validated another target, TK1, using a knockdown approach. A significant difference in the proliferation rate was observed in TK1 knockdown clones compared to control cells, suggesting that TK1 is essential for the survival of cells. Also, a previous study from our lab identified significant up-regulation of TK1 expression in tongue tumours [36].
In conclusion, we developed a data integration and scoring system, DepRanker, which uses the output of shRNA screen analysis packages (like ROAST, RIGER and Chimera) and integrates this with other genomics datasets to compute an integration score, known as a Rank Impact Score (RIS), for each gene. We performed a pooled RNAi screen against 906 kinase genes and, using the DepRanker, integrated the outcome with gene expression and copy number data for AW13516 cells to identify AURKB and TK1 as essential genes in oral cancer.
Acknowledgements
We would like to thank all members of the Dutt laboratory for reviewing the manuscript, Medgenome Labs Ltd. for providing sequencing services and Dr Dulal Panda from IIT Mumbai for providing AZD1152-HQPA inhibitor.
Author contributions
TT, PT, M Ramteke, M Ranjan, DM, AP and PU contributed to the functional work; TT, SD and AD designed the research; SD, BS and RM performed the bioinformatics analysis; TT, SD and AD analysed the data; and TT, SD and AD wrote the paper. All authors have read and approved the manuscript.
References
1
Sadikovic
B
,
Al-Romaih
K
,
Squire
JA
,
Zielenska
M
. Cause and consequences of genetic and epigenetic alterations in human cancer. Curr Genomics. 2008;9(6):394–408. doi:.https://doi.org/10.2174/138920208785699580
2
Weinstein
IB
,
Joe
A
,
Felsher
D
. Oncogene addiction. Cancer Res. 2008;68(9):3077–80, discussion 3080. doi:.https://doi.org/10.1158/0008-5472.CAN-07-3293
3
Iqbal
N
,
Iqbal
N
. Imatinib: a breakthrough of targeted therapy in cancer. Chemother Res Pract. 2014;2014:357027. doi:.https://doi.org/10.1155/2014/357027
4
Smith
J
. Erlotinib: small-molecule targeted therapy in the treatment of non-small-cell lung cancer. Clin Ther. 2005;27(10):1513–34. doi:.https://doi.org/10.1016/j.clinthera.2005.10.014
5
Campeau
E
,
Gobeil
S
. RNA interference in mammals: behind the screen. Brief Funct Genomics. 2011;10(4):215–26. doi:.https://doi.org/10.1093/bfgp/elr018
6
Dai
Z
,
Sheridan
JM
,
Gearing
LJ
,
Moore
DL
,
Su
S
,
Wormald
S
, et al.
edgeR: a versatile tool for the analysis of shRNA-seq and CRISPR-Cas9 genetic screens. F1000 Res. 2014;3:95. doi:.https://doi.org/10.12688/f1000research.3928.2
7
Luo
B
,
Cheung
HW
,
Subramanian
A
,
Sharifnia
T
,
Okamoto
M
,
Yang
X
, et al.
Highly parallel identification of essential genes in cancer cells. Proc Natl Acad Sci USA. 2008;105(51):20380–5. doi:.https://doi.org/10.1073/pnas.0810485105
8
König
R
,
Chiang
CY
,
Tu
BP
,
Yan
SF
,
DeJesus
PD
,
Romero
A
, et al.
A probability-based approach for the analysis of large-scale RNAi screens. Nat Methods. 2007;4(10):847–9. doi:.https://doi.org/10.1038/nmeth1089
9
Wu
D
,
Lim
E
,
Vaillant
F
,
Asselin-Labat
ML
,
Visvader
JE
,
Smyth
GK
. ROAST: rotation gene set tests for complex microarray experiments. Bioinformatics. 2010;26(17):2176–82. doi:.https://doi.org/10.1093/bioinformatics/btq401
10
Wu
D
,
Smyth
GK
. Camera: a competitive gene set test accounting for inter-gene correlation. Nucleic Acids Res. 2012;40(17):e133. doi:.https://doi.org/10.1093/nar/gks461
11
McFarland
JM
,
Ho
ZV
,
Kugener
G
,
Dempster
JM
,
Montgomery
PG
,
Bryan
JG
, et al.
Improved estimation of cancer dependencies from large-scale RNAi screens using model-based normalization and data integration. Nat Commun. 2018;9(1):4610. doi:.https://doi.org/10.1038/s41467-018-06916-5
12
Tsherniak
A
,
Vazquez
F
,
Montgomery
PG
,
Weir
BA
,
Kryukov
G
,
Cowley
GS
, et al.
Defining a Cancer Dependency Map. Cell. 2017;170(3):564–576.e16. doi:.https://doi.org/10.1016/j.cell.2017.06.010
13
Guan
Y
,
Li
T
,
Zhang
H
,
Zhu
F
,
Omenn
GS
. Prioritizing predictive biomarkers for gene essentiality in cancer cells with mRNA expression data and DNA copy number profile. Bioinformatics. 2018;34(23):3975–82. doi:.https://doi.org/10.1093/bioinformatics/bty467
14
Chandrani
P
,
Upadhyay
P
,
Iyer
P
,
Tanna
M
,
Shetty
M
,
Raghuram
GV
, et al.
Integrated genomics approach to identify biologically relevant alterations in fewer samples. BMC Genomics. 2015;16(1):936. doi:.https://doi.org/10.1186/s12864-015-2138-4
15
Gao
J
,
Aksoy
BA
,
Dogrusoz
U
,
Dresdner
G
,
Gross
B
,
Sumer
SO
, et al.
Integrative analysis of complex cancer genomics and clinical profiles using the cBioPortal. Sci Signal. 2013;6(269):pl1. doi:.https://doi.org/10.1126/scisignal.2004088
16
Dar
AA
,
Goff
LW
,
Majid
S
,
Berlin
J
,
El-Rifai
W
. Aurora kinase inhibitors--rising stars in cancer therapeutics?
Mol Cancer Ther. 2010;9(2):268–78. doi:.https://doi.org/10.1158/1535-7163.MCT-09-0765
17
González-Loyola
A
,
Fernández-Miranda
G
,
Trakala
M
,
Partida
D
,
Samejima
K
,
Ogawa
H
, et al.
Aurora B Overexpression Causes Aneuploidy and p21Cip1 Repression during Tumor Development. Mol Cell Biol. 2015;35(20):3566–78. doi:.https://doi.org/10.1128/MCB.01286-14
18
Tang
A
,
Gao
K
,
Chu
L
,
Zhang
R
,
Yang
J
,
Zheng
J
. Aurora kinases: novel therapy targets in cancers. Oncotarget. 2017;8(14):23937–54. doi:.https://doi.org/10.18632/oncotarget.14893
19
Gully
CP
,
Velazquez-Torres
G
,
Shin
JH
,
Fuentes-Mattei
E
,
Wang
E
,
Carlock
C
, et al.
Aurora B kinase phosphorylates and instigates degradation of p53. Proc Natl Acad Sci USA. 2012;109(24):E1513–22. doi:.https://doi.org/10.1073/pnas.1110287109
20
Tao
Y
,
Zhang
P
,
Girdler
F
,
Frascogna
V
,
Castedo
M
,
Bourhis
J
, et al.
Enhancement of radiation response in p53-deficient cancer cells by the Aurora-B kinase inhibitor AZD1152. Oncogene. 2008;27(23):3244–55. doi:.https://doi.org/10.1038/sj.onc.1210990
21
Ha
GH
,
Breuer
EK
. Mitotic Kinases and p53 Signaling. Biochem Res Int. 2012;2012:195903. doi:.https://doi.org/10.1155/2012/195903
22
Bagegni
N
,
Thomas
S
,
Liu
N
,
Luo
J
,
Hoog
J
,
Northfelt
DW
, et al.
Serum thymidine kinase 1 activity as a pharmacodynamic marker of cyclin-dependent kinase 4/6 inhibition in patients with early-stage breast cancer receiving neoadjuvant palbociclib. Breast Cancer Res. 2017;19(1):123. doi:.https://doi.org/10.1186/s13058-017-0913-7
23
Ning
S
,
Wei
W
,
Li
J
,
Hou
B
,
Zhong
J
,
Xie
Y
, et al.
Clinical significance and diagnostic capacity of serum TK1, CEA, CA 19-9 and CA 72-4 levels in gastric and colorectal cancer patients. J Cancer. 2018;9(3):494–501. doi:.https://doi.org/10.7150/jca.21562
24
Zhou
J
,
He
E
,
Skog
S
. The proliferation marker thymidine kinase 1 in clinical use. Mol Clin Oncol. 2013;1(1):18–28. doi:.https://doi.org/10.3892/mco.2012.19
25
Schaefer
C
,
Mallela
N
,
Seggewiß
J
,
Lechtape
B
,
Omran
H
,
Dirksen
U
, et al.
Target discovery screens using pooled shRNA libraries and next-generation sequencing: A model workflow and analytical algorithm. PLoS One. 2018;13(1):e0191570. doi:.https://doi.org/10.1371/journal.pone.0191570
26
Fellmann
C
,
Lowe
SW
. Stable RNA interference rules for silencing. Nat Cell Biol. 2014;16(1):10–8. doi:.https://doi.org/10.1038/ncb2895
27
Dempster
JM
,
Pacini
C
,
Pantel
S
,
Behan
FM
,
Green
T
,
Krill-Burger
J
, et al.
Agreement between two large pan-cancer CRISPR-Cas9 gene dependency data sets. Nat Commun. 2019;10(1):5817. doi:.https://doi.org/10.1038/s41467-019-13805-y
28
Shao
DD
,
Tsherniak
A
,
Gopal
S
,
Weir
BA
,
Tamayo
P
,
Stransky
N
, et al.
ATARiS: computational quantification of gene suppression phenotypes from multisample RNAi screens. Genome Res. 2013;23(4):665–78. doi:.https://doi.org/10.1101/gr.143586.112
29
Moser
R
,
Xu
C
,
Kao
M
,
Annis
J
,
Lerma
LA
,
Schaupp
CM
, et al.
Functional kinomics identifies candidate therapeutic targets in head and neck cancer. Clin Cancer Res. 2014;20(16):4274–88. doi:.https://doi.org/10.1158/1078-0432.CCR-13-2858
30
Smith
SL
,
Bowers
NL
,
Betticher
DC
,
Gautschi
O
,
Ratschiller
D
,
Hoban
PR
, et al.
Overexpression of aurora B kinase (AURKB) in primary non-small cell lung carcinoma is frequent, generally driven from one allele, and correlates with the level of genetic instability. Br J Cancer. 2005;93(6):719–29. doi:.https://doi.org/10.1038/sj.bjc.6602779
31
Hegyi
K
,
Egervári
K
,
Sándor
Z
,
Méhes
G
. Aurora kinase B expression in breast carcinoma: cell kinetic and genetic aspects. Pathobiology. 2012;79(6):314–22. doi:.https://doi.org/10.1159/000338082
32
Mehra
R
,
Serebriiskii
IG
,
Burtness
B
,
Astsaturov
I
,
Golemis
EA
. Aurora kinases in head and neck cancer. Lancet Oncol. 2013;14(10):e425–35. doi:.https://doi.org/10.1016/S1470-2045(13)70128-1
33
Boeckx
C
,
Op de Beeck
K
,
Wouters
A
,
Deschoolmeester
V
,
Limame
R
,
Zwaenepoel
K
, et al.
Overcoming cetuximab resistance in HNSCC: the role of AURKB and DUSP proteins. Cancer Lett. 2014;354(2):365–77. doi:.https://doi.org/10.1016/j.canlet.2014.08.039
34
Falchook
GS
,
Bastida
CC
,
Kurzrock
R
. Aurora Kinase Inhibitors in Oncology Clinical Trials: Current State of the Progress. Semin Oncol. 2015;42(6):832–48. doi:.https://doi.org/10.1053/j.seminoncol.2015.09.022
35
Chen
Y
,
Ying
M
,
Chen
Y
,
Hu
M
,
Lin
Y
,
Chen
D
, et al.
Serum thymidine kinase 1 correlates to clinical stages and clinical reactions and monitors the outcome of therapy of 1,247 cancer patients in routine clinical settings. Int J Clin Oncol. 2010;15(4):359–68. doi:.https://doi.org/10.1007/s10147-010-0067-4
36
Upadhyay
P
,
Gardi
N
,
Desai
S
,
Chandrani
P
,
Joshi
A
,
Dharavath
B
, et al.
Genomic characterization of tobacco/nut chewing HPV-negative early stage tongue tumors identify MMP10 asa candidate to predict metastases. Oral Oncol. 2017;73:56–64. doi:.https://doi.org/10.1016/j.oraloncology.2017.08.003