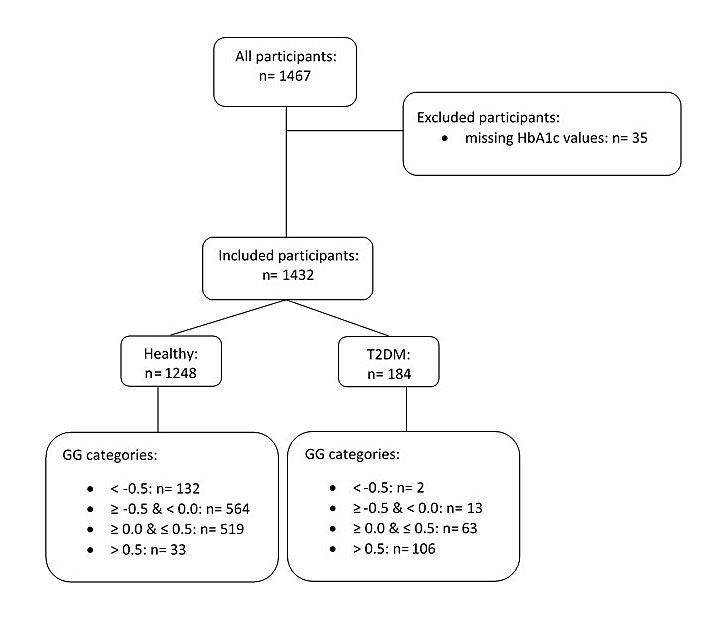
Figure 1 Chart representing all the recruited participants, with those retained and those excluded (n = number of participants). See text for primary exclusion criteria.
GG = glycation gap; T2DM = type 2 diabetes mellitus
DOI: https://doi.org/10.4414/smw.2019.20163
The non-enzymatic glycation of proteins through the Maillard reaction is a physiological process which takes place in plants, animals and humans alike. This posttranslational linkage between protein amino and guanidino groups and sugar carbonyl compounds transitions to Amadori and Heynes intermediates before ending up in a stable state, i.e. an advanced glycation end product. Glycation affects the interactions of proteins with specific receptors [1, 2], (auto-)antibodies [3], protein half-lives, senescence [4] and protein folding [5, 6]. Oligosaccharide glycan is covalently attached to polypeptide side chains. This may occur through co- and/or post-translational glycation/glycosylation, now possibly thought to be under control of micro-ribonucleic acid [7]. This glycation serves to aid the recognition of certain cell types. Advanced glycation end products are responsible for blood vessel malfunction through their reactions with specific receptors [8]. The stimulation of receptors for advanced glycation end products by their agonists activates nuclear factor-kappa B and increases endothelial permeability to macromolecules, causing kidney impairment [9, 10]. Advanced glycation end products block nitric oxide, boosting reactive oxygen species and causing consecutive inflammation [11]. Glucose concentrations are similar in the intra- and extracellular compartments due to the glucose T1 channel homeostatic mechanism, which is markedly expressed in the microvascular system of the kidneys. Hyperglycaemic metabolic state causes an intracellular toxic effect which leads to microvascular complications with time [12].
The glycation extent of haemoglobin (glycated haemoglobin A1c) is an indicator of plasma glucose levels over the ~100 days prior to a venipuncture, and the laboratory assays for its quantification are steadily changing [13, 14]. The remainder of glycoproteins are collectively termed fructosamines [15], and most of these are glycated albumin. Investigations into both HbA1c and fructosamine values are appropriate for clinical use [16, 17]. The difference between the measured HbA1c value and the HbA1c value predicted from fructosamine values is termed the glycation gap. It has a broad distribution in patients with nephropathy (from −3.0% to 5.5%) [18]. Glycation gap values oscillating within >−0.5 and <0.5 were assumed to be in the tolerable range. A drop below −0.5 was considered metabolically fit, whereas a glycation gap >0.5 was considered metabolically unfit [19, 20].
Glycation gap evaluations currently comply with the reference change value criteria for glycaemic control, as documented by their stability in the follow-up of patients with type 2 diabetes [21]. To date, the glycation gap ranges in healthy controls are unknown. It has been suggested that glycation gap is not associated with chronic kidney disease in nondiabetic individuals [22].
Dyslipidaemia, a spectrum of quantitative and qualitative changes in lipids and lipoproteins, is now acknowledged to accompany the metabolic abnormality of hyperglycaemia [23], and a low-grade inflammatory background to insulin insufficiency emerges in the literature [24].
We have recently found laboratory evidence of impaired glucose metabolism among subjectively healthy elderly Swiss individuals [25], and with the current data we hope to improve our understanding by considering the involvement of glycation gap calculations in diabetic organ failure [18]. Therefore, in the present study we will relate the glycation gap to lipid metabolism, low grade inflammation as evidenced by high-sensitivity C-reactive protein, and kidney function as estimated by glomerular filtration rates in primarily healthy seniors, those with prediabetes, and in a small number of participants with treated type 2 diabetes mellitus.
We conducted a cross-sectional cohort study. Consecutive subjectively healthy older volunteers aged ≥60 years were recruited between February 2009 and December 2011 as part of the SENIORLABOR study (International Standard Registered Clinical/Social Study Number 53778569), an ongoing investigation on the Swiss plateau aimed at creating appropriate reference intervals for several analytes in older citizens. The study participants were contacted through newspaper advertisements, clubs and associations where there was a high probability that the membership would include healthy older citizens (e.g., mountaineering clubs, sports clubs) and, for a few participants, through the personal contacts of those involved in organising the study. The personal histories of the participants were collected and anthropometric measurements (body weight, height and body mass index) were taken. We excluded candidates presenting overt comorbidities and excessive alcohol consumption. The food intake of participants was confirmed to be typical of the Swiss midlands and consisted of an approximate energy consumption per person per day of 2661 kcal (11,135 kJ), composed of 14% proteins, 51% carbohydrates and 35% fat [26]. The mean body mass index of the participants was in the upper normal range for both genders, based on the definition issued by the World Health Organization. There were no overweight participants in the cohort. The primary exclusion criteria for the present study were: current steroid use, thyroid dysfunction (free-thyroxine level <9 or >19 pmol/l), high-sensitivity C-reactive protein concentration above 10 mg/l, and being underweight (body mass index <18.5 kg/m2). The participant inclusion algorithm is illustrated in fig. 1. Out of 1467 study participants, 35 were excluded due to missing glycated haemoglobin A1c values. All remaining participants (n = 1432, 100%) were included in the study. The subjects were subdivided into healthy and diabetic participants. The glycated haemoglobin A1c values and fasting plasma glucose levels in the healthy subjects (n = 1248, 87.2%) remained below the cut-off values for diabetes according to the current reference intervals (glycated haemoglobin A1c ≥6.5%, fasting plasma glucose ≥7 mmol/l). The diabetic subjects (n = 184, 12.8%) were either diagnosed with type 2 diabetes and receiving treatment or were identified as diabetics because their laboratory values exceeded the glycated haemoglobin and/or fasting plasma glucose cut-offs.
Figure 1 Chart representing all the recruited participants, with those retained and those excluded (n = number of participants). See text for primary exclusion criteria.
GG = glycation gap; T2DM = type 2 diabetes mellitus
This study was conducted in accordance with the ethical guidelines of the 1957 Declaration of Helsinki and was approved by the cantonal institutional review board (Kantonale Ethikkommission Bern 166/08, Bern, Switzerland). All participants provided written informed consent.
The venous blood samples were drawn by venipuncture into S-Monovette tubes (Sarstedt, Sevelen, Switzerland) after an overnight fasting period. The blood samples were processed (centrifuged, aliquoted and analysed within two hours or frozen at –80°C at our site) immediately to enable standardised preanalytics.
Fasting plasma glucose levels were measured using the enzymatic hexokinase procedure on a Roche Integra 800 (Rotkreuz, Switzerland). Glycated haemoglobin A1c was measured with International Federation of Clinical Chemistry-approved chromatography (high-power liquid chromatography D-10, Biorad, Reinach, Switzerland), a testing system certified by the United States of America National Glycohemoglobin Standardization Program. This system has a coefficient of variation of <2.8%, a range in agreement with currently acknowledged requirements [27]. Fructosamine levels were measured using a spectrophotometric assay based on the reduction of nitroblue tetrazolium to formazan and were assayed on an Abbott ARCHITECT (Abbott Switzerland, Baar). Insulin was measured with an electrochemiluminescence immunoassay (Cobas 6000). Insulin resistance was estimated with the homeostasis model assessment index (serum insulin [µU/ml] x serum glucose [mmol/l] divided by 22.5). The following homeostasis model assessment index values and cut-offs were used: ≤2.0 = no insulin resistance, >2.0 to <2.5 = indication for insulin resistance, ≥2.5 to ≤5.0 = insulin resistance likely; values >5.0 are typically seen in patients with type 2 diabetes mellitus [28]. Triglyceride levels were measured using an enzymatic colorimetric method on a Roche Integra 800 (Roche Diagnostics, Rotkreuz, Switzerland). Hypertriglyceridaemia was defined as triglyceride concentrations >1.7 mmol/l (150 mg/dl), in accordance with the Canadian Cardiovascular Society guidelines [29].
The isotope dilution mass spectrometry-standardised creatinine concentration was determined using a modified Jaffe method on a Cobas Integra 800 instrument. Commercially available materials were used for quality control. Glomerular filtration rates were calculated using cystatin C equations [30]. The inter-day coefficients of variation for creatinine were 4.27% at 42 µmol/l and 1.96% at 556 µmol/l. High-sensitivity C-reactive protein levels were measured using a Siemens ProSpec instrument. Glomerular filtration rates were estimated using the combined chronic kidney disease estimation, which uses creatinine and corrected cystatin C levels (Chronic Kidney Disease Epidemiology Collaboration equation). The arithmetic mean of the estimated glomerular filtration ratecys was obtained from the Caucasian, Asian, Paediatric and Adult cohort equation [31], and the estimated glomerular filtration ratecrea. was used for the calculation.
The classification of chronic kidney disease used in our study is based on either measured or estimated glomerular filtration rates. Chronic kidney disease stages 1 and 2 denote normal or slightly reduced kidney function (glomerular filtration rate ≥90 ml/min/1.73 m2 or 60–89 ml/min/1.73 m2). In chronic kidney disease stages 3 and 4, functional impairment is moderate (glomerular filtration rate 30–59 ml/min/1.73 m2) or severe (glomerular filtration rate 15–29 ml/min/1.73 m2).
The serum high-sensitivity C-reactive protein concentrations were categorised as low (<1.0 mg/l), average (1.0–3.0 mg/l) or high (>3.0 mg/l), in accordance with the statement for healthcare professionals from the Centers for Disease Control and Prevention and the American Heart Association [32]. Participants with high-sensitivity C-reactive protein values >10 mg/l were excluded from the study at the outset.
The glycation gap for each participant was calculated by determining the difference between the measured glycated haemoglobin A1c level and the value predicted from the fructosamine measurement using the regression equation (predicted glycated haemoglobin A1c = 3.2426 + (0.01146 x fructosamine level)). Glycation gap values oscillating within >−0.5 and <0.5 were assumed to be in the tolerable range. A drop below −0.5 was considered metabolically fit, whereas a glycation gap >0.5 was considered metabolically unfit [19]. Therefore, we subclassified participants into four glycation gap categories: <−0.5, −0.5 to <0.0, 0.0 to ≤0.5, and >0.5.
The current American Diabetes Association reference intervals for the diagnosis of type 2 diabetes mellitus (glycated haemoglobin A1c ≥6.5%, fasting plasma glucose ≥7.0 mmol/l) were used for this study [33]. We used the baseline classifications of prediabetes tested by Heianza et al. [34]. These authors used combinations of four glycated haemoglobin intervals, A1c 6.0–6.4%, 5.7–6.4%, <6.0% or <5.7%, and four fasting plasma glucose level intervals, 6.1–6.9 mmol/l, 5.6–6.9 mmol/l, <6.1 mmol/l or <5.6 mmol/l, to create multiple classifications of prediabetes.
Class A referred to a glycated haemoglobin A1c level of 6.0–6.4% combined with a fasting plasma glucose level of 6.1–6.9 mmol/l, and these criteria were predictive of a cumulative risk of developing type 2 diabetes mellitus of as high as 100% after 5.6 years. Class B used the combination of glycated haemoglobin A1c 5.7–6.4% and fasting plasma glucose 6.1–6.9 mmol/l. Class C used the combination of glycated haemoglobin A1c 6.0–6.4% and fasting plasma glucose 5.6–6.9 mmol/l. Classes B and C both resulted in a similar cumulative risk of developing type 2 diabetes mellitus of approximately 80%. Class D was defined by the combination of glycated haemoglobin A1c 5.7–6.4% and fasting plasma glucose 5.6–6.9 mmol/l, and was predictive of a cumulative risk of developing type 2 diabetes mellitus of approximately 50%. Finally, the combinations of glycated haemoglobin A1c <6.0% and fasting plasma glucose <6.1 mmol/l (class E) and of HbA1c <5.7% and fasting plasma glucose <5.6 mmol/l (class F) were predictive of an approximately 0–10% cumulative risk of developing type 2 diabetes mellitus.
The accuracy and precision of our assays complies with external and internal quality control requirements and is certified (international standardisation organisation/IEC 17000,5.5 www.seco.admin.ch) by the Swiss commission for quality assurance in the medical laboratory.
The statistical analyses were performed using MedCalc for Windows, version 15.6.2 (MedCalc Software, Ostend, Belgium). The distributions of the analysed variables were tested using the Shapiro-Wilk test. For a preliminary analysis, the data were logarithmically transformed as appropriate to correct the skewness of the data. Outliers were detected using the Tukey method, in which an outside value was defined as a value smaller than the lower quartile minus 1.5 times the interquartile range or larger than the upper quartile plus 1.5 times the interquartile range. Three such values were identified. Since this is a low number of outliers and since there was no indication of any error, these outliers were not excluded from the statistical analyses.
The preliminary appraisals revealed a non-normal distribution of the data, so most statistical analyses were performed using rank-based methods, which can be expected to perform as intended with skew distributions and certain outliers. Between-group comparisons were performed using Student’s t-test and the Mann-Whitney test for independent samples. Proportions were compared using the χ2 test. To evaluate a possible trend in analyte concentrations among the four glycation gap categories, the rank-based Jonckheere-Terpstra test for trends was used to assess prediabetes involving HbA1c and fasting plasma glucose measurements. Correlations between variables were estimated using Spearman's rank correlation analysis, depending on the distribution of the researched variable. A p-value of <0.05 was considered to indicate statistical significance in all tests.
The clinical laboratory assay intervals of the healthy and the diabetic participants differed with various degrees of significance (table 1). Age, body mass index, homeostasis model assessment index, fasting plasma glucose level, glycation gap, concentrations of high-sensitivity C-reactive protein, triglyceride and total cholesterol, and estimated glomerular filtration rate values were clearly increased, with various degrees of statistically significance, in participants with type 2 diabetes mellitus. Please note that the glycation gap can be either negative or positive (see also fig. 5 below).
Table 1 Baseline characteristics of healthy and diabetic participants.
|
Healthy
n = 1248 |
T2DM
n = 184 |
p-value | |
|---|---|---|---|
| Hypertensive/nonhypertensive, % | 36/64 | 53/47 | 0.02 |
| Smokers/nonsmokers, % | 6/94 | 10/90 | 0.43 |
| Women/men, % | 56/44 | 33/67 | <0.01 |
| Age, years | 71.8 (7.78) | 74.4 (7.63) | <0.001 |
| Age, range | 60–99 | 60–97 | – |
| Body mass index, kg/m2 | 25.24 (3.62) | 27.2 (4.84) | <0.001 |
| HOMA-IR | 2.11 (1.41) | 3.48 (2.70) | <0.001 |
| FPG, mmol/l | 5.25 (0.51) | 6.97 (2.39) | <0.001 |
| HbA1c, %* | 5.76 (0.32) | 6.70 (1.01) | <0.001 |
| Glycation gap | −0.11 (0.36) | 0.72 (0.92) | <0.001 |
| hsCRP, mg/l | 2.30 (3.98) | 3.24 (6.79) | <0.01 |
| Triglycerides, mmol/l | 1.36 (0.70) | 1.81 (1.39) | <0.01 |
| Total cholesterol, mmol/l | 5.82 (1.11) | 5.17 (1.13) | <0.001 |
| eGFR, ml/min/1.73 m2 | 83.4 (16.11) | 75.73 (17.80) | <0.001 |
eGFR = estimated glomerular filtration rate; FPG = fasting plasma glucose; HbA1c = glycated haemoglobin A1c; HOMA-IR = homeostasis model assessment for estimation of insulin resistance; hsCRP = high-sensitivity C-reactive protein; T2DM = type 2 diabetes mellitus Values are mean values. Differences between healthy and diabetic participants were calculated using Student’s t-test and the χ2 test, as appropriate. * International Federation of Clinical Chemistry: 39.9 mmol/mol (38.8, 39.9) for the healthy, and 49.7 (48.6, 50.8) for the diabetic participants.
In the cohort of healthy participants, men had significantly higher body mass index values, homeostasis model assessment indices for insulin resistance, and fasting plasma glucose levels than women (p <0.001), and only slightly higher estimated glomerular filtration rate values (p = 0.04), whereas total cholesterol levels were significantly increased in women (p <0.001). In accordance with this, within the type 2 diabetic participants we found slightly higher estimated glomerular filtration rate values in men than in women (p = 0.045), whereas age (p = 0.01), high-sensitivity C-reactive protein concentrations (p = 0.03) and cholesterol levels (p <0.001) were significantly higher in women. Haemoglobin concentrations did not fall below 11.0 g/dl in any of the participants.
We then explored the extent of serum protein glycation. We calculated the median values and 95% confidence intervals (CIs) separately for fasting plasma glucose level, glycated haemoglobin A1c and glycation gap. Healthy participants had a mean fasting plasma glucose level of 5.20 mmol/l (95% CI 5.20 to 5.20), a mean glycated haemoglobin A1c of 5.80% (95% CI 5.70 to 5.80), corresponding to 39.9 mmol/mol as expressed by International Federation of Clinical Chemistry units, and a mean glycation gap of −0.10 (95% CI −0.10 to −0.10). Subjects with laboratory evidence for glucose metabolism impairment, i.e. diabetic participants, had a mean fasting plasma glucose level of 6.60 mmol/l (95% CI 6.40 to 6.78), a mean glycated haemoglobin A1c of 6.70% (95% CI 6.60 to 6.80), and a mean glycation gap of 0.60 (95% CI 0.60 to 0.70).
Detailed results for the homeostasis model assessment used to estimate insulin resistance, the concentrations of high-sensitivity C-reactive protein and triglyceride, and the estimated glomerular filtration rate are presented by glycation gap category in fig. 2. In the healthy participants, homeostasis model assessment for estimation of insulin resistance, high-sensitivity C-reactive protein and triglyceride values tended to increase with glycation gap category and were highest in the glycation gap category >0.5. Likewise, the Jonckheere-Terpstra test revealed a significant trend towards higher levels in the higher glycation gap categories (p <0.001). With estimated glomerular filtration rate, however, no significant trend was apparent (p = 0.32). In the type 2 diabetic participants, homeostasis model assessment for estimation of insulin resistance, triglyceride and estimated glomerular filtration rate values tended to decrease up to a glycation gap ≤0.5, and behaved inversely in the pathological glycation gap category (glycation gap >0.5). In addition, the high-sensitivity C-reactive protein values tended to increase up to a glycation gap ≤0.5 and behaved inversely when they reached a pathological glycation gap >0.5. When the Jonckheere-Terpstra test was applied, however, no significant trend was identified (p >0.05).
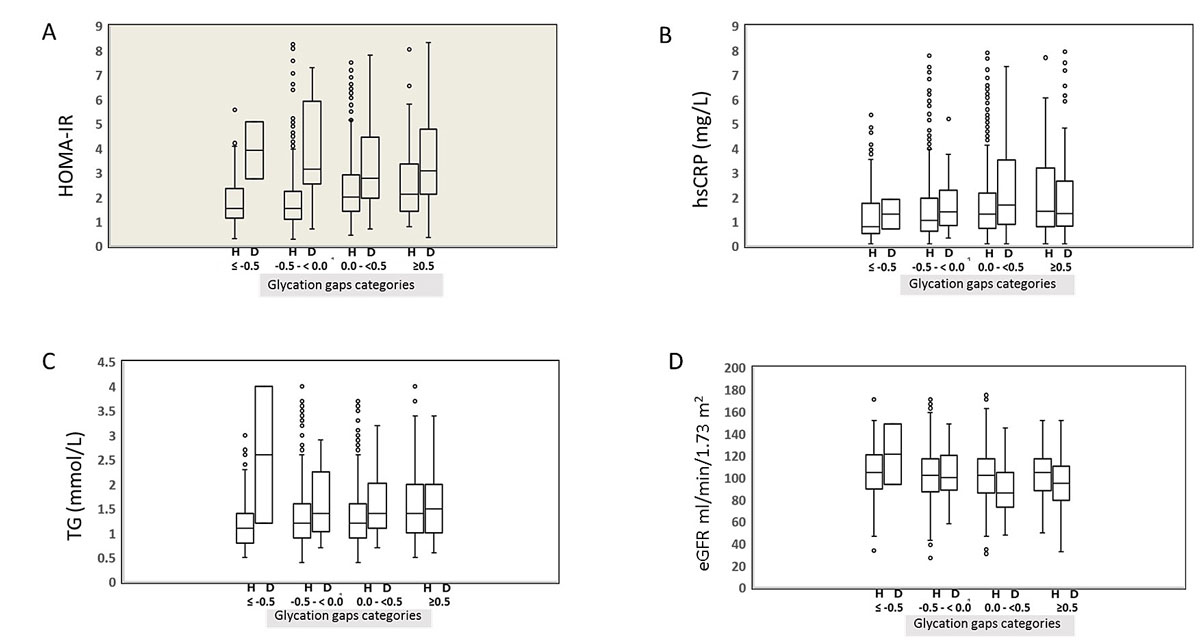
Figure 2 Variations in homeostasis model assessment for estimation of insulin resistance (HOMA-IR), high-sensitivity C-reactive protein (hsCRP), triglyceride (TG) and glomerular filtration rate levels according to glycation gap category and diabetic status.
Statistical box and whiskers diagram around median values. (A) Differences between healthy (H) and diabetic (D) participants were calculated with chi-square and Mann-Whitney tests, as appropriate; (B) hsCRP, high-sensitivity C-reactive protein; (C) TG, triglyceride; (D) GFR, glomerular filtration rate. As can be seen from the figure, in healthy participants, homeostasis model assessment for estimation of insulin resistance (HOMA-IR), high-sensitivity C-reactive protein (hsCRP) and triglyceride (TG) values increased with glycation gap category (p<0.001). In diabetic participants, differences between healthy and diabetic participants were calculated with chi-square and Mann-Whitney tests, as appropriate.
HOMA-IR, triglyceride (TG) and estimated glomerular filtration rate (eGFR) values decreased up to glycation gaps ≤0.5, and behaved inversely in the glycation gap category >0.5. High-sensitivity C-reactive protein values increased up to glycation gaps ≤0.5 and behaved inversely in the glycation gap category >0.5. Dots represent outliers of the four analytes as indicated on the ordinate.
Next, we calculated the percentage of healthy and diabetic participants in each glycation gap category. A χ2 test for trend analysis revealed a significant trend (p <0.001) towards higher glycation gap levels from the healthy to the type 2 diabetic participants. In fact, the percentage of participants with a glycation gap >0.5 increased sharply, from 2% in healthy subjects to 58% in diabetic subjects, while the percentage of participants with a glycation gap <−0.5 decreased from 11% in healthy to 1% in diabetic subjects (fig. 3). We then investigated the glycation gap values in the healthy participants according to the four baseline classifications of prediabetes (fig. 4) [35]. Using the Jonckheere-Terpstra test, we found a statistically significant trend towards lower glycation gap levels as the cumulative risk of developing diabetes decreased (p <0.001), with the highest glycation gap level in the 100% cumulative risk group (A).
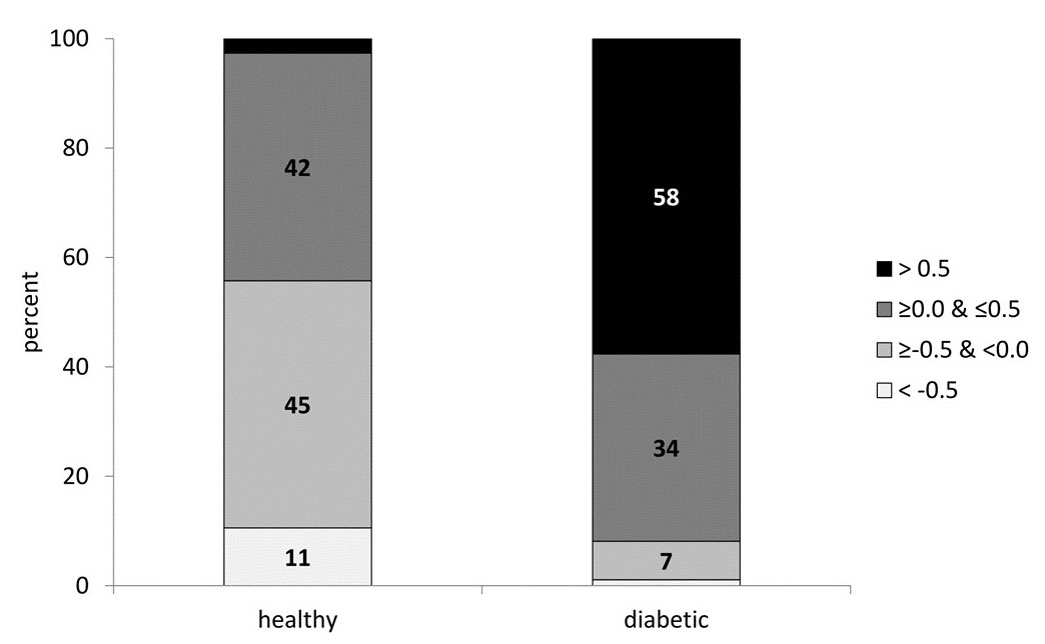
Figure 3 Percentage of participants in each glycation gap category. Diabetic participants clearly exhibited a trend towards higher glycation gap categories. The grey shading darkens as the glycation gap changes from below zero to above zero, reflecting the impairment of glycaemic control.
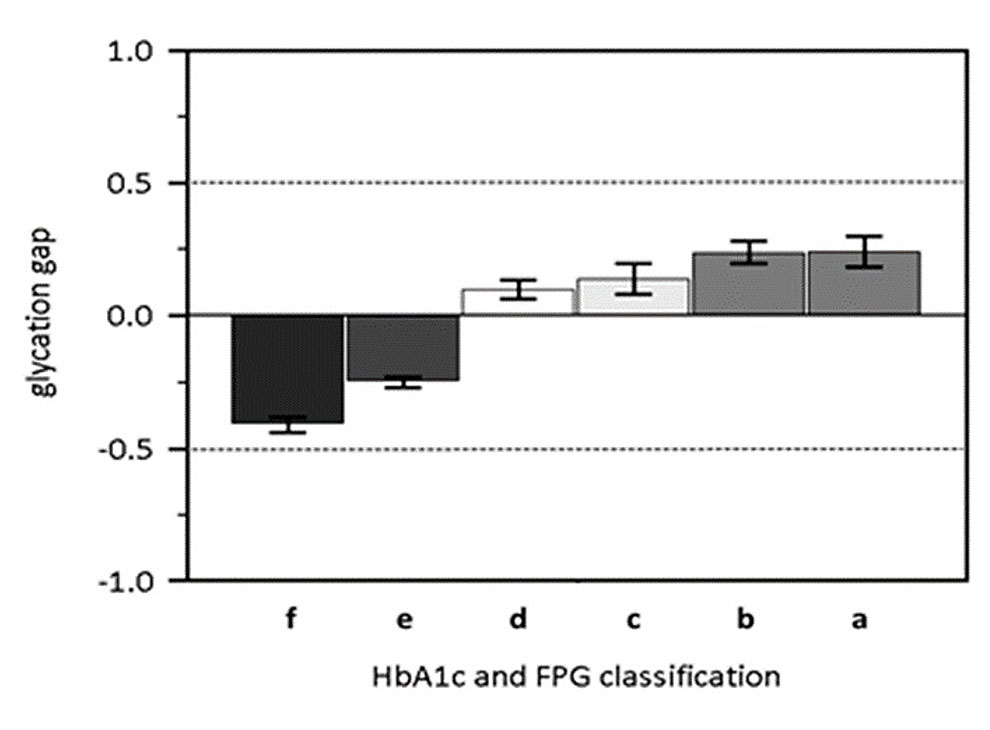
Figure 4 Glycation gap values in healthy participants, according to four baseline classifications of prediabetes defined by FPG and HbA1c (see text, [33] and [34]). Multiple combinations of FPG and HbA1c levels are used to present the glycation gap and the impairment of glycaemic control (abscissa). These combinations are: (a) HbA1c 6.0–6.4% and FPG 6.1–6.9 mmol/l, (b) HbA1c 6.0–6.4% and FPG 5.6–6.9 mmol/l, (c) HbA1c 5.7–6.4% and FPG 6.1–6.9 mmol/l, (d) HbA1c 5.7–6.4% and FPG 5.6–6.9 mmol/l, (e) HbA1c <6.0% and FPG <6.1 mmol/l, (f) HbA1c <5.7% and FPG <5.6 mmol/l.
The six alphabetic characters represent, from left to right, increasing impairment of fasting glucose. (e) and (f) are the healthy groups according to Heianza et al. [34]. Please note that the glycation gap changes from below zero to above zero as glycaemic control deteriorates. Impairment of glycaemic regulation increases from left to right.
When we analysed the extent of insulin resistance, we found 41 (3.3%) healthy and 41 (22.3%) diabetic subjects with homeostasis model assessments for estimation of insulin resistance >5.0. Of these participants, 25 (61.0%) healthy and 36 (87.8%) type 2 diabetic subjects had glycation gaps ≥0.0. With regard to hidden inflammation, 221 (17.7%) healthy and 54 (29.5%) diabetic subjects were in the higher high-sensitivity C-reactive protein level category (>3.0 mg/l) (using the Centers for Disease Control and Prevention / American Heart Association recommendations), and 121 (54.8%) healthy and 52 (96.3%) type 2 diabetic subjects were in the two glycation gap categories ≥0.0. After applying the Clinical Chemistry of Switzerland guidelines for hypertriglyceridaemia, 245 (19.6%) healthy and 66 (35.9%) type 2 diabetic participants had elevated triglyceride levels (>1.7 mmol/l), and among those participants, 128 (52.2%) healthy and 59 (89.4%) type 2 diabetic subjects were in the glycation gap categories ≥0.0. When we analysed the participants according to chronic kidney disease stage, as determined by estimated glomerular filtration rates, we found 124 (9.9%) healthy and 32 (17.4%) diabetic subjects within stage 3 or higher, and 62 (50.0%) apparently healthy and 31 (96.9%) type 2 diabetic participants were found in the glycation gap categories ≥0.0.
We then assessed associations between fasting plasma glucose level, glycated haemoglobin A1c and glycation gap through linked non-glycaemic laboratory assays (table 2 ), which are important in the diagnosis of type 2 diabetes. Using Spearman rank correlation analysis, significant correlations between homeostasis model assessment for estimation of insulin resistance and fasting plasma glucose level (p <0.001), glycated haemoglobin A1c (p <0.001), and glycation gap (p <0.001) in healthy participants became apparent. The association was strongest for fasting plasma glucose level. However, in the type 2 diabetic participants, only fasting plasma glucose level was significantly associated with homeostasis model assessment for estimation of insulin resistance (p <0.001).
Table 2 Degree of insulin resistance relating to inflammatory, lipid and kidney clinical chemistry criteria in the healthy, non-diabetic cohort (n = 1248).
| HOMA-IR | hsCRP | Triglycerides | Cholesterol | eGFR | |
|---|---|---|---|---|---|
| FPG | rs = 0.48 p <0.001 |
rs = 0.07 p = 0.02 |
rs = 0.15 p <0.001 |
rs = -0.08 p <0.01 |
rs = 0.00 p >0.05 |
| Age 60 to 69 | rs = 0.57 p <0.001 |
rs = 0.15 p <0.001 |
rs = 0.22 p <0.001 |
rs = -0.09 p = 0.04 |
rs = 0.00 p >0.05 |
| Age 70 to 79 | rs = 0.41 p <0.001 |
rs = -0.02 p >0.05 |
rs = 0.09 p = 0.04 |
rs = -0.10 p = 0.03 |
rs = 0.04 p >0.05 |
| Age ≥80 | r = 0.35 p <0.001 |
r = 0.00 p >0.05 |
r = 0.08 p >0.05 |
r = -0.04 p >0.05 |
r = 0.05 p >0.05 |
| HbA1c | rs = 0.19 p <0.001 |
rs = 0.05 p >0.05 |
rs = 0.12 p <0.001 |
rs = -0.01 p >0.05 |
rs = -0.11 p <0.001 |
| Age 60 to 69 | rs = 0.16 p <0.001 |
rs = 0.06 p >0.05 |
rs = 0.09 p = 0.046 |
rs = 0.02 p >0.05 |
rs = -0.03 p >0.05 |
| Age 70 to 79 | rs = 0.24 p <0.001 |
rs = 0.03 p >0.05 |
rs = 0.13 p <0.01 |
rs = -0.03 p >0.05 |
rs = -0.08 p >0.05 |
| Age ≥80 | r = 0.12 p >0.05 |
r = -0.03 p >0.05 |
r = 0.16 p = 0.01 |
r = -0.04 p >0.05 |
r = -0.10 p >0.05 |
| Glycation gap | rs = 0.22 p <0.001 |
rs = 0.16 p <0.001 |
rs = 0.14 p <0.001 |
rs = -0.09 p <0.01 |
rs = -0.03 p >0.05 |
| Age 60 to 69 | rs = 0.17 p <0.001 |
rs = 0.16 p <0.001 |
rs = 0.12 p = 0.01 |
rs = -0.05 p >0.05 |
rs = 0.04 p >0.05 |
| Age 70 to 79 | rs = 0.23 p <0.001 |
rs = 0.17 p <0.001 |
rs = 0.14 p <0.01 |
rs = -0.11 p = 0.02 |
rs = -0.09 p <0.05 |
| Age ≥80 | rs = 0.30 p <0.001 |
rs = 0.17 p = 0.01 |
rs = 0.20 p <0.01 |
rs = -0.14 p = 0.04 |
rs = -0.08 p >0.05 |
| p <0.001 | p <0.05 | p >0.05 | |||
eGFR = estimated glomerular filtration rate; FPG = fasting plasma glucose; HbA1c = glycated haemoglobin A1c; HOMA-IR = homeostasis model assessment for estimation of insulin resistance; hsCRP = high-sensitivity C-reactive protein HOMA-IR is a measure of insulin resistance, hsCRP reflects systemic inflammation, triglycerides and free cholesterol reflect lipid homoeostasis, and estimated glomerular filtration rate represents existing kidney function in the healthy cohort. The shading intensity goes from clear (highly significant) to darker (not significant).
Treatment with metformin may widen the glycation gap [19]. This prompted us to evaluate how many type 2 diabetic participants were treated with metformin. Out of the 184 participants with type 2 diabetes, 54 were taking antidiabetic drugs, including insulin injections, and the participants taking metformin had a mean glycation gap of 0.7%.
The measured fructosamine ranges were used to calculate the corresponding glycated haemoglobin A1c concentrations in each participant (fig. 5). It appears that within the reference interval of fructosamine used [19], glycated haemoglobin A1c values were distributed in a narrow range, whereas outside the reference interval (below or above it), this distribution spreads substantially.
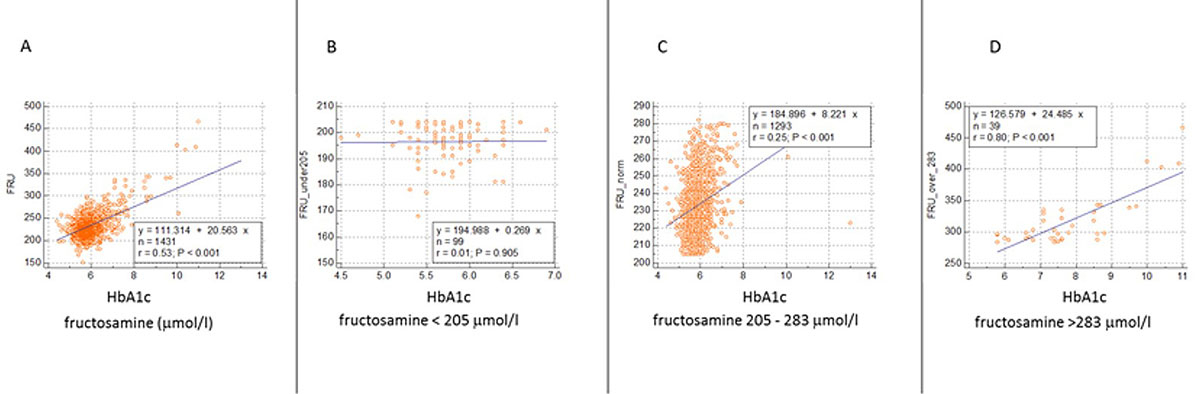
Figure 5 Relationship between fructosamine and HbA1c.
This 4-panel figure compares glycated haemoglobin A1c and fructosamine levels in three different fructosamine concentration ranges (data from 1431 participants). A all participants. B subjects with fructosamine concentrations <205 μmol/l. The glycated haemoglobin A1c values range from 4.5% to 7.0%. C Participants exhibiting fructosamine values within the reference interval. Glycated haemoglobin A1c values are within a narrow window. D individuals with high fructosamine levels have glycated haemoglobin A1c values between 5.8% and 11%.
In the healthy cohort, fasting plasma glucose level was significantly correlated with high-sensitivity C-reactive protein (p = 0.02), triglyceride (p <0.001) and total cholesterol (p <0.01) levels. Furthermore, glycated haemoglobin A1c was significantly correlated with triglyceride concentration (p <0.001) and estimated glomerular filtration rate (p <0.001). When we analysed the glycation gap among the healthy participants, we found additional associations with high-sensitivity C-reactive protein (p <0.001), triglyceride (p <0.001) and total cholesterol (p <0.01) concentrations (table 2). The correlation analyses for homeostasis model assessment for estimation of insulin resistance and the high-sensitivity C-reactive protein, triglyceride and total cholesterol concentrations were performed separately for three arbitrarily defined age groups: 60–69 years, 70–79 years and ≥80 years. As can be seen from table 2, triglyceride levels were most strongly associated with fasting plasma glucose levels, whereas estimated glomerular filtration rate was most strongly associated with glycated haemoglobin A1c in the age group >80 years.
In a quest to establish reference intervals for the selected clinical chemistry parameters, including those relevant to the diagnosis of type 2 diabetes, we recruited healthy residents with presumably uniform lifestyles and dietary patterns [36]. Swiss plateau nutritional habits typically include the consumption of dairy products and predictable proportions of protein, fat and carbohydrates. This means the participants have comparable glycation exposure of tissues and proteins, including the blood plasma components accessible for laboratory assays.
The estimation of the glycation gap and fructosamine levels [37] has been used in longitudinal studies to predict complications of diabetes [38], but it also has the potential for use in patient care and for the monitoring of therapeutic regimens. In other evaluations of SENIORLABOR data, we have excluded participants treated for type 2 diabetes mellitus or with laboratory evidence of metabolic disease. In this study, however, they are included, and their laboratory values are reported and also analysed in relationship to the healthy cohort, representing the SENIORLABOR confidence intervals. It is possible that biological variation has had an influence on the interpretation of our report, but its effect is minimised by the large number of subjects recruited and the resulting statistical power. Variation exists within consecutive measurements of many laboratory parameters in the same individual (www.eflm.eu/) [39–41]. It comes as little surprise that the conventional separators between healthy and diabetic individuals, i.e., fasting plasma glucose, glycated haemoglobin A1c and homoeostasis model assessment for insulin resistance values, were highly significantly different between the two groups. Our data further separate the two groups by triglyceride and total cholesterol concentrations and estimated glomerular filtration rates. As expected, we observed that neither glycation gap nor HbA1c were associated with chronic kidney disease in nondiabetic individuals [22]. We also now report for the first time the robust physiological importance of the glycation gap in this context. Our results indicate that healthy elderly individuals display a significant direct relationship between glycation gap and homeostasis model assessment-measured insulin resistance, high-sensitivity C-reactive protein levels, and triglyceride concentrations, and that this relationship is much stronger than that between these parameters and glycated haemoglobin A1c or fasting plasma glucose levels. This fact strongly challenges the idea that the glycation gap is a spurious empirical measure of the disagreement between the two indirect estimates of glycaemic control.
Such an understanding of glycation gap requires an appreciation of the fact that carbohydrate metabolism, even when monitored by continuous glucose monitoring, involves additional players, i.e. deglycation enzymes, erythrocytic processes such as the mean red blood cell age, and glucokinase mutations [12, 42–44].
Expert associations, such as the American Diabetes Association or the International Diabetes Federation, currently focus on precision medicine based on a large selection of laboratory assays, the ratios among them, and are integral part of such big data sets. Metabolic syndrome encompasses stages of diabetes mellitus, hypertriglyceridaemia and hypertension, and it also might involve HNF1 homeobox B, which controls transcription factors such as tumour necrosis factor-1α in the context of immunological changes in type 2 diabetes mellitus [45]. The cohort of SENIORLABOR is homogenous by race, allowing us to exclude the impact of ethnic/major genetic diversity, which is known to play a role in maturity onset diabetes of the young (www.diabetesgenes.org), as this won’t have a substantial influence on fasting glucose changes over time in non-diabetic individuals of European descent [46]. The performance of the pancreatic glucose sensor might influence the pattern of our results. We used homeostasis model assessment to assess insulin resistance, which is known to increase with aging. The effect of age was previously analysed separately in individuals with and without type 2 diabetes [25, 47]. This analysis also revealed gender differences in homeostasis model assessment for estimation of insulin resistance cut-off values in non-diabetic women of 19% when using the Youden Index. We here describe these gender differences without offering an explanation. Whereas disciplined nutritional habits can be assumed in the examined study population, the limited increments in HbA1c values observed here might be caused by anti-diabetic drug overdosage or one of the following enhancers/depressors of HbA1c results: haemoglobin gene variations, even when clinically silent [48], mild haemolytic anaemia, or folic acid deficiency. Thus, the pilot Spanish epidemiology of chronic renal disease cross-sectional study [47] is consistent with the present findings of a clear distinction between female and male metabolisms. The Adult Treatment Panel III criteria for metabolic syndrome include: abdominal obesity (given as waist circumference >102 cm for men and >88 cm for women), high-density lipoprotein-associated cholesterol (men <1.0 mmol/l, women <1.3 mmol/l), blood pressure ≥130/≥85 mm Hg, fasting plasma glucose ≥6.1 mmol/l, and triglyceride concentration ≥1.7 mmol/l. Being overweight or obese is also associated with insulin resistance and the diagnosis of metabolic syndrome [49].
Our separate consideration of four categories of glycation gap, i.e., two below and two above zero, was borrowed from earlier studies. We choose this method in order to draw an error grid [38] and made it clear that the incremental values from negative to positive indicated progression from a healthy to a diabetic metabolism. This finding presents evidence that the glycation gap is affected by the glycation of both short-lived and long-lived proteins and reflects current and past glycation history.
One limitation to our study is the current uncertainty about the best method for measuring glycation, e.g., by high-power liquid chromatography, capillary electrophoresis or immunological and enzymatic assays controlled by reference laboratorys [50]. More recently, the constitution of the glycated haemoglobin has been scrutinised as a previously unknown influence on glycated haemoglobin A1c results. Racial differences also affect this variable [48]. Efforts to comply with International Federation of Clinical Chemistry reference systems and to improve biosensing methods are maintained though [14]. Indeed, the nitroblue tetrazolium reduction we used consists of reducing analytes commonly named ‘fructosamine’, but nitroblue tetrazolium is also an active oxygen species that produces a formazan dye which any unbound sugar molecule in the sample would convert. Some researchers prefer the measurement of glycated albumin, which is largely in agreement with fructosamine [51]. The need to improve the management of diabetes makes advances in measurement technology for glycated proteins necessary. It has been suggested that variations in the level of the deglycating enzyme fructosamine-3-kinase, with its genetic locus, play a role in glycation gap variations [52].
The uneven distribution of the non-diabetic and type 2 diabetes mellitus patients and the low number of type 2 diabetes patients in the negative glycation gap categories may have led to underestimates of the below zero categories in such patients. It also allows us to assume that HbA1c [53] remains a more reliable risk predictor than glycation gap alone [53, 54].
Alcohol consumption above one drink (10 g alcohol) daily was an exclusion criterion for this study. Hence, the effects of downstream sequelae of hepatic insulin resistance-implicating lipid species such as triglyceride, inflammatory signalling or other modifications [55] on the homeostasis model assessment for insulin resistance here observed cannot be excluded.
In conclusion, appreciation of the uneven chemical protein-based glycoconjugation of N-terminal glycation during senescence and along different degrees of glucose metabolism impairment remains in focus thanks to improved laboratory technology. It remains inappropriate, from the data presented here, to propose glycation gap measurements for clinical care, although glycation gap and HbA1c measurements point to a difference between HbA1c and other measures of mean glycaemia [20]. This confers on the glycation gap and its calculation a meaning regarding the appreciation of the homoeostasis of glucose metabolism. New markers for metabolic abnormalities now include the glycation gap, and studying the extent of glycation, up to advanced glycation end products, might help to distinguish biological from chronological aging [56–58].
The ongoing SENIORLABOR study is made possible through an in-house grant.
None of the co-authors have any conflicts of interest to declare.
1 Vetter SW . Glycated Serum Albumin and AGE Receptors. Adv Clin Chem. 2015;72:205–75. doi:.https://doi.org/10.1016/bs.acc.2015.07.005
2 Jensen JL , Indurthi VS , Neau DB , Vetter SW , Colbert CL . Structural insights into the binding of the human receptor for advanced glycation end products (RAGE) by S100B, as revealed by an S100B-RAGE-derived peptide complex. Acta Crystallogr D Biol Crystallogr. 2015;71(Pt 5):1176–83. doi:.https://doi.org/10.1107/S1399004715004216
3 Haji-Ghassemi O , Blackler RJ , Martin Young N , Evans SV . Antibody recognition of carbohydrate epitopes. Glycobiology. 2015;25(9):920–52. doi:.https://doi.org/10.1093/glycob/cwv037
4 Frank F , Bezold V , Bork K , Rosenstock P , Scheffler J , Horstkorte R . Advanced glycation endproducts and polysialylation affect the turnover of the neural cell adhesion molecule (NCAM) and the receptor for advanced glycation endproducts (RAGE). Biol Chem. 2019;400(2):219–26. doi:.https://doi.org/10.1515/hsz-2018-0291
5 Mariño L , Casasnovas R , Ramis R , Vilanova B , Ortega-Castro J , Frau J , et al. Does glycation really distort the peptide α-helicity? Int J Biol Macromol. 2019;129:254–66. doi:.https://doi.org/10.1016/j.ijbiomac.2019.01.213
6 Su D , Zhao H , Xia H . Glycosylation-modified erythropoietin with improved half-life and biological activity. Int J Hematol. 2010;91(2):238–44. doi:.https://doi.org/10.1007/s12185-010-0496-x
7 Kurcon T , Liu Z , Paradkar AV , Vaiana CA , Koppolu S , Agrawal P , et al. miRNA proxy approach reveals hidden functions of glycosylation. Proc Natl Acad Sci USA. 2015;112(23):7327–32. doi:.. Corrections in: Proc Natl Acad Sci USA. 2015;112(33):E4631. Proc Natl Acad Sci USA. 2015;112(33):E4632–5 https://doi.org/10.1073/pnas.1502076112
8 Goldin A , Beckman JA , Schmidt AM , Creager MA . Advanced glycation end products: sparking the development of diabetic vascular injury. Circulation. 2006;114(6):597–605. doi:.https://doi.org/10.1161/CIRCULATIONAHA.106.621854
9 Shastri S , Katz R , Rifkin DE , Fried LF , Odden MC , Peralta CA , et al. Kidney function and mortality in octogenarians: Cardiovascular Health Study All Stars. J Am Geriatr Soc. 2012;60(7):1201–7. doi:.https://doi.org/10.1111/j.1532-5415.2012.04046.x
10 Bansal N , Katz R , De Boer IH , Peralta CA , Fried LF , Siscovick DS , et al. Development and validation of a model to predict 5-year risk of death without ESRD among older adults with CKD. Clin J Am Soc Nephrol. 2015;10(3):363–71. doi:.https://doi.org/10.2215/CJN.04650514
11 Frasca D , Blomberg BB . Inflammaging decreases adaptive and innate immune responses in mice and humans. Biogerontology. 2016;17(1):7–19. doi:.https://doi.org/10.1007/s10522-015-9578-8
12 Campbell L , Pepper T , Shipman K . HbA1c: a review of non-glycaemic variables. J Clin Pathol. 2019;72(1):12–9. doi:.https://doi.org/10.1136/jclinpath-2017-204755
13 Jaisson S , Leroy N , Guillard E , Desmons A , Gillery P . Analytical performances of the D-100TM hemoglobin testing system (Bio-Rad) for HbA1c assay. Clin Chem Lab Med. 2015;53(9):1473–9. doi:.https://doi.org/10.1515/cclm-2015-0288
14 Kameya M , Sakaguchi-Mikami A , Ferri S , Tsugawa W , Sode K . Advancing the development of glycated protein biosensing technology: next-generation sensing molecules. J Diabetes Sci Technol. 2015;9(2):183–91. doi:.https://doi.org/10.1177/1932296814565784
15 Nansseu JR , Fokom-Domgue J , Noubiap JJ , Balti EV , Sobngwi E , Kengne AP . Fructosamine measurement for diabetes mellitus diagnosis and monitoring: a systematic review and meta-analysis protocol. BMJ Open. 2015;5(5):e007689. doi:.https://doi.org/10.1136/bmjopen-2015-007689
16 Selvin E , Rawlings AM , Lutsey PL , Maruthur N , Pankow JS , Steffes M , et al. Fructosamine and Glycated Albumin and the Risk of Cardiovascular Outcomes and Death. Circulation. 2015;132(4):269–77. doi:.https://doi.org/10.1161/CIRCULATIONAHA.115.015415
17 Akatsuka J , Mochizuki M , Musha I , Ohtake A , Kobayashi K , Kikuchi T , et al.; Japanese Study Group of Insulin Therapy for Childhood and Adolescent Diabetes. The ratio of glycated albumin to hemoglobin A1c measured in IFCC units accurately represents the glycation gap. Endocr J. 2015;62(2):161–72. doi:.https://doi.org/10.1507/endocrj.EJ14-0066
18 Cohen RM , Holmes YR , Chenier TC , Joiner CH . Discordance between HbA1c and fructosamine: evidence for a glycosylation gap and its relation to diabetic nephropathy. Diabetes Care. 2003;26(1):163–7. doi:.https://doi.org/10.2337/diacare.26.1.163
19 Zafon C , Ciudin A , Valladares S , Mesa J , Simó R . Variables involved in the discordance between HbA1c and fructosamine: the glycation gap revisited. PLoS One. 2013;8(6):e66696. doi:.https://doi.org/10.1371/journal.pone.0066696
20 Nayak AU , Singh BM , Dunmore SJ . Potential Clinical Error Arising From Use of HbA1c in Diabetes: Effects of the Glycation Gap. Endocr Rev. 2019;40(4):988–99. doi:.https://doi.org/10.1210/er.2018-00284
21 Rodríguez-Segade S , Rodríguez J , García Lopez JM , Casanueva FF , Camiña F . Estimation of the glycation gap in diabetic patients with stable glycemic control. Diabetes Care. 2012;35(12):2447–50. doi:.https://doi.org/10.2337/dc11-2450
22 Shipman KE , Jawad M , Sullivan KM , Ford C , Gama R . The glycation gap and estimated glomerular filtration rate in individuals without diabetes mellitus. Clin Chem. 2014;60(10):1346–7. doi:.https://doi.org/10.1373/clinchem.2014.223545
23 Wu L , Parhofer KG . Diabetic dyslipidemia. Metabolism. 2014;63(12):1469–79. doi:.https://doi.org/10.1016/j.metabol.2014.08.010
24 Keane KN , Cruzat VF , Carlessi R , de Bittencourt PI, Jr , Newsholme P . Molecular Events Linking Oxidative Stress and Inflammation to Insulin Resistance and β-Cell Dysfunction. Oxid Med Cell Longev. 2015;2015:181643. doi:.https://doi.org/10.1155/2015/181643
25 Medina Escobar P , Moser M , Risch L , Risch M , Nydegger UE , Stanga Z . Impaired glucose metabolism and type 2 diabetes in apparently healthy senior citizens. Swiss Med Wkly. 2015;145:w14209.
26FOPH. Swiss Nutrition Report. In.; 2012.
27 Braga F , Panteghini M . Standardization and analytical goals for glycated hemoglobin measurement. Clin Chem Lab Med. 2013;51(9):1719–26. doi:.https://doi.org/10.1515/cclm-2013-0060
28 Rodriguez-Segade S , Rodriguez J , García-López JM , Casanueva FF , Coleman IC , Alonso de la Peña C , et al. Influence of the glycation gap on the diagnosis of type 2 diabetes. Acta Diabetol. 2015;52(3):453–9. doi:.https://doi.org/10.1007/s00592-014-0666-z
29 Genest J , McPherson R , Frohlich J , Anderson T , Campbell N , Carpentier A , et al. 2009 Canadian Cardiovascular Society/Canadian guidelines for the diagnosis and treatment of dyslipidemia and prevention of cardiovascular disease in the adult - 2009 recommendations. Can J Cardiol. 2009;25(10):567–79. doi:.https://doi.org/10.1016/S0828-282X(09)70715-9
30 Inker LA , Eckfeldt J , Levey AS , Leiendecker-Foster C , Rynders G , Manzi J , et al. Expressing the CKD-EPI (Chronic Kidney Disease Epidemiology Collaboration) cystatin C equations for estimating GFR with standardized serum cystatin C values. Am J Kidney Dis. 2011;58(4):682–4. doi:.https://doi.org/10.1053/j.ajkd.2011.05.019
31 Inker LA , Schmid CH , Tighiouart H , Eckfeldt JH , Feldman HI , Greene T , et al.; CKD-EPI Investigators. Estimating glomerular filtration rate from serum creatinine and cystatin C. N Engl J Med. 2012;367(1):20–9. doi:.https://doi.org/10.1056/NEJMoa1114248
32 Salazar J , Martínez MS , Chávez M , Toledo A , Añez R , Torres Y , et al. C-reactive protein: clinical and epidemiological perspectives. Cardiol Res Pract. 2014;2014:605810. doi:.https://doi.org/10.1155/2014/605810
33 American Diabetes Association. Standards of medical care in diabetes--2014. Diabetes Care. 2014;37(Suppl 1):S14–80. doi:.https://doi.org/10.2337/dc14-S014
34 Heianza Y , Arase Y , Fujihara K , Tsuji H , Saito K , Hsieh SD , et al. Screening for pre-diabetes to predict future diabetes using various cut-off points for HbA1c and impaired fasting glucose: the Toranomon Hospital Health Management Center Study 4 (TOPICS 4). Diabet Med. 2012;29(9):e279–85. doi:.https://doi.org/10.1111/j.1464-5491.2012.03686.x
35 Heianza Y , Arase Y , Hsieh SD , Saito K , Tsuji H , Kodama S , et al. Development of a new scoring system for predicting the 5 year incidence of type 2 diabetes in Japan: the Toranomon Hospital Health Management Center Study 6 (TOPICS 6). Diabetologia. 2012;55(12):3213–23. doi:.https://doi.org/10.1007/s00125-012-2712-0
36 Kashino I , Nanri A , Kurotani K , Akter S , Yasuda K , Sato M , et al. Association of dietary patterns with serum adipokines among Japanese: a cross-sectional study. Nutr J. 2015;14(1):58. doi:.https://doi.org/10.1186/s12937-015-0046-8
37 Malmström H , Walldius G , Grill V , Jungner I , Gudbjörnsdottir S , Hammar N . Fructosamine is a useful indicator of hyperglycaemia and glucose control in clinical and epidemiological studies--cross-sectional and longitudinal experience from the AMORIS cohort. PLoS One. 2014;9(10):e111463. doi:.https://doi.org/10.1371/journal.pone.0111463
38 Nayak AU , Nevill AM , Bassett P , Singh BM . Association of glycation gap with mortality and vascular complications in diabetes. Diabetes Care. 2013;36(10):3247–53. doi:.https://doi.org/10.2337/dc12-1040
39 Bartlett WA , Braga F , Carobene A , Coşkun A , Prusa R , Fernandez-Calle P , et al.; Biological Variation Working Group, European Federation of Clinical Chemistry and Laboratory Medicine (EFLM). A checklist for critical appraisal of studies of biological variation. Clin Chem Lab Med. 2015;53(6):879–85. doi:.https://doi.org/10.1515/cclm-2014-1127
40 Mosca A , Lapolla A , Gillery P . Glycemic control in the clinical management of diabetic patients. Clin Chem Lab Med. 2013;51(4):753–66. doi:.https://doi.org/10.1515/cclm-2012-0594
41 Sartore G , Chilelli NC , Burlina S , Di Stefano P , Piarulli F , Fedele D , et al. The importance of HbA1c and glucose variability in patients with type 1 and type 2 diabetes: outcome of continuous glucose monitoring (CGM). Acta Diabetol. 2012;49(S1, Suppl 1):S153–60. doi:.https://doi.org/10.1007/s00592-012-0391-4
42 Cohen RM , Franco RS , Khera PK , Smith EP , Lindsell CJ , Ciraolo PJ , et al. Red cell life span heterogeneity in hematologically normal people is sufficient to alter HbA1c. Blood. 2008;112(10):4284–91. doi:.https://doi.org/10.1182/blood-2008-04-154112
43 Khera PK , Smith EP , Lindsell CJ , Rogge MC , Haggerty S , Wagner DA , et al. Use of an oral stable isotope label to confirm variation in red blood cell mean age that influences HbA1c interpretation. Am J Hematol. 2015;90(1):50–5. doi:.https://doi.org/10.1002/ajh.23866
44 Steele AM , Wensley KJ , Ellard S , Murphy R , Shepherd M , Colclough K , et al. Use of HbA1c in the identification of patients with hyperglycaemia caused by a glucokinase mutation: observational case control studies. PLoS One. 2013;8(6):e65326. doi:.https://doi.org/10.1371/journal.pone.0065326
45 Donath MY , Shoelson SE . Type 2 diabetes as an inflammatory disease. Nat Rev Immunol. 2011;11(2):98–107. doi:.https://doi.org/10.1038/nri2925
46 Liu CT , Merino J , Rybin D , DiCorpo D , Benke KS , Bragg-Gresham JL , et al. Genome-wide Association Study of Change in Fasting Glucose over time in 13,807 non-diabetic European Ancestry Individuals. Sci Rep. 2019;9(1):9439. doi:.https://doi.org/10.1038/s41598-019-45823-7
47 Gayoso-Diz P , Otero-González A , Rodriguez-Alvarez MX , Gude F , García F , De Francisco A , et al. Insulin resistance (HOMA-IR) cut-off values and the metabolic syndrome in a general adult population: effect of gender and age: EPIRCE cross-sectional study. BMC Endocr Disord. 2013;13(1):47. doi:.https://doi.org/10.1186/1472-6823-13-47
48 Klonoff DC . Hemoglobinopathies and Hemoglobin A1c in Diabetes Mellitus. J Diabetes Sci Technol. 2019:1932296819841698. doi:.https://doi.org/10.1177/1932296819841698
49 Johnson AMF , Olefsky JM . The origins and drivers of insulin resistance. Cell. 2013;152(4):673–84. doi:.https://doi.org/10.1016/j.cell.2013.01.041
50 Lenters-Westra E , English E . Evaluating new HbA1c methods for adoption by the IFCC and NGSP reference networks using international quality targets. Clin Chem Lab Med. 2017;55(9):1426–34. doi:.https://doi.org/10.1515/cclm-2017-0109
51 Danese E , Montagnana M , Nouvenne A , Lippi G . Advantages and pitfalls of fructosamine and glycated albumin in the diagnosis and treatment of diabetes. J Diabetes Sci Technol. 2015;9(2):169–76. doi:.https://doi.org/10.1177/1932296814567227
52 Dunmore SJ , Al-Derawi AS , Nayak AU , Narshi A , Nevill AM , Hellwig A , et al. Evidence That Differences in Fructosamine-3-Kinase Activity May Be Associated With the Glycation Gap in Human Diabetes. Diabetes. 2018;67(1):131–6. doi:.https://doi.org/10.2337/db17-0441
53 Rawshani A , Rawshani A , Franzén S , Sattar N , Eliasson B , Svensson AM , et al. Risk Factors, Mortality, and Cardiovascular Outcomes in Patients with Type 2 Diabetes. N Engl J Med. 2018;379(7):633–44. doi:.https://doi.org/10.1056/NEJMoa1800256
54 Sacks DB , Nathan DM , Lachin JM . Gaps in the glycation gap hypothesis. Clin Chem. 2011;57(2):150–2. doi:.https://doi.org/10.1373/clinchem.2010.158071
55 Perry RJ , Samuel VT , Petersen KF , Shulman GI . The role of hepatic lipids in hepatic insulin resistance and type 2 diabetes. Nature. 2014;510(7503):84–91. doi:.https://doi.org/10.1038/nature13478
56 Tamura Y , Izumiyama-Shimomura N , Kimbara Y , Nakamura K , Ishikawa N , Aida J , et al. β-cell telomere attrition in diabetes: inverse correlation between HbA1c and telomere length. J Clin Endocrinol Metab. 2014;99(8):2771–7. doi:.https://doi.org/10.1210/jc.2014-1222
57 Dubowitz N , Xue W , Long Q , Ownby JG , Olson DE , Barb D , et al. Aging is associated with increased HbA1c levels, independently of glucose levels and insulin resistance, and also with decreased HbA1c diagnostic specificity. Diabet Med. 2014;31(8):927–35. doi:.https://doi.org/10.1111/dme.12459
58 Chaudhuri J , Bains Y , Guha S , Kahn A , Hall D , Bose N , et al. The Role of Advanced Glycation End Products in Aging and Metabolic Diseases: Bridging Association and Causality. Cell Metab. 2018;28(3):337–52. doi:.https://doi.org/10.1016/j.cmet.2018.08.014
Contributed equally
PME, BS and CG carried out the analysis of the database and calculated the statistical evaluations; they helped writing the paper. UEN helped write the paper and chose the appropriate references. LR helped write the paper and was instrumental in setting up the figures. MR helped validate the paper and was instrumental in setting up tables and figures. ZS helped write the paper and validated the clinical classification of the included/excluded participants.
The ongoing SENIORLABOR study is made possible through an in-house grant.
None of the co-authors have any conflicts of interest to declare.