
Figure 1 Model states and transitions.
DOI: https://doi.org/10.4414/smw.2019.20170
Lung cancer accounts for approximately 3200 deaths in Switzerland per year [1]. Eighty-five percent of lung cancers are of the non-small cell form (NSCLC) [2], and 46% of NSCLC cases present with metastatic disease (stage 4) upon initial diagnosis [3].
Immunotherapy drugs belonging to the programmed death-1 (PD-1) inhibitor class, such as the humanised antibodies pembrolizumab (Keytruda) and nivolumab, are recent new treatments for NSCLC and other cancers. They work through a novel mechanism of action involving blocking the interaction between the programmed death ligand-1 (PD-L1) protein on tumour cells and the PD-1 protein on immune (T) cells, so that the T cells remain activated and can kill the tumour cells [4]. Pembrolizumab has received Swiss regulatory approval and is reimbursed in Switzerland for patients with previously untreated metastatic NSCLC with a PD-L1 tumour proportion score (TPS) ≥50% and no sensitising epidermal growth factor receptor (EGFR) mutation or anaplastic lymphoma kinase (ALK) translocation [5].
The KEYNOTE-024 trial in patients with previously untreated metastatic NSCLC demonstrated a significant improvement in overall and progression-free survival for patients receiving pembrolizumab compared with patients receiving a platinum-based chemotherapy regimen [6, 7]. A previous cost-utility analysis found pembrolizumab was likely to be cost effective as first-line treatment of metastatic NSCLC for US patients [8]. The aim of the present study was to answer this question for Switzerland. We used Swiss costs and long-term survival data, and KEYNOTE-024 trial data to assess cost effectiveness of first-line pembrolizumab monotherapy compared with platinum-based chemotherapy in patients with previously untreated metastatic NSCLC with PD-L1 TPS of ≥50% in Switzerland.
A partitioned survival model, adapted from a previous USA-based analysis [8], was used to project costs and outcomes over 20 years for pembrolizumab and chemotherapy. Incremental cost-effectiveness ratios (ICERs) in the form of incremental cost per quality-adjusted life year (QALY) gained and per life year gained were calculated. The model was developed and implemented in Microsoft Excel 2010.
The model was populated with effectiveness and resource-use parameters primarily estimated directly from KEYNOTE-024 trial data [7]. The KEYNOTE-024 trial was used for the model as this is the only randomised controlled trial that has assessed pembrolizumab monotherapy only for NSCLC patients with PD-L1 ≥50% [6, 9]. For the base-case analyses, we assumed the same treatment regimens used in the trial, as alternative regimens and doses might result in a different treatment effect, which is unknown. Nevertheless, we consulted with Swiss clinical experts to establish a more realistic distribution of treatments in Switzerland, which was considered in secondary analyses. Furthermore, we used long-term Swiss cancer registry data to implement a constant, equivalent mortality rate after 5 years for both treatment strategies. We did this as evidence shows that if Swiss metastatic NSCLC patients are alive 5 years after initiation of first-line treatment, the survival rate thereafter is markedly different from the rate before 5 years [10], so that the parametric probabilities derived from trial data have less relevance after 5 years. Effectiveness estimates, proportions of adverse events occurring in trial patients and patients’ self-reported EQ-5D-3L scores were derived from the KEYNOTE-024 trial, with a cut-off date of 9 May 2016. Costs (in CHF, year 2018) of drug acquisition/administration, adverse events and disease management were included. Unit cost parameters were primarily obtained from the following Swiss data sources: Spezialitätenliste (list of specialties) for drug costs [5] and Swiss Diagnosis-Related Groups (DRG) statistics for inpatient treatment costs due to adverse events [11]. Some cost parameters were not available from these databases; in this situation we undertook literature searches or contacted Swiss experts to determine their values.
A time horizon of 20 years was used for the base-case analysis, in order to capture most future costs and outcomes associated with the treatment strategies. In a scenario analysis we evaluated alternative time horizons of 5, 10 and 30 years to evaluate the sensitivity of model results to the time horizon chosen. An annual discount rate of 3% for costs and QALYs was used for the base-case analysis, with alternative rates of 0% and 6% used in secondary analyses. Analyses were conducted from the Swiss healthcare payer perspective. Contributions from Swiss patients, insurers, the cantons and government are reflected in this perspective.
No specific ethical approval was obtained for this study, as the present economic model did not involve recruitment of human or animal subjects or collection of research samples.
A partitioned survival model consisting of three health states (progression-free disease, progressive disease and death) was used to evaluate costs and outcomes for the two treatment strategies (fig. 1). The population in the model is based on KEYNOTE-024 participants who were adult patients (mean age of 64 years) with metastatic stage 4 NSCLC expressing PD-L1 TPS ≥50% and baseline ECOG (Eastern Cooperative Oncology Group) performance status of 0 or 1, without EGFR-activating mutations or ALK translocations, and who had not previously received systemic chemotherapy for NSCLC [7]. We also conducted a secondary analysis of a “test and treat” strategy, where we evaluated the entire population of metastatic NSCLC patients, with first-line pembrolizumab treatment only administered to the proportion of metastatic NSCLC patients with PD-L1 TPS ≥50% determined by a PD-L1 test; this proportion in the KEYNOTE-024 trial was 30% [7].
Figure 1 Model states and transitions.
In KEYNOTE-024, patients in the pembrolizumab arm received a 200 mg intravenous dose of pembrolizumab once every 3 weeks for up to 2 years (35 cycles) [7], which is consistent with pembrolizumab marketing authorisation in Switzerland [12]. Chemotherapy patients received platinum-based chemotherapy every 3 weeks for four to six cycles (four cycles is usually a valid treatment option although some patients may receive one or two additional cycles if they respond well) [13]. Forty-four percent of chemotherapy patients received pemetrexed + carboplatin, 24% received pemetrexed + cisplatin, 21% received platinum + gemcitabine and 11% received paclitaxel + carboplatin [7]. This distribution of patients across chemotherapy regimens was used for the base-case analysis. Chemotherapy patients on a regimen not containing gemcitabine were eligible to receive optional pemetrexed maintenance therapy as part of their first-line treatment after completing four to six treatment cycles of their main chemotherapy regimen if they had non-squamous disease and were still progression free. We also undertook one secondary analysis where we reset the proportion of patients receiving paclitaxel and carboplatin to 0% and redistributed them proportionally among the other chemotherapy options, as we were advised by a Swiss clinical expert that this is a rarely used chemotherapy regimen for NSCLC in Switzerland.
Generally, treatment was continued for the specified number of cycles, or until documented disease progression, patient withdrawal, investigator decision or intolerable toxicity. The exception to this was that some pembrolizumab patients continued to receive the drug after disease progression if they had clinically stable disease, had not exceeded the maximum treatment duration of 2 years and were considered by the investigator to be still deriving clinical benefit from pembrolizumab [7]. Documented disease progression was established by the investigating team according to RECIST (Response Evaluation Criteria in Solid Tumors) version 1.1 [7]. Chemotherapy patients were eligible to switch to receive pembrolizumab following a 30-day interval after their final chemotherapy treatment, if they had documented disease progression, an ECOG score of 0 and 1 and did not stop chemotherapy for any reason other than their disease having become progressive.
Model effectiveness parameters were based on KEYNOTE-024 data on time-on-treatment, progression-free survival and overall survival (table 1) [8]. Parametric models were fitted to the Kaplan-Meier (KM) trial data for time-on-treatment, progression-free survival and overall survival as a basis for extrapolating effectiveness estimates from the short-term trial period (median follow-up of 11.3 months), to a 20 year period [8]. The parametric models that were used are exactly the same models as those used for the US analysis [8], and UK National Institute for Health Care and Excellence (NICE) Decision Support Unit guidelines were followed in fitting and selection of the models [15]. The AIC (Akaike information criterion) and BIC (Bayesian information criterion) statistical tests combined with visual inspection of closeness of parametric curves to Kaplan-Meier plots were used to select each base-case parametric model from the options: exponential, Weibull, Gompertz, log-logistic, log normal and generalised gamma (see supplementary table S4 in appendix 1). The clinical plausibility of the models was then analysed by health economists and clinicians before determining final models used [8].
Table 1 Key model parameters.
| Modelled strategy | Overall survival | Progression-free survival | Time-on-treatment (first-line) | |||||
|---|---|---|---|---|---|---|---|---|
| Pembrolizumab | KM probabilities up to 32 weeks, exponential distribution from 32 weeks to year 5 (intercept = 5.323), NICER data from years 5 to 20*. | KM probabilities up to week 9, Weibull distribution from week 9 to year 20 (intercept = 4.772, ln(scale) = 0.385) | Weibull distribution (intercept = 4.348, ln(scale) = 0.57) (with cap after 2 years) | |||||
| Chemotherapy | KM probabilities up to 38 weeks, exponential distribution from 38 weeks to year 5 (intercept = 4.788), NICER data from years 5 to 20. | KM probabilities up to week 9, exponential distribution from week 9 to year 20 (intercept = 3.262) | Generalised gamma distribution (mu = 3.217, sigma = −0.171, Q = 1.861) | |||||
| Time-to-death categories | Sample size | Mean EQ-5D-3L score (95% confidence interval) | ||||||
| >360 days | 54 | 0.79 (0.75–0.83) | ||||||
| 181–360 days | 26 | 0.70 (0.66–0.74) | ||||||
| 30–180 days | 68 | 0.61 (0.57–0.65) | ||||||
| <30 days | 21 | 0.52 (0.40–0.63) | ||||||
| Costs† | Cost (CHF) | Source | ||||||
| Pembrolizumab drug cost (per 200 mg dose) | 5218 | Spezialitätenliste [5] | ||||||
| Average chemotherapy cost (per dose) | 2834 | Spezialitätenliste [5] | ||||||
| Pemetrexed maintenance cost (per dose) | 3693 | Spezialitätenliste [5] | ||||||
| Pembrolizumab/chemotherapy administration cost (first hour) | 399 | Matter-Walstra et al [14] | ||||||
| Pembrolizumab /chemotherapy administration cost (other hours) | 52 | Matter-Walstra et al [14] | ||||||
| PF disease management for pembrolizumab arm (weekly) | 285 | Huang [8], Matter-Walstra [14] | ||||||
| PF disease management for chemotherapy arm (weekly) | 427 | Huang [8], Matter-Walstra [14] | ||||||
| Progressive disease management (weekly) | 661 | Matter-Walstra et al [14] | ||||||
| PEM post-discontinuation therapy cost | 12,626 | KN-024, Spezialitätenliste [5] | ||||||
| Chemotherapy post-discontinuation therapy cost | 28,232 | KN-024, Spezialitätenliste [5] | ||||||
| Terminal care during last 30 days of life | 22,816 | DRG code A97, Luzerner Kantonspital | ||||||
| Adverse event | Pembrolizumab | Chemotherapy | % hospitalised (estimation) | Hospitalisation cost per event (CHF) | Source (DRG code) [11] | |||
| Anaemia | 4.5 | 23.3 | 50 | 5929 | E71B | |||
| Neutropenia | 0.0 | 18.0 | 50 | 5929 | E71B | |||
| Pneumonia | 1.9 | 7.3 | 100 | 8466 | E77F | |||
| Thrombocytopenia | 0.0 | 12.0 | 30 | 5929 | E71B | |||
| Pneumonitis | 2.6 | 0.7 | 100 | 8466 | E77F | |||
DRG = diagnosis-related group; KM = Kaplan-Meier; NICER = National Institute for Cancer Epidemiology and Registration; PF = progression free; * We used a constant mortality rate for overall survival from years 5 to 20, based on NICER data from 2000 to 2016, which recorded 46 deaths out of 124 living patients in Switzerland between 5 to 10 years after diagnosis with stage 4 NSCLC [10]. † Where relevant, adjusted by inflation to 2018 values
For time-on-treatment, the Weibull distribution was used for pembrolizumab and generalised gamma distribution was used for chemotherapy [8]. For progression-free survival, the Kaplan-Meier probabilities drawn from KEYNOTE-024 data up to week 9 and Weibull distribution thereafter, were used for pembrolizumab; Kaplan-Meier from KEYNOTE-024 data up to week 9 and exponential distribution thereafter were used for chemotherapy [8]. A week 9 cut-off was used because of a protocol-driven drop in measured progression-free survival at week 9 as the first tumour assessment was made at week 9 [8]. It is not advisable to use the full Kaplan-Meier curve (depicted in fig. 2 for time-on-treatment and fig. 3 for progression-free survival) prior to utilising parametric extrapolation beyond the trial as the KM patient data become sparse and estimates unstable as one nears the tail of the curve.
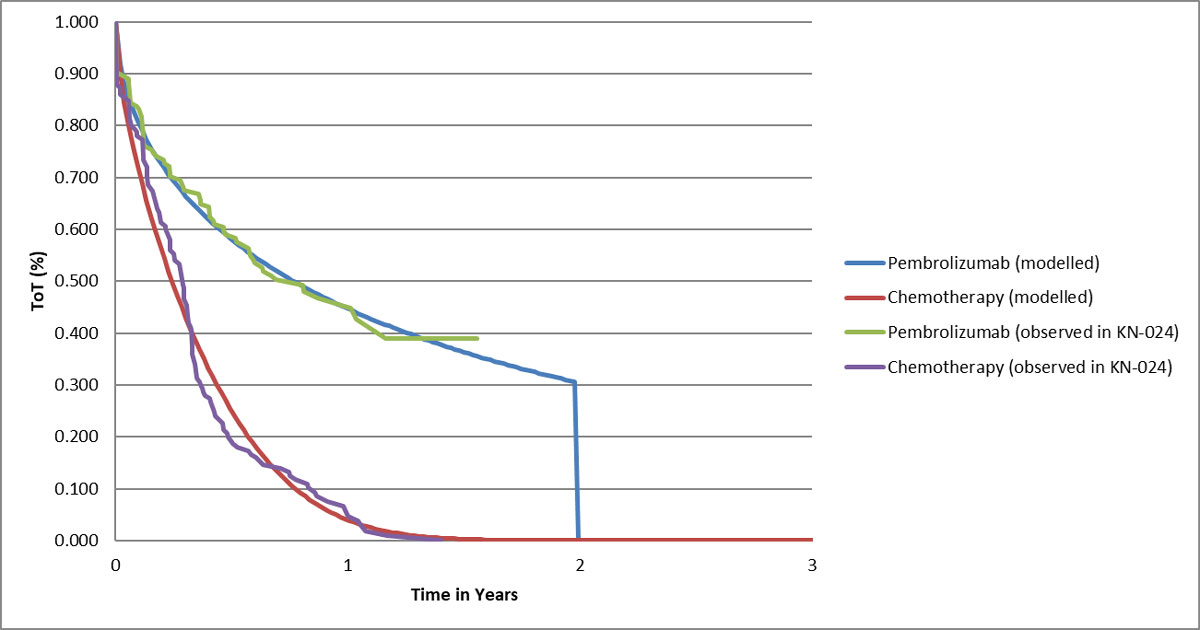
Figure 2 Modelled time on first-line treatment.
In order to model overall survival, a two-phase piecewise approach was used, as this approach resulted in closer fit with the trial data than the use of a parametric curve for the entire model period which appeared inadequate upon visual inspection unlike for progression-free survival after week 9 and time-on-treatment after week 0 [8]. Therefore, Kaplan-Meier probabilities were used up to 32 weeks for pembrolizumab and up to 38 weeks for chemotherapy (the cut-offs were determined using the Chow test), and exponential distributions for both arms were used from then up to year 5 [8]. A constant mortality rate of 0.0017 per week per person derived from Swiss National Institute for Cancer Epidemiology and Registration (NICER) data from 2000 to 2016 was applied to both arms from years 5 to 20 in the model for the base-case analysis (in a secondary analysis, the exponential distributions were used for this interval instead) [10]. The NICER-derived mortality rate was calculated on the basis of a recorded 46 deaths out of 124 living patients in Switzerland between 5 to 10 years after diagnosis of stage 4 NSCLC.
In a further secondary analysis, an adjustment to negate costs and effects of a treatment switch to pembrolizumab was made to overall survival in the chemotherapy arm using the simplified two-stage adjustment method of Latimer et al. [16]. This was done to represent the hypothetical scenario that the 66 patients in this arm who switched to pembrolizumab during the trial did not switch. The adjustment for treatment switching was undertaken only as a secondary analysis, in order that the base-case be more reflective of Swiss clinical practice, in which second-line pembrolizumab is recommended for metastatic NSCLC patients treated with first-line chemotherapy.
The EQ-5D-3L was administered to patients at treatment cycles 1, 2, 3, 6, 9, 12 and subsequently at every third cycle if the patient was still on study treatment. The EQ-5D-3L was also administered to patients at the treatment discontinuation visit and 30 days after the visit [8]. EQ-5D-3L responses were converted to utility scores using the European Union algorithm recommended for cancer patients in Switzerland [17]. For the base-case analysis, EQ-5D-3L scores were assigned to patients in each cycle of the model according to the number of days they were projected to be from dying as determined by the overall survival curve (table 1) [8]. For this, pooled EQ-5D-3L scores for the following categories were used: >360, 180–360, 30–179 and <30 days from death [8]. EQ-5D-3L scores were converted to undiscounted QALYs in each model cycle by multiplying the proportion of patients in each time-to-death group for each 1-week cycle of the model, by the EQ-5D-3L score assigned to that group and also by 7/365 (days). In a secondary analysis, EQ-5D-3L scores were assigned to patients for each model cycle based on the disease state they were in (progression-free, progressive disease or death). All EQ-5D-3L assessments described in this section were performed for the pooled sample of patients (across both treatment arms, based on lack of statistical differences in EQ-5D-3L scores between trial arms).
We considered costs related to drug acquisition and administration, disease management, post-discontinuation drugs, adverse events management and terminal care. All costs were updated to 2018 values using data on annual inflation rates in Switzerland [18, 19].
Unit costs of drugs were taken from the Swiss Federal Office of Public Health (SFOPH) Spezialitätenliste public prices (table 1) [5]. Pembrolizumab is available for purchase as a 100-mg vial costing CHF 2609 [5]. For the chemotherapy arm, the dosage of chemotherapy drugs received was determined by the body surface area (BSA) derived for the model from the mean baseline BSA of European KEYNOTE-024 participants of 1.83 m2 [20]. From this, we estimated the average cost of chemotherapy to be CHF 2834 per dose (which was the average cost of the different chemotherapy regimens used weighted by the proportions of chemotherapy patients who received each regimen) and pemetrexed maintenance to be CHF 3693 per dose (further details are provided in supplementary table S1, appendix 1). Chemotherapy patients received optional pemetrexed maintenance after completing four to six treatment cycles of their main chemotherapy regimen until disease progression or unacceptable adverse events [6], and analysis of the observed trial data showed that all chemotherapy patients had discontinued pemetrexed maintenance after 72 weeks (fig. 2). Figure 2 also shows consistency of observed time-on-treatment data from the trial to the curves used in the modelling.
The cost of the first hour of drug administration for intravenous infusions was taken from an external study (CHF 399 after inflation adjustment) estimating this cost for NSCLC in Switzerland (table 1); we varied this cost from CHF 271 to CHF 588 in the one-way sensitivity analyses (table S4, appendix 1) [14]. The cost of each subsequent hour of drug administration after the first hour was assumed to be CHF 52, which is 13% of the cost of the first hour as was the case for the USA analysis; we varied this cost from CHF 35 to CHF 77 in the one-way sensitivity analyses [8].
First-line treatment duration in the model was based on the estimated time-on-treatment curves. Furthermore, a cap on treatment duration was manually implemented to the time-on-treatment curve for pembrolizumab at 35 cycles (2 years) [5].
Unit costs of premedications for chemotherapy patients were based on Spezialitätenliste public prices [5]. The combinations and dose of the premedications were based on the US model [8], and were confirmed by a Swiss oncologist to be relevant for Switzerland. This led to an estimated premedication cost for cisplatin of CHF 116.26 and carboplatin of CHF 19.81 per cycle. In the secondary analysis of a “test and treat” strategy (described above in the section “Model structure and population”), the PD-L1 test was an additional cost item included and its unit cost was obtained from a study by Matter-Walstra et al. [14].
Progressive disease management costs were obtained from a study by Matter-Walstra et al., who estimated the cost of providing best supportive care to patients with progressive disease using data from the cantonal hospital Lucerne (table 1) [14]. We were not aware of any published estimates of progression-free disease management costs in Switzerland. Therefore, we made a proportional adjustment to the cost of progressive disease management estimated by Matter-Walstra et al. in order to estimate the cost of managing progression-free disease in Switzerland [14]. The adjustment made for the base-case analysis was based on the analysis from the USA, in which it was estimated that mean weekly progression-free disease management costs represented 43.1% of mean weekly progressive disease management costs for patients in the pembrolizumab group and 64.7% for patients in the chemotherapy group [8]. In a secondary analysis, we instead assumed progression-free disease management costs represented 45.7% of progressive disease management costs for both treatment strategies, in line with the analysis from Singapore [21].
Post-discontinuation drug costs (table 1) were estimated based on unit costs from the SFOPH Spezialitätenliste and KEYNOTE-024 resource use data on the distribution of patients in the pembrolizumab and chemotherapy arms receiving second-line and third-line chemotherapy or immunotherapy (further details are provided in supplementary table S2, appendix 1), and the average number of days patients received these treatments. As described above in the section “Survival analysis”, a secondary analysis was also undertaken where we assumed no second-line pembrolizumab was administered to chemotherapy patients, by implementing an adjustment for treatment switching to the model.
We only wished to include palliative care costs incurred during the final 30 days of life as we assumed that care during this time is typically provided in an inpatient setting in Switzerland, and disease management in the earlier stages of progressive disease is typically provided in an outpatient setting (and the associated costs of this are separately accounted for elsewhere in the model; see the section on “Disease management costs”). However, we were not aware of any studies in Switzerland that estimated the cost of treating NSCLC patients during the last 30 days of life. In order to derive this cost, we contacted a Swiss-based lung cancer oncologist, who provided us with an estimate of this cost of CHF 22,816 (table 1). This was the mean cost based on a sample of 49 NSCLC patients who died in a Swiss hospital in 2018.
Costs related to hospitalisations for grade 3 to 5 adverse events occurring in at least 5% of patients in either arm were included in our analysis [8]. Pneumonitis was also included on clinicians’ advice because although it was uncommon in KEYNOTE-024, it is nonetheless a well-documented adverse event for some patients on pembrolizumab monotherapy [6]. Unit costs of adverse event hospitalisations were obtained from the Swiss DRG database statistics (table 1) [10]. Costs were estimated for each arm by multiplying adverse event unit costs by the proportion of occurrences for each adverse event for KEYNOTE-024 participants in each arm. This was further multiplied by the percentage of each adverse event that was expected to result in hospitalisation, which was based on estimates provided by US clinical experts [8] and verified as transferable to Switzerland by a Swiss oncologist we consulted.
Full details on the methods for the sensitivity analyses undertaken are provided in supplementary table S3 (appendix 1). As described in the previous sections, secondary analyses were undertaken related to alternative choices of the model time horizon and discount rate, assignment of EQ-5D-3L scores to model states, adjustment of progression-free disease management costs based on an analysis from Singapore, evaluation of a PD-L1 testing and treatment strategy, alternative overall survival probability after 5 years, negating the effect of treatment switching, and removing paclitaxel and carboplatin as a chemotherapy regimen. One-way sensitivity analyses were done by implementing plausible variations in key input parameters to assess how this impacted the base-case ICER (full methods are provided in table S3). This included plausible reductions to the parameters used for the extrapolations of overall survival and progression-free survival, which were key areas of uncertainty in our analysis given the short duration of initial trial follow-up [7]. We did not vary the costs of drugs as these are certain, and in a secondary analysis used different assumptions for long-term overall survival after 5 years (based on parametric extrapolations instead of Swiss registry data) rather than varying this parameter in a one-way sensitivity analysis. The results of the one-way sensitivity analyses were presented in a Tornado diagram (fig. 4). We also undertook probabilistic sensitivity analysis (PSA) with 1000 iterations by assigning a probability distribution to each key model input parameter (full details are provided in table S3). For correlated parameters, a joint distribution was assigned. If the standard error for the parameters was not empirically estimated (e.g., for all costs), we assumed it was 20% of the mean parameter value. PSA results were presented in a cost-effectiveness plane and acceptability curve.

Figure 3 Modelled progression-free survival.
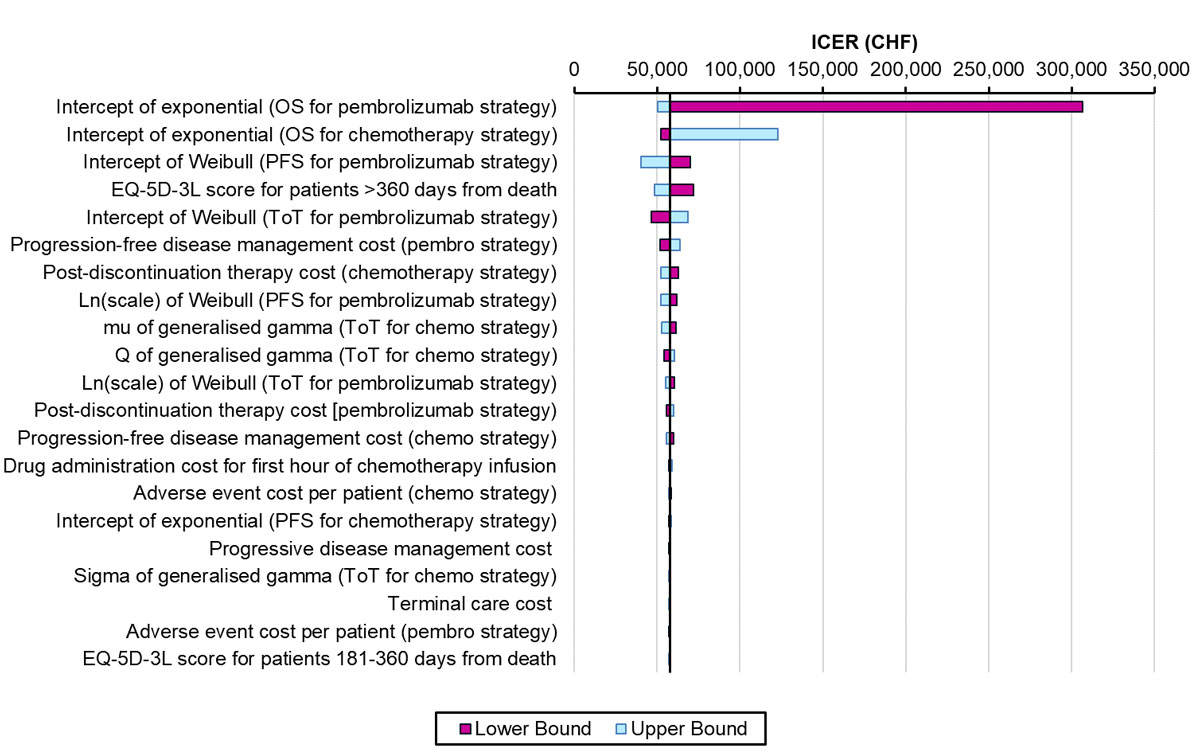
Figure 4 Tornado diagram for one-way sensitivity analyses.
The previous US model which we adapted for Switzerland satisfied the AdviSHE criteria for validating health economic models [8]. All the changes we made to the US model to reflect the Swiss situation (and the assumptions underlying these changes) were validated by a Swiss oncologist, and a health economist who contributed to the US model and several subsequent local adaptations.
The overall survival curve for the pembrolizumab strategy predicted 25.2% of patients would survive 5 years after treatment initiation (fig. 5), which is only slightly less than the observed proportion from the KEYNOTE-001 trial of 29.6% of previously untreated advanced NSCLC patients with PD-L1 expression ≥50% surviving 5 years after treatment initiation with pembrolizumab [22]. This suggests that the estimate of overall survival for patients treated with first-line pembrolizumab in our model at 5 years is reasonably accurate. The overall survival curve for chemotherapy patients following adjustment to negate for treatment switching closely matched with the overall survival curve from Flatiron data of US metastatic NSCLC patients initiating first-line cancer treatment measured over approximately 3 years [8]. The projected 5 year survival estimated by the model for chemotherapy patients following adjustment to negate the effect of treatment switching was 3.1%. The 5 year survival observed for Switzerland estimated from NICER data of newly diagnosed stage 4 NSCLC patients between 2000 and 2016 was slightly higher (5.7%) [10].

Figure 5 Modelled overall survival (base-case).
Over 20 years, pembrolizumab was projected to generate mean incremental drug acquisition costs of CHF 69,909 (pembrolizumab CHF 88,985, chemotherapy CHF 19,076), mean incremental costs of the overall strategy of CHF 77,060 (pembrolizumab CHF 223,324, chemotherapy CHF 146,264), mean incremental QALYs of 1.34 (pembrolizumab 3.05, chemotherapy 1.71) and mean incremental life years of 1.69 (pembrolizumab 3.98, chemotherapy 2.28). The undiscounted gain in life expectancy was 2.07 years (pembrolizumab 4.61, chemotherapy 2.54). This led to ICERs of CHF 57,402 per QALY gained and CHF 45,531 per life year gained (table 2). Thirty-one percent of patients in the pembrolizumab group and 0% in the chemotherapy strategy were projected to still be on first-line treatment at 2 years (fig. 2), with pembrolizumab patients still on treatment discontinuing at that time point.
Table 2 Base-case results.
| Pembrolizumab | Chemotherapy | Incremental pembrolizumab vs chemotherapy | ||
|---|---|---|---|---|
| Life years | 3.98 | 2.28 | 1.69 | |
| Progression-free state (months) | 25.96 | 6.57 | 19.39 | |
| Progressive state (months) | 21.74 | 20.83 | 0.92 | |
| QALYs | 3.05 | 1.71 | 1.34 | |
| Total costs (CHF) | 223,324 | 146,264 | 77,060 | |
| Drug acquisition | 88,985 | 19,076 | 69,909 | |
| Pre-medication | 0 | 170 | −170 | |
| Drug administration | 6806 | 3263 | 3543 | |
| Disease management | 94,746 | 72,136 | 22,610 | |
| Post-discontinuation therapy | 12,626 | 28,232 | −15,605 | |
| Adverse events | 514 | 2115 | −1601 | |
| Terminal care | 19,646 | 21274 | −1627 | |
| ICER | Cost (CHF) per life year | 45,531 | ||
| Cost (CHF) per QALY | 57,402 | |||
ICER= incremental cost-effectiveness ratio; QALY= quality-adjusted life year
Full results of the secondary analyses carried out for this study are provided in table 3. Notably, the analysis of an overall testing and treatment strategy (as opposed to just treatment) led to an ICER of CHF 57,738 per QALY gained. In the analysis where we assumed there was no treatment switching for chemotherapy patients resulting in lower costs and QALYs for the chemotherapy strategy, higher mean incremental costs (CHF 126,416) and QALYs (1.97) were projected relative to the base-case, leading to an ICER of CHF 64,186 per QALY gained.
Table 3 Results of scenario analyses.
| Description of scenario | Pembrolizumab cost (CHF) | Chemotherapy cost (CHF) | Incremental cost of pembrolizumab (CHF) | Pembrolizumab QALYs | Chemotherapy QALYs | Incremental QALYs of pembrolizumab | ICER (CHF/QALY) |
|---|---|---|---|---|---|---|---|
| Base-case analysis | 223,324 | 146,264 | 77,060 | 3.05 | 1.71 | 1.34 | 57,402 |
| Test and treat strategy (including PD-L1 test cost) | 169,710 | 146,264 | 23,446 | 2.11 | 1.71 | 0.41 | 57,738 |
| Discount rate: 0% for costs and outcomes | 243,829 | 156,180 | 87,649 | 3.54 | 1.91 | 1.64 | 53,591 |
| Discount rate: 2% for costs and outcomes | 229,442 | 149,243 | 80,200 | 3.20 | 1.77 | 1.43 | 56,110 |
| Discount rate: 6% for costs and outcomes | 208,231 | 138,831 | 69,399 | 2.69 | 1.56 | 1.13 | 61,362 |
| Paclitaxel and carboplatin not used in Switzerland | 223,324 | 147,282 | 76,042 | 3.05 | 1.71 | 1.34 | 56,643 |
| Parametric extrapolations for OS after 5 years | 198,814 | 133,110 | 65,703 | 2.45 | 1.39 | 1.06 | 62,168 |
| Probabilistic results | 225,363 | 151,838 | 73,525 | 3.06 | 1.77 | 1.29 | 56,887 |
| EQ-5D scores assigned to progression-based states | 223,324 | 146,264 | 77,060 | 2.90 | 1.60 | 1.29 | 59,519 |
| Negate treatment switching in chemotherapy arm | 223,324 | 96,909 | 126,416 | 3.05 | 1.08 | 1.97 | 64,186 |
| Progression-free disease costs based on Singapore | 225,244 | 142,692 | 82,552 | 3.05 | 1.71 | 1.34 | 61,493 |
| Time horizon: 5 years | 178,275 | 125,119 | 53,156 | 1.87 | 1.26 | 0.61 | 87,071 |
| Time horizon: 10 years | 201,300 | 136,634 | 64,666 | 2.51 | 1.50 | 1.01 | 64,083 |
| Time horizon: 30 years | 230,246 | 149,096 | 81,150 | 3.21 | 1.77 | 1.44 | 56,335 |
ICER = incremental cost-effectiveness ratio; OS = overall survival; PD-L1= programmed death ligand-1, QALY = quality-adjusted life year
Using EQ-5D-3L scores assigned to each of the three disease states, as opposed to time-to-death EQ-5D-3L scores, led to an ICER of CHF 59,519 per QALY gained. The analysis where we applied probabilities of overall survival based on parametric curves fitted after year 5 (instead of using NICER data) led to an ICER of CHF 62,168 per QALY gained. Adoption of a 5-year time horizon resulted in an ICER of CHF 87,071 per QALY gained.
We varied 26 parameters in one-way sensitivity analyses and the 21 most influential parameters are presented in a Tornado diagram (fig. 4). For 24 parameters, only small changes to the base-case ICER resulted from varying them. For two parameters, which related to overall survival with the pembrolizumab and chemotherapy treatment strategies respectively, there was a more substantial impact on cost effectiveness. Noticeably, a pessimistic assumption that the true value of the intercept of the exponential distribution used to extrapolate overall survival with the pembrolizumab treatment strategy is the lower bound of the 95% confidence interval of its mean value resulted in a very high ICER of CHF 306,585 per QALY gained. In the probabilistic analysis, we estimated the probability of first-line pembrolizumab being cost effective is 88%, for a payer willing to pay up to CHF 100,000 for an additional QALY (fig. 6 ).
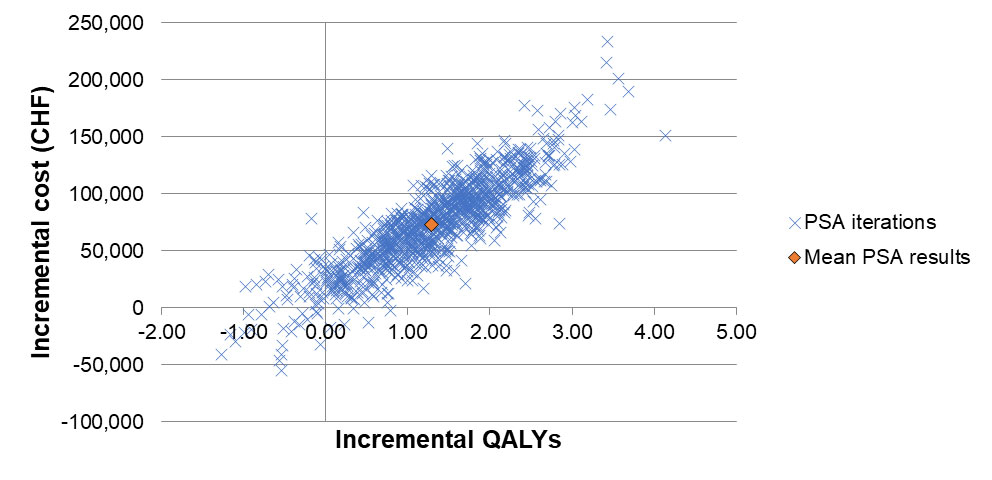
Figure 6a Cost-effectiveness plane for the probabilistic sensitivity analysis.

Figure 6b Cost-effectiveness acceptability curve for the probabilistic sensitivity analysis.
Based on the results of the KEYNOTE-024 trial, we found that pembrolizumab is likely to be cost effective for treatment in Switzerland. Relative to chemotherapy, the pembrolizumab treatment strategy was associated with higher mean costs of CHF 77,060, gains in life years of 1.69 and in QALYs of 1.34, leading to an ICER of CHF 57,402 per QALY gained. By assuming either a Swiss threshold of CHF 100,000 per QALY gained or a more conservative threshold of one times the gross domestic product per capita of Switzerland (of CHF 79,104 per QALY or DALY in 2017) [23], we observed that the base-case ICER falls below these values and in probabilistic sensitivity analyses, pembrolizumab was 88% likely to be cost effective with the CHF 100,000 per QALY threshold and 80% likely with the CHF 79,104 threshold.
We performed a non-systematic literature search of cost-effectiveness studies to confirm none have been performed for this indication previously in Switzerland, and to assess the comparability of our results for Switzerland with the results for other countries (the non-systematic search may mean we did not identify all relevant studies). Also based on the KEYNOTE-024 trial, first-line pembrolizumab monotherapy has previously been projected to be a cost-effective treatment for metastatic NSCLC in patients with TPS ≥50% in the USA [8, 24], Singapore [21], Hong Kong [25] and France [26], but described as potentially not being cost-effective in China [27] and the UK [24, 28] at its full list price. A comprehensive review of the available analyses is beyond the scope of the present paper, but important variations in data and assumptions exist. Some authors relied on the same modelling framework as used here, based on access to primary data sources from the trial [8, 21, 25, 26]. Others applied purely literature-based modelling of effectiveness and costs [24, 27, 28]. The list price of pembrolizumab used in our analysis for Switzerland was quite similar to the prices used in analyses for the UK and China, whereas the cost-effectiveness thresholds used for economic evaluations in the UK and China were lower than in Switzerland [24, 27, 28]. Caution should be exercised in evaluating and directly comparing.
Results are not generalisable to NSCLC patients with PD-L1 TPS <50% or with baseline ECOG performance status of 2 or higher. However, an area for future research may be to investigate cost effectiveness of extending treatment to patients with any PD-L1 expression, as pembrolizumab was recently found to be clinically effective for patients with TPS ≥1% in a separate trial and has consequently received US Food and Drug Administration approval for this indication [29]. Also, although this study only evaluated pembrolizumab monotherapy, pembrolizumab administered in combination with chemotherapy has been evaluated as an effective treatment in the KEYNOTE-189 and KEYNOTE-407 trials [30, 31] and was subsequently approved in Switzerland as a treatment option for metastatic NSCLC patients (and is awaiting approval for reimbursement). A network meta-analysis by Kim et al. (which combined the results of the KEYNOTE-189 and 407 trials without accounting for the different treatment indications used between trials in terms of types of chemotherapy drugs administered and rules for discontinuing pembrolizumab) reported that combination therapy resulted in a greater improvement in progression-free survival in the PD-L1 ≥50% population than monotherapy [9]. However, no trials have directly compared these treatments and there remains considerable uncertainty about the relative efficacy of combination therapy compared with monotherapy [9, 32].
The cost of pembrolizumab (estimated at CHF 88,985 per patient following discounting) was an important factor driving the higher incremental cost of the pembrolizumab treatment strategy, as was the higher disease management costs generated by patients in the pembrolizumab treatment strategy as a result of them living longer than chemotherapy patients. Secondary analyses evaluating the overall TPS testing and treatment strategy, applying EQ-5D-3L scores to progression-based disease states and negating the impact on overall survival of chemotherapy patients as a result of treatment switching to pembrolizumab, resulted in small increases in the base-case ICER; as did the majority of one-way sensitivity analyses. The ICER increased to CHF 87,071 per QALY gained when using a shorter model time horizon of 5 years, although a non-trivial proportion of patients are projected to survive beyond this time point, hence a 20 year time horizon was used for the base-case analysis. An ICER substantially exceeding CHF 100,000 per QALY gained resulted from a reduction in the intercept value of the exponential distribution used to extrapolate overall survival for the pembrolizumab treatment strategy, to the lower bound of its 95% CI. However, we were able to validate our extrapolation of KEYNOTE-024 overall survival with 5-year data from the KEYNOTE-001 trial [22], which indicated that our extrapolation was a reasonably accurate estimate.
Not all patients discontinuing chemotherapy because of disease progression are able to take a second-line therapy. Some may die from disease complications while taking first-line therapy, whereas others may be too frail at the point of treatment discontinuation to take a second-line treatment. Only 59% of KEYNOTE-024 chemotherapy arm patients who discontinued first-line treatment received a second-line therapy. Of chemotherapy patients who did receive second-line therapy, 90% received second-line pembrolizumab. Our analysis therefore suggests it may be more clinically and cost-effective to offer pembrolizumab as a first-line rather than second-line treatment within a sequence.
A strength of the analysis is the use of a partitioned survival model derived from primary access to the trial data. The partitioned survival approach is commonly used for evaluating the cost-effectiveness of cancer drugs [33]. Furthermore, we used the approach recommended by the NICE Decision Support Unit for fitting survival curves for overall survival and progression-free survival, via a two-phase piecewise approach utilising Kaplan-Meier probabilities followed by a best-fitting parametric curve [15]. Our analysis was based on clinical effectiveness data from a large randomised controlled trial, which is the only trial that has been conducted specifically for the assessed population.
A key limitation is the short median follow-up period of trial participants of 11.2 months, generating uncertainty when extrapolating costs and outcomes over 20 years. One-way sensitivity analysis showed this uncertainty in relation to overall survival could substantially impact the ICER. Longer-term follow-up results from the KEYNOTE-024 trial have recently become available, with longer median follow-up of 25.2 months [6], which show that the overall survival improvement from pembrolizumab documented in the original analysis was maintained and adverse event profiles were consistent with the original analysis. This may suggest using the updated trial data would be likely to produce a cost-effectiveness result similar to the one we found. Furthermore, we were able to validate our estimates of overall survival at 5 years in both treatment strategies using long-term external data, and use Swiss external data to model overall survival after 5 years. A further limitation was that the administration of pembrolizumab in the KEYNOTE-024 trial may slightly differ to real-world practice, as KEYNOTE-024 participants in the pembrolizumab arm were eligible to continue receiving pembrolizumab after confirmed disease progression if benefits were still being observed [7], although current treatment guidelines in Switzerland prohibit this [5]. Therefore, the costs and QALYs we estimated in our analysis for the pembrolizumab treatment strategy may be slightly higher than in real-world practice. Another potential limitation was the use of international effectiveness and resource use results from the KEYNOTE-024 trial for our analysis in Switzerland, although as a result of the advice from a Swiss clinical expert that paclitaxel and carboplatin is a very rarely used chemotherapy regimen in Switzerland, we removed this regimen in a secondary analysis which had small resulting impact on costs and cost-effectiveness.
To conclude, we found that pembrolizumab monotherapy in lieu of chemotherapy is likely to be cost-effective for first-line treatment of previously untreated metastatic non-small cell lung cancer (NSCLC) with PD-L1 tumour proportion score (TPS) ≥50% in Switzerland.
Table S1 Estimation of cost per dose of chemotherapy in base-case analysis.
| First-line chemotherapy regimen | Percentage of chemotherapy patients receiving regimen | Cost per 3-week treatment cycle (CHF) |
|---|---|---|
| Pemetrexed + carboplatin | 44% | CHF 3832 |
| Pemetrexed + cisplatin | 24% | CHF 3902 |
| Paclitaxel + carboplatin | 11% | CHF 621 |
| Gemcitabine + cisplatin | 7% | CHF 728 |
| Gemcitabine + carboplatin | 13% | CHF 658 |
| Weighted average cost of 3-week treatment cycle of chemotherapy (excluding pemetrexed maintenance) | CHF 2834 | |
| Average cost per dose of pemetrexed maintenance* | CHF 3693 | |
* Pemetrexed maintenance was administered as a dose of 500 mg/m2 of body surface area, with a cost of approximately CHF 2018/m2, dependent on the size of the vial which is purchased Mean baseline body surface area of European KEYNOTE-024 participants was 1.83m2We used the lowest priced drugs which are available in Switzerland to provide a conservative estimation of the cost of chemotherapy in Switzerland
Table S2 Percentage of KEYNOTE-024 participants in each treatment arm receiving various therapies (or no therapy) following discontinuation of first-line therapy.
| Pembrolizumab (%) | Chemotherapy (%) | |
|---|---|---|
| Did not receive second- and third-line therapy | 56 | 41 |
| Carboplatin + gemcitabine (second-line) | 7 | 0 |
| Carboplatin + paclitaxel + bevacizumab (second-line) | 7 | 0 |
| Carboplatin + pemetrexed (second-line) | 20 | 0 |
| Cisplatin + pemetrexed (second-line) | 9 | 0 |
| Docetaxel (second-line ) | 0 | 1 |
| Nivolumab (second-line) | 0 | 4 |
| Pembrolizumab (second-line) | 0 | 53 |
| Pemetrexed (second-line) | 0 | 1 |
| Second-line therapy followed by pemetrexed maintenance | 11 | 0 |
| Docetaxel (third-line) | 3 | 9 |
Table S3 Specification of parameter variation for the sensitivity analyses.
| Parameter | One-way sensitivity analysis | Probabilistic sensitivity analysis |
|---|---|---|
| Pembrolizumab overall survival: intercept of exponential distribution after 32 weeks. | Lower and upper bound of 95% CI of base-case value/s | The variance of the parameter was used to generate random draws |
| Chemotherapy overall survival: intercept of exponential distribution after 38 weeks. | ||
| Chemotherapy progression-free survival: intercept of exponential distribution after 9 weeks. | ||
| Pembrolizumab progression-free survival: intercept and ln(scale) of Weibull distribution after 9 weeks. | The covariance matrix of the parameter was used to generate correlated random draws | |
| Pembrolizumab time-on-treatment: mu, sigma and Q of generalised gamma distribution | ||
| Chemotherapy time-on-treatment: mu, sigma and Q of generalised gamma distribution | ||
| EQ-5D-3L scores | ± 20% of base-case value | Beta distribution with mean and standard error estimated from KN-024 data |
| Drug administration costs (first hour and subsequent hours) | Lower and upper bound of 95% confidence interval of the log-normal distribution of the base-case value | Log-normal distribution with standard error set at 20% of the mean cost |
| Disease management, post-discontinuation therapy and terminal care costs | ± 25% of base-case value | Log-normal distribution with standard error set at 20% of the mean cost |
| Adverse event cost parameters | ± 50% of base-case value | Log-normal distribution with standard error set at 20% of the mean cost |
Table S4 Akaike information criterion and (Bayesian information criterion) estimates for each type of parametric curve for each outcome.
| Model | |||
|---|---|---|---|
| Akaike information criterion | Bayesian information criterion | ||
| Time-on-treatment models for pembrolizumab | Exponential | 815.7 | 818.8 |
| Weibull | 778.8 | 784.9 | |
| LogNormal | 783.6 | 789.7 | |
| LogLogistic | 781.2 | 787.2 | |
| Gompertz | 800 | 806.1 | |
| Generalised Gamma | 780.4 | 789.5 | |
| Time-on-treatment models for chemotherapy | Exponential | 1127.9 | 1130.9 |
| Weibull | 1127.5 | 1133.6 | |
| LogNormal | 1186 | 1192 | |
| LogLogistic | 1169.3 | 1175.3 | |
| Gompertz | 1128.7 | 1134.7 | |
| Generalised Gamma | 1115.3 | 1124.3 | |
| Progression-free survival models for pembrolizumab, week 9+ | Exponential | 430.1 | 432.8 |
| Weibull | 424.1 | 429.6 | |
| LogNormal | 427.3 | 432.8 | |
| LogLogistic | 425.4 | 430.9 | |
| Gompertz | 430.1 | 435.6 | |
| Generalised Gamma | 425.3 | 433.5 | |
| Progression-free survival models for chemotherapy, week 9+ | Exponential | 718 | 720.8 |
| Weibull | 719.4 | 724.9 | |
| LogNormal | 749.2 | 754.7 | |
| LogLogistic | 735.1 | 740.6 | |
| Gompertz | 719 | 724.4 | |
| Generalised Gamma | 714.4 | 722.6 | |
| Overall survival models for pembrolizumab | Exponential | 523.9 | 527 |
| Weibull | 525.6 | 531.7 | |
| LogNormal | 525.1 | 531.1 | |
| LogLogistic | 525 | 531 | |
| Gompertz | 524.8 | 530.9 | |
| Generalised Gamma | 526.8 | 535.9 | |
| 32 weeks KM+exponential | 115.8 | 118.5 | |
| Overall models for standard of care | Exponential | 696.2 | 699.2 |
| Weibull | 698.2 | 704.3 | |
| LogNormal | 694 | 700.1 | |
| LogLogistic | 696.3 | 702.3 | |
| Gompertz | 697.4 | 703.5 | |
| Generalised Gamma | 695.6 | 704.7 | |
| 38 weeks KM+exponential | 94.6 | 96.8 | |
Bold rows represent the models which were eventually selected for the base-case analysis
We would like to thank Francesco Galli who provided invaluable data for estimating long-term survival in Switzerland. We would also like to thank Dr Urs Arnet for his contributions and commitment in project conceptualisation and set-up, and Dr Min Huang for producing an elegant and comprehensive global model.
This study was funded by MSD, including financial support received by MS via employment institution, for the funding of AB’s position.
RI is an employees of Merck Sharp & Dohme Corp. and PG of MSD Merck Sharp & Dohme AG, Switzerland, both subsidiaries of Merck & Co., Inc., Kenilworth, NJ, USA. Unrelated to this work, MS has received grants, via employment institution, from Amgen, Immunocore, Novartis and Sandoz, and personal fees from BMS, Pfizer and Sandoz.
1NICER and Swiss Federal Statistical Office (BFS). Lung cancer 2018 Available from: https://www.bfs.admin.ch/bfs/de/home/statistiken/gesundheit/gesundheitszustand/krankheiten/krebs/spezifische.assetdetail.6466432.html. Accessed on.
2American Cancer Society. What Is Non-Small Cell Lung Cancer? 2018 Available from: https://www.cancer.org/cancer/non-small-cell-lung-cancer/about/what-is-non-small-cell-lung-cancer.html. Accessed on 17th October 2018.
3 Decision Resources Group. Non-Small-Cell Lung Cancer. 2015.
4 Garon EB , Rizvi NA , Hui R , Leighl N , Balmanoukian AS , Eder JP , et al.; KEYNOTE-001 Investigators. Pembrolizumab for the treatment of non-small-cell lung cancer. N Engl J Med. 2015;372(21):2018–28. doi:.https://doi.org/10.1056/NEJMoa1501824
5Bundesamt für Gesundheit BAG. Spezialitätenliste (SL) 2018 [Available from: http://bag.e-mediat.net/SL2007.Web.External/. Accessed on 16th October 2018.
6 Reck M , Rodríguez-Abreu D , Robinson AG , Hui R , Csőszi T , Fülöp A , et al. Updated Analysis of KEYNOTE-024: Pembrolizumab Versus Platinum-Based Chemotherapy for Advanced Non-Small-Cell Lung Cancer With PD-L1 Tumor Proportion Score of 50% or Greater. J Clin Oncol. 2019;37(7):537–46. doi:.https://doi.org/10.1200/JCO.18.00149
7 Reck M , Rodríguez-Abreu D , Robinson AG , Hui R , Csőszi T , Fülöp A , et al.; KEYNOTE-024 Investigators. Pembrolizumab versus chemotherapy for PD-L1–positive non–small-cell lung cancer. N Engl J Med. 2016;375(19):1823–33. doi:.https://doi.org/10.1056/NEJMoa1606774
8 Huang M , Lou Y , Pellissier J , Burke T , Liu FX , Xu R , et al. Cost Effectiveness of Pembrolizumab vs. Standard-of-Care Chemotherapy as First-Line Treatment for Metastatic NSCLC that Expresses High Levels of PD-L1 in the United States. Pharmacoeconomics. 2017;35(8):831–44. doi:.https://doi.org/10.1007/s40273-017-0527-z
9 Kim R , Keam B , Hahn S , Ock CY , Kim M , Kim TM , et al. First-line Pembrolizumab Versus Pembrolizumab Plus Chemotherapy Versus Chemotherapy Alone in Non-small-cell Lung Cancer: A Systematic Review and Network Meta-analysis. Clin Lung Cancer. 2019;20(5):331–338.e4. doi:.https://doi.org/10.1016/j.cllc.2019.05.009
10National Institute for Cancer Epidemiology and Registration (NICER) 2018 Available from: http://www.nicer.org/. Accessed on 1st December 2018.
11Swiss DRG. Fallkostenstatistik 2014. 2014 Available from: http://www.swissdrg.org/de. Accessed on 16th October 2018.
12Solutions HCI. Keytruda 2018 Available from: https://compendium.ch/mpro/mnr/26788/html/de. Accessed on 27th November 2018.
13 Azzoli CG , Temin S , Aliff T , Baker S, Jr , Brahmer J , Johnson DH , et al.; American Society of Clinical Oncology. 2011 Focused Update of 2009 American Society of Clinical Oncology Clinical Practice Guideline Update on Chemotherapy for Stage IV Non-Small-Cell Lung Cancer. J Clin Oncol. 2011;29(28):3825–31. doi:.https://doi.org/10.1200/JCO.2010.34.2774
14 Matter-Walstra K , Schwenkglenks M , Aebi S , Dedes K , Diebold J , Pietrini M , et al.; Swiss Group for Clinical Cancer Research. A cost-effectiveness analysis of nivolumab versus docetaxel for advanced nonsquamous NSCLC including PD-L1 testing. J Thorac Oncol. 2016;11(11):1846–55. doi:.https://doi.org/10.1016/j.jtho.2016.05.032
15Latimer N. NICE DSU technical support document 14: survival analysis for economic evaluations alongside clinical trials-extrapolation with patient-level data. Sheffield, UK: Report by the Decision Support Unit; 2011.
16Latimer NR, Abrams KR. NICE DSU Technical Support Document 16: adjusting survival time estimates in the presence of treatment switching. Sheffield, UK: School of Health and Related Research, University of Sheffield; 2014:b12.
17 Matter-Walstra K , Klingbiel D , Szucs T , Pestalozzi BC , Schwenkglenks M . Using the EuroQol EQ-5D in Swiss cancer patients, which value set should be applied? Pharmacoeconomics. 2014;32(6):591–9. doi:.https://doi.org/10.1007/s40273-014-0151-0
18Swiss Federal Statistical Office. Consumer Prices 2018 [Available from: https://www.bfs.admin.ch/bfs/en/home/statistics/prices/consumer-price-index.html. Accessed on 16th December 2018.
19International Monetary Fund. Inflation 2019 [Available from: https://www.imf.org/external/datamapper/datasets/WEO. Accessed on 26th April 2019.
20National Institute for Health and Care Excellence. Pembrolizumab for untreated PD-L1-positive metastatic non-small-cell lung cancer 2018 [Available from: https://www.nice.org.uk/guidance/ta531. Accessed on 16th October 2018.
21Tan W, Huang M, Chandwani S, Hsu T, Tan S, Tan D, eds. Cost-effectiveness of Pembrolizumab as 1st Line Treatment for Metastatic NSCLC Patients with High PD-L1 Expression in Singapore. IASLC 19th World Conference on Lung Cancer; 2018; Toronto.
22 Garon EB , Hellmann MD , Rizvi NA , Carcereny E , Leighl NB , Ahn M-J , et al. Five-Year Overall Survival for Patients With Advanced Non‒Small-Cell Lung Cancer Treated With Pembrolizumab: Results From the Phase I KEYNOTE-001 Study. J Clin Oncol. 2019;37(28):2518–27. doi:.https://doi.org/10.1200/JCO.19.00934
23 Marseille E , Larson B , Kazi DS , Kahn JG , Rosen S . Thresholds for the cost-effectiveness of interventions: alternative approaches. Bull World Health Organ. 2015;93(2):118–24. doi:.https://doi.org/10.2471/BLT.14.138206
24 Georgieva M , da Silveira Nogueira Lima JP , Aguiar P, Jr , de Lima Lopes G, Jr , Haaland B . Cost-effectiveness of pembrolizumab as first-line therapy for advanced non-small cell lung cancer. Lung Cancer. 2018;124:248–54. doi:.https://doi.org/10.1016/j.lungcan.2018.08.018
25 Loong HH , Wong CKH , Leung LKS , Dhankhar P , Insinga RP , Chandwani S , et al. Cost Effectiveness of PD-L1-Based Test-and-Treat Strategy with Pembrolizumab as the First-Line Treatment for Metastatic NSCLC in Hong Kong. Pharmacoeconom Open. 2019. doi:. [Epub ahesd of print]https://doi.org/10.1007/s41669-019-00178-7
26 Chouaid C , Bensimon L , Clay E , Millier A , Levy-Bachelot L , Huang M , et al. Cost-effectiveness analysis of pembrolizumab versus standard-of-care chemotherapy for first-line treatment of PD-L1 positive (>50%) metastatic squamous and non-squamous non-small cell lung cancer in France. Lung Cancer. 2019;127:44–52. doi:.https://doi.org/10.1016/j.lungcan.2018.11.008
27 Liao W , Huang J , Hutton D , Li Q . Cost-effectiveness analysis of first-line pembrolizumab treatment for PD-L1 positive, non-small cell lung cancer in China. J Med Econ. 2019;22(4):344–9. doi:.https://doi.org/10.1080/13696998.2019.1570221
28 Hu X , Hay JW . First-line pembrolizumab in PD-L1 positive non-small-cell lung cancer: A cost-effectiveness analysis from the UK health care perspective. Lung Cancer. 2018;123:166–71. doi:.https://doi.org/10.1016/j.lungcan.2018.07.012
29 Mok TSK , Wu YL , Kudaba I , Kowalski DM , Cho BC , Turna HZ , et al.; KEYNOTE-042 Investigators. Pembrolizumab versus chemotherapy for previously untreated, PD-L1-expressing, locally advanced or metastatic non-small-cell lung cancer (KEYNOTE-042): a randomised, open-label, controlled, phase 3 trial. Lancet. 2019;393(10183):1819–30. doi:.https://doi.org/10.1016/S0140-6736(18)32409-7
30 Gandhi L , Rodríguez-Abreu D , Gadgeel S , Esteban E , Felip E , De Angelis F , et al.; KEYNOTE-189 Investigators. Pembrolizumab plus Chemotherapy in Metastatic Non-Small-Cell Lung Cancer. N Engl J Med. 2018;378(22):2078–92. doi:.https://doi.org/10.1056/NEJMoa1801005
31 Paz-Ares L , Luft A , Vicente D , Tafreshi A , Gümüş M , Mazières J , et al.; KEYNOTE-407 Investigators. Pembrolizumab plus Chemotherapy for Squamous Non-Small-Cell Lung Cancer. N Engl J Med. 2018;379(21):2040–51. doi:.https://doi.org/10.1056/NEJMoa1810865
32 Insinga RP , Vanness DJ , Feliciano JL , Vandormael K , Traore S , Ejzykowicz F , et al. Cost-effectiveness of pembrolizumab in combination with chemotherapy versus chemotherapy and pembrolizumab monotherapy in the first-line treatment of squamous non-small-cell lung cancer in the US. Curr Med Res Opin. 2019;35(7):1241–56. doi:.https://doi.org/10.1080/03007995.2019.1571297
33 Williams C , Lewsey JD , Mackay DF , Briggs AH . Estimation of Survival Probabilities for Use in Cost-effectiveness Analyses: A Comparison of a Multi-state Modeling Survival Analysis Approach with Partitioned Survival and Markov Decision-Analytic Modeling. Med Decis Making. 2017;37(4):427–39. doi:.https://doi.org/10.1177/0272989X16670617
This study was funded by MSD, including financial support received by MS via employment institution, for the funding of AB’s position.
RI is an employees of Merck Sharp & Dohme Corp. and PG of MSD Merck Sharp & Dohme AG, Switzerland, both subsidiaries of Merck & Co., Inc., Kenilworth, NJ, USA. Unrelated to this work, MS has received grants, via employment institution, from Amgen, Immunocore, Novartis and Sandoz, and personal fees from BMS, Pfizer and Sandoz.