Figure 1 Expected net economic benefit from influenza vaccination in the group of healthy adults aged 19‒65 years in relation to vaccine effectiveness. The different colours indicate vaccination coverage rates in the population.
DOI: https://doi.org/10.4414/smw.2019.20161
Influenza is a highly contagious disease, with transmission rates of up to 25% observed in household studies [1]. It has been estimated that between 10% and 20% of the population are infected with influenza each year [2]. Children are the main reservoir of the disease, but owing to its high infectivity, adults are also frequently affected. However, infection rates vary from year to year depending on the virulence of the circulating influenza strains, their antigenic similarity to circulating viruses from previous years and vaccination coverage. Each year between December and April, an influenza epidemic with variable magnitude can be observed in Switzerland [3].
Patients with influenza infections may be fully asymptomatic, suffer from mild symptoms of a common cold, or may present with severe disease requiring hospitalisation. It is estimated that between 100,000 and more than 300,000 visits to primary care physicians in Switzerland occur every year as a result of influenza infections [4]. Influenza can even be fatal, and most deaths from influenza occur in elderly people aged 65 and over, who are prone to developing severe disease because of comorbidities. Influenza is one of the leading causes of death in developed countries owing to its high infectivity, which results in a high yearly incidence. In Switzerland, influenza is estimated to cause 1000 to 5000 hospitalisations and up to 1500 deaths each year [5].
The annual economic loss induced by influenza is substantial. The cost of excess hospitalisations in connection with influenza epidemics in the USA was already estimated at more than USD 1 billion at the beginning of the 1990s [6]. For Switzerland, models have assumed that the annual direct costs for the Swiss healthcare system amount to around CHF 100 million. If all damages incurred by society are taken into account, including costs resulting from sick leave, the annual economic costs increase to almost CHF 300 million [7].
Various measures can help prevent transmission and the development of influenza. Of these, influenza vaccination is considered the most effective preventive measure [8, 9]. Vaccination reduces the risk of influenza and influenza-associated mortality, and is considered the most effective way to reduce the severity of the disease and prevent complications [10]. Unfortunately, as a result of antigen drift and waning immunity over time, immunisation needs to be repeated annually. The efficacy of influenza vaccination after a single dose is significantly lower than that of other vaccinations. It has been reported to be in the range of 30‒80%, depending on the population vaccinated and influenza season studied, with elderly people showing a reduced response to immunisation [11–14]. Various health authorities, such as the German Robert Koch Institute or the Swiss Federal Office of Public Health (FOPH), recommend annual influenza vaccination for people at increased risk [9, 15], whereas others, such as the United States of America or the province of Ontario, Canada, pursue a universal vaccination approach for influenza. The Swiss vaccination recommendations, which also provide the basis for cost absorption by health insurers, have so far mainly covered the main risk groups (elderly aged >65 years, women during pregnancy or within 4 weeks after giving birth, premature infants more than 6 months of age for the first two influenza seasons, and those with chronic diseases) and people with frequent contact with risk groups (including healthcare workers) or infants less than 6 month of age, whereas other population groups have had the opportunity to have themselves immunised by a physician at their own expense [16]. As a result, vaccination rates in the Swiss population vary according to age group [4]. Based on sales of influenza vaccines in Switzerland and surveys, the influenza vaccination rate in the Swiss population is estimated to be approximately 10%.
In some cantons, Swiss pharmacists who have completed training in vaccine administration have been authorised to offer vaccination against seasonal influenza without a physician’s prescription to healthy adults at these customers’ own expense since the 2015/2016 influenza season. In this first influenza season, vaccination was available in pharmacies in 5 out of 26 cantons, but the number rose to 18 by the 2017/18 season. This service, offered by pharmacies, supports the Swiss National Strategy on Vaccination, which aims to increase vaccination coverage rates in general [17].
The impact of influenza vaccinations administered in pharmacies in Switzerland on the economy and the population’s health has not yet been assessed. Therefore, the primary aim of this study was to describe the extent of influenza vaccination administered by pharmacies in the influenza seasons 2016/17 and 2017/18 and to assess in a cost-benefit analysis the resulting net benefits for the Swiss economy and public health. Our secondary aim was to assess the benefits that could be expected if an extension of vaccination recommendations with regard to working-aged adults was implemented.
In order to be able to assess the impact of influenza vaccinations administered in pharmacies in relation to the entire number of vaccinations in Switzerland, we collected data on the various vaccine delivery channels by accessing different data sources. These data were then normalised using population data.
The data for influenza vaccine doses supplied to Switzerland by manufacturers are collected by the Swiss FOPH on an annual basis and were made available for the years 1996 to 2017. In order to present the distribution of influenza vaccinations by age group and prescription status, it was assumed that all vaccinations administered outside pharmacies and physicians’ offices (e.g., through company physicians in companies with vaccine campaigns) were administered in the 19‒65 years age group. This assumes that the risk groups of chronically ill minors and elderly citizens neither have easy access to non-prescription vaccinations (e.g., through company physicians) nor make use of it. They are usually vaccinated by their family physicians, and these costs are covered by insurance companies.
Vaccination data from pharmacies were made available free of charge by pharmaSuisse, the national umbrella organisation of pharmacists. PharmaSuisse collected the data on influenza vaccinations carried out in pharmacies authorized to vaccinate for the 2016/2017 and 2017/2018 influenza seasons.. These pharmacies administer influenza vaccinations in the participating cantons without a physician’s prescription and record customer data in phS-net.ch. The registration in phS-net.ch is voluntary, which is why the absolute number of pharmacies carrying out vaccinations is underestimated [18]. Variables that were made available by pharmaSuisse were canton of residence, year of birth, date of vaccination and sex of the immunised persons. In addition, data on the number of pharmacies authorised to vaccinate per canton were provided.
Data on vaccinations covered by health insurance providers were purchased from Sasis AG, a company of the Santésuisse group, for the 2016/17 and 2017/18 influenza seasons. This datapool of Swiss health insurers includes data on all items covered by basic health insurance. Basic health insurance reimburses the costs of influenza vaccination for certain groups of people (those over 65 years of age and other risk groups), provided that the vaccination is administered based on a physician’s prescription. Over-the-counter vaccination in pharmacies is not covered by basic health insurance. Of note, there are insurance companies that also reimburse the related bills submitted by patients with additional insurance plans who do not belong to a risk group [19]. These bills are not recorded in the Sasis datapool.
Supplementary table S1 in appendix 1 lists the vaccinations that were queried, as of 17 July 17 2018. The lag between influenza season and data retrieval was considered appropriate as approximately 95% of services offered by healthcare providers are billed within 6 months of delivery.
The raw data on the population by canton (available for the years 1991‒2016), on the age distribution of the population and on employment situation were downloaded from the website of the Swiss Federal Statistical Office (FSO) or, for data not yet available at the time of the download (resident population, 2017), provided directly by the FSO [20–22].
The methodology for calculating the economic and public health loss due to influenza and the benefits of influenza vaccination was based on a study entitled “The Economic Impact of Influenza in Switzerland – Interpandemic Situation”, published in 2003 by James Piercy and Adrian Miles [4], which was prepared on behalf of the Swiss FOPH based on 1999 data. In this comprehensive study, the authors carried out a cost-effectiveness analysis of influenza vaccination in Switzerland. The assumptions and results obtained in the work of Piercy and Miles were adopted as the basis for our calculations and transformed to the current population of interest (healthy adults aged 19‒65 years).
Supplementary table S2 (appendix 1) shows an overview of the assumptions and results on which the following analyses are based. Based on the assumption that the parameters of teenagers between 15 and 18 years of age do not differ significantly from the 19‒65 years age group, assumptions from the 15‒65 years age group that were used by Piercy and Miles were applied for the analysis of the 19‒65 years age group in the present paper. The cost factors listed in table 1 for the 2017/18 influenza season were derived from the information given in table S2, enriched by current data on the base rate, cost weights from diagnosis-related groups, taxpoint values, duration of primary care physician visits and influenza vaccination costs [23–25].
Table 1 Parameters for estimating the economic benefits of influenza vaccination and the economic loss due to influenza in the 2017/18 influenza season.
| Cost factors | Piercy and Miles, 2003 [4] | Current study | |
|---|---|---|---|
| Costs per vaccine; includes vaccine administration and adverse effects, CHF | 20.65 | 38.35 | |
| Costs per case of influenza in healthy, working adults, CHF | 537.60 | 655.40 | |
| Employment rate | 0.78 | 0.84 | |
| Median household income, CHF | 3456 | 4152 | |
| Median costs per working day lost, CHF | 159 | 192 | |
| Costs per visit to a primary care physician, CHF | 120 | 120 | |
| Hospitalisation costs | Base rate for non-university-affiliated hospitals, CHF | n.a. | 9,547 |
| Cost weight for pneumonia | n.a. | 0.631 | |
| Hospitalisation costs for pneumonia, CHF | 7670 | 6024 | |
| Cost weight for other respiratory infections | n.a. | 0.631 | |
| Hospitalisation costs for other respiratory infections, CHF | 8133 | 6024 | |
| Cost weight for heart failure | n.a. | 0.883 | |
| Hospitalisation costs for heart failure, CHF | 8099 | 8430 | |
| n.a. = not applicable For the current study, hospitalisation costs are calculated by multiplying cost weights for individual disease categories with the base rate. |
|||
Our main goal was to calculate the net economic impact of influenza immunisation carried out in pharmacies. Net savings were calculated as the difference between the savings made and the costs incurred by vaccination (including the costs of adverse effects). In formal terms, the net savings from influenza vaccination can be calculated as follows:
Net savings = savings from vaccination − vaccination costs = influenza cases prevented × cost per case of illness − number vaccinated × costs per vaccination = population size × proportion with disease (attack rate) × proportion vaccinated × effectiveness of vaccination × costs per illness case − population size × proportion vaccinated × cost per vaccination.
This formula can then be resolved for the marginal effectiveness of vaccination – that is, the effectiveness needed to achieve zero net savings:
From this, it can be concluded that marginal effectiveness is higher with increasing costs per vaccination and/or reductions in costs per case of illness or attack rates. Net savings of at least CHF 0 are always achieved if vaccine effectiveness is greater than marginal effectiveness, regardless of the size of the vaccinated population. For the assumptions of Piercy and Miles, for example, a marginal effectiveness of CHF 20.64 / (CHF 537.63 × 0.1) = 38% is necessary – that is to say, a net benefit can be expected from a vaccine efficacy of 38% or more.
Differences in categorical data were examined with Fisher's exact test, and differences in continuous variables with the Wilcoxon rank-sum test or Student’s t-test. The data were analysed using Stata® Version 13.1 (Stata Corporation, College Station, TX). Two-sided p-values <0.05 were considered statistically significant.
In the 2016/17 influenza season, 1,071,000 vaccine doses were delivered to Switzerland, covering 12.7% of the total population under the assumption that all vaccines supplied were administered (table 2). In comparison with the 2016/17 influenza season, more vaccine doses were supplied in the 2017/18 influenza season and the proportion of the population who had their immunisation reimbursed by their health insurance provider decreased (4.7% in 2016/17 vs 4.5% in 2017/18, p <0.001), whereas the proportion vaccinated in pharmacies increased (0.1% vs 0.2%, p <0.001). Of note, more than half of all vaccine doses were administered outside the healthcare system or pharmacies in both influenza seasons. Unvaccinated individuals between 19 and 65 years of age represented more than 50% of the total Swiss population in each influenza season.
Table 2 Distribution of influenza vaccine in the Swiss population, 2016/17 and 2017/18 influenza seasons.
| Influenza season | ||||
|---|---|---|---|---|
| 2016/17 | 2017/18 | |||
| Population size | 8,419,550 (100) | 8,482,152 (100) | ||
| Distribution of vaccines | Vaccine doses delivered | 1,071,000 (12.7) | 1,152,000 (13.6) | |
| Vaccine doses reimbursed by health insurance providers | 393,993 (4.7) | 384,042 (4.5) | ||
| Vaccine doses administered in pharmacies | 7306 (0.09) | 15,617 (0.18) | ||
| Vaccine coverage according to age group | 0‒18 years | Unvaccinated | 1,589,979 (18.9) | 1,598,928 (18.9) |
| Vaccinated (reimbursed by health insurance providers) | 9107 (0.11) | 8786 (0.10) | ||
| Vaccinated (administered in pharmacies) | 100 (0.001) | 164 (0.002) | ||
| 19‒65 years | Unvaccinated | 4,621,279 (54.9) | 4,559,567 (53.8) | |
| Vaccinated (reimbursed by health insurance providers) | 89,652 (1.1) | 85,058 (1.0) | ||
| Vaccinated (administered in pharmacies) | 4966 (0.06) | 10,659 (0.13) | ||
| Vaccinated (outside pharmacy or health insurance) | 669,701 (7.9) | 752,341 (8.9) | ||
| >65 years | Unvaccinated | 1,137,292 (13.5) | 1,171,657 (13.8) | |
| Vaccinated (reimbursed by health insurance providers) | 295,234 (3.5) | 290,198 (3.4) | ||
| Vaccinated (administered in pharmacies) | 2240 (0.03) | 4794 (0.06) | ||
| Data are n (%). | ||||
In the 2017/18 season, the proportion of vaccinating pharmacies in the individual, participating cantons varied between 9.7% (Geneva) and 57.4% (Basel-Landschaft ) of all pharmacies per canton (table 3). Throughout Switzerland, 340 pharmacies authorised to vaccinate were registered in the 2017/18 influenza season, accounting for 24.5% of all pharmacies. Compared with the 2016/17 season, their relative proportion had increased by 4.3% (p = 0.007).
Table 3 Pharmacies authorised to vaccinate in Switzerland in the 2016/17 and 2017/18 influenza seasons.
| Canton | Pharmacies 2016/17 | Pharmacies authorised to vaccinate 2016/17 | Pharmacies 2017/18 | Pharmacies authorised to vaccinate 2017/18 | p-value* |
|---|---|---|---|---|---|
| Bern | 172 | 48 (27.9) | 173 | 59 (34.1) | 0.25 |
| Basel-Landschaft | 47 | 26 (55.3) | 47 | 27 (57.4) | 1.00 |
| Fribourg | 72 | 20 (27. 8) | 72 | 15 (20.8) | 0.44 |
| Geneva | 176 | 10 (5.7) | 175 | 17 (9.7) | 0.17 |
| Graubünden | 43 | 19 (44.2) | 43 | 17 (39.5) | 0.83 |
| Jura | 19 | 6 (31.6) | 19 | 6 (31.6) | 1.00 |
| Lucerne | 36 | 9 (25.0) | n.a. | ||
| Neuchâtel | 57 | 14 (24.6) | 57 | 16 (28.1) | 0.83 |
| Nidwalden | 3 | 1 (33.3) | n.a. | ||
| Saint Gallen | 54 | 11 (20.4) | 53 | 12 (22.6) | 0.82 |
| Schaffhausen | 13 | 2 (15. 4) | 13 | 2 (15. 4) | 1.00 |
| Solothurn | 28 | 9 (32.1) | 27 | 13 (48.1) | 0.28 |
| Schwyz | 16 | 2 (12.5) | 17 | 6 (35.3) | 0.22 |
| Thurgau | 24 | 4 (16.7) | 24 | 6 (25.0) | 0.72 |
| Vaud | 246 | 20 (8.1) | 245 | 37 (15.1) | 0.017 |
| Valais | 122 | 12 (9.8) | 123 | 18 (14.6) | 0.33 |
| Zug | 16 | 7 (43.8) | n.a. | ||
| Zurich | 240 | 65 (27.1) | 242 | 72 (29.8) | 0.55 |
| Switzerland | 1329 | 268 (20.2) | 1385 | 340 (24.5) | 0.007 |
n.a. = not applicable Data are n (%). Percentages refer to the total number of pharmacies per canton or in Switzerland. In the cantons of Aargau, Appenzell Innerrhoden, Appenzell Ausserrhoden, Basel-Stadt, Glarus, Obwalden, Ticino and Uri, there were no official vaccinations in pharmacies in either season. * Comparison between pharmacies 2016/17 and 2017/18.
In the 2017/18 season, 83.4% of the Swiss population lived in cantons with authorised pharmacies. In the 2016/17 and 2017/18 influenza seasons, 0.7% and 1.4%, respectively, of all vaccine doses delivered in Switzerland were administered in these pharmacies. Around 30% of those vaccinated in pharmacies were over 65 years old, and this proportion did not change between the two periods (table 4). The proportion of vaccinated 19- to 65-year-olds was 0.09% of the total population in the 2016/17 season and 0.2% in the 2017/18 season (p <0.001).
Table 4 Vaccinations in pharmacies authorised to vaccinate in the 2016/17 and 2017/18 influenza seasons.
| Both seasons | 2016/17 influenza season | 2017/18 influenza season | p-value* | |||
|---|---|---|---|---|---|---|
| All of Switzerland | ||||||
| Number of vaccinations administered | 22,923 | 7306 (0.09) | 15,617 (0.18) | <0.001 | ||
| Vaccinated population | Age, years, mean (SD) | 55.7 (16.0) | 55.4 (16.2) | 55.8 (16.0) | 0.24 | |
| Female sex, n (%) | 12,049 (52.6) | 3910 (53.5) | 8139 (52.1) | 0.049 | ||
| Age groups | 0‒18 years, n (%) | 264 (1.2) | 100 (1.4) | 164 (1.1) | ||
| 19‒65 years, n (%) | 15,625 (68.2) | 4966 (68.0) | 10,659 (68.3) | 0.11 | ||
| >65 years, n (%) | 7034 (30.7) | 2240 (30.7) | 4794 (30.7) | |||
| Number of vaccinationss by canton | ||||||
| Bern | 3821 | 1261 (0.12) | 2560 (0.25) | <0.001 | ||
| Basel-Landschaft | 3686 | 1360 (0.48) | 2326 (0.81) | <0.001 | ||
| Fribourg | 1057 | 480 (0.15) | 577 (0.18) | 0.005 | ||
| Geneva | 935 | 339 (0.07) | 596 (0.12) | <0.001 | ||
| Graubünden | 888 | 295 (0.15) | 593 (0.30) | <0.001 | ||
| Jura | 244 | 110 (0.15) | 134 (0.18) | 0.14 | ||
| Lucerne | 421 | 421 (0.10) | n.a. | |||
| Neuchâtel | 458 | 114 (0.06) | 344 (0.19) | <0.001 | ||
| Nidwalden/Schwyz† | 524 | 60 (0.03) | 464 (0.23) | <0.001 | ||
| Saint Gallen | 1065 | 340 (0.07) | 725 (0.14) | <0.001 | ||
| Schaffhausen | 41 | 19 (0.02) | 22 (0.03) | 0.76 | ||
| Solothurn | 1280 | 467 (0.17) | 813 (0.30) | <0.001 | ||
| Thurgau | 573 | 221 (0.08) | 352 (0.13) | <0.001 | ||
| Vaud | 1191 | 345 (0.04) | 846 (0.11) | <0.001 | ||
| Valais | 691 | 212 (0.06) | 479 (0.14) | <0.001 | ||
| Zug | 475 | 475 (0.38) | n.a. | |||
| Zurich | 5573 | 1683 (0.11) | 3890 (0.26) | <0.001 | ||
n.a. = not applicable Figures in brackets correspond, unless otherwise indicated, to the percentage of the total population. In the cantons of Aargau, Appenzell Innerrhoden, Appenzell Ausserrhoden, Basel-Stadt, Glarus, Obwalden, Ticino and Uri, there were no official vaccinations in pharmacies in either season * Comparison between 2016/17 and 2017/18 influenza seasons. † For reasons of data protection, only combined figures were provided for these two cantons.
The economic and public health benefits generated by vaccination in pharmacies and the associated costs and benefits are listed in table 5. For each vaccination, there was a net return of CHF 13.40 into the economy. For the 2017/18 influenza season, the total net return in Switzerland amounted to more than CHF 143,000. Table 6 depicts the costs and benefits of influenza vaccination in pharmacies in individual cantons per 100,000 population in the 2017/18 influenza season. Cantons not listed did not carry out prescriptionless influenza vaccinations in pharmacies. For all of Switzerland and per 100,000 inhabitants, a net profit of CHF 1918 was calculated, and 94.4 cases of illness, 17.6 visits to primary care physicians, 0.328 hospitalisations, 1.1 hospitalisation days and 0.019 deaths were prevented, and 0.353 life-years gained. However, large differences were found between cantons. The highest net savings per 100,000 population for 2017/18 were detected in the canton of Basel-Landschaft (CHF 13,318 per 100,000 population), whereas in the canton of Schaffhausen only CHF 437 per 100,000 population was saved.
Table 5 Costs and benefits of influenza vaccination in pharmacies in the 2016/17 and 2017/18 seasons for the 19‒65 age group.
| 2016/17 influenza season | 2017/18 influenza season | ||
|---|---|---|---|
| Number vaccinated | 4966 | 10,659 | |
| Public health benefits | Influenza cases prevented | 392 | 842 |
| Visits to primary care physicians prevented | 73 | 157 | |
| Hospitalisations prevented | 1.36 | 2.93 | |
| Hospitalisation days prevented | 4.50 | 9.65 | |
| Deaths prevented | 0.08 | 0.17 | |
| Number of life-years saved | 1.47 | 3.15 | |
| Economic impact | Costs of vaccination, CHF | 190,496 | 408,879 |
| Benefits from vaccination, CHF | 257,129 | 551,901 | |
| Net benefits, CHF | 66,633 | 143,021 | |
Table 6 Costs and benefits of influenza vaccination for healthy 19- to 65-year-olds in the pharmacies of the individual cantons per 100,000 population in the 2017/18 influenza season. The denominator corresponds to healthy 19- to 65-year-olds on 31 December 2017.
| Canton |
Costs of vaccination
(CHF) |
Benefits from vaccination
(CHF) |
Net benefits
(CHF) |
Influenza cases prevented | Visits to primary care physicians prevented | Hospitalisations prevented | Hospitalisation days prevented | Deaths prevented | Number of life-years saved |
|---|---|---|---|---|---|---|---|---|---|
| Bern | 11,432 | 15,431 | 3999 | 25.6 | 4.8 | 0.089 | 0.6 | 0.005 | 0.096 |
| Basel-Landschaft | 38,074 | 51,391 | 13,318 | 72.2 | 13.5 | 0.251 | 2.1 | 0.015 | 0.270 |
| Fribourg | 8285 | 11,183 | 2898 | 16.6 | 3.1 | 0.058 | 0.6 | 0.003 | 0.062 |
| Geneva | 5444 | 7349 | 1904 | 13.2 | 2.5 | 0.046 | 0.5 | 0.003 | 0.049 |
| Graubünden | 13,600 | 18,357 | 4757 | 23.6 | 4.4 | 0.082 | 1.1 | 0.005 | 0.089 |
| Jura | 8669 | 11,702 | 3032 | 17.6 | 3.3 | 0.061 | 0.9 | 0.004 | 0.066 |
| Lucerne | 4653 | 6281 | 1628 | 9.0 | 1.7 | 0.031 | 0.5 | 0.002 | 0.034 |
| Neuchâtel | 8914 | 12,032 | 3118 | 18.2 | 3.4 | 0.063 | 1.0 | 0.004 | 0.068 |
| Nidwalden/Schwyz* | 10,345 | 13,964 | 3619 | 19.2 | 3.6 | 0.067 | 1.2 | 0.004 | 0.072 |
| Saint Gallen | 6513 | 8791 | 2278 | 13.6 | 2.5 | 0.047 | 0.9 | 0.003 | 0.051 |
| Schaffhausen | 1250 | 1687 | 437 | 2.6 | 0.5 | 0.009 | 0.2 | 0.001 | 0.010 |
| Solothurn | 13,587 | 18,339 | 4753 | 26.3 | 4.9 | 0.092 | 1.9 | 0.005 | 0.099 |
| Thurgau | 5779 | 7800 | 2,021 | 11.3 | 2.1 | 0.039 | 0.9 | 0.002 | 0.042 |
| Vaud | 4862 | 6562 | 1701 | 10.0 | 1.9 | 0.035 | 0.9 | 0.002 | 0.037 |
| Valais | 6425 | 8672 | 2247 | 14.8 | 2.8 | 0.052 | 1.4 | 0.003 | 0.056 |
| Zug | 16,903 | 22,815 | 5912 | 39.8 | 7.4 | 0.138 | 3.8 | 0.008 | 0.149 |
| Zurich | 11,520 | 15,550 | 4030 | 23.1 | 4.3 | 0.080 | 2.3 | 0.005 | 0.087 |
| Switzerland | 8343 | 11,262 | 2918 | 94.4 | 17.6 | 0.328 | 1.1 | 0.019 | 0.353 |
* For reasons of data protection, only combined figures were provided for these two cantons.
As outlined in the Methods section, net savings are expected as soon as the marginal effectiveness of the influenza vaccine is exceeded. This depends directly on the costs of the vaccination and inversely on the costs of a case of illness and the attack rate, and is in the range of 38% with the assumptions made by Piercy and Miles. Due to the disproportionate increase in the costs of vaccination in relation to the costs incurred by influenza illness (see table 1), marginal effectiveness rose to 59%.
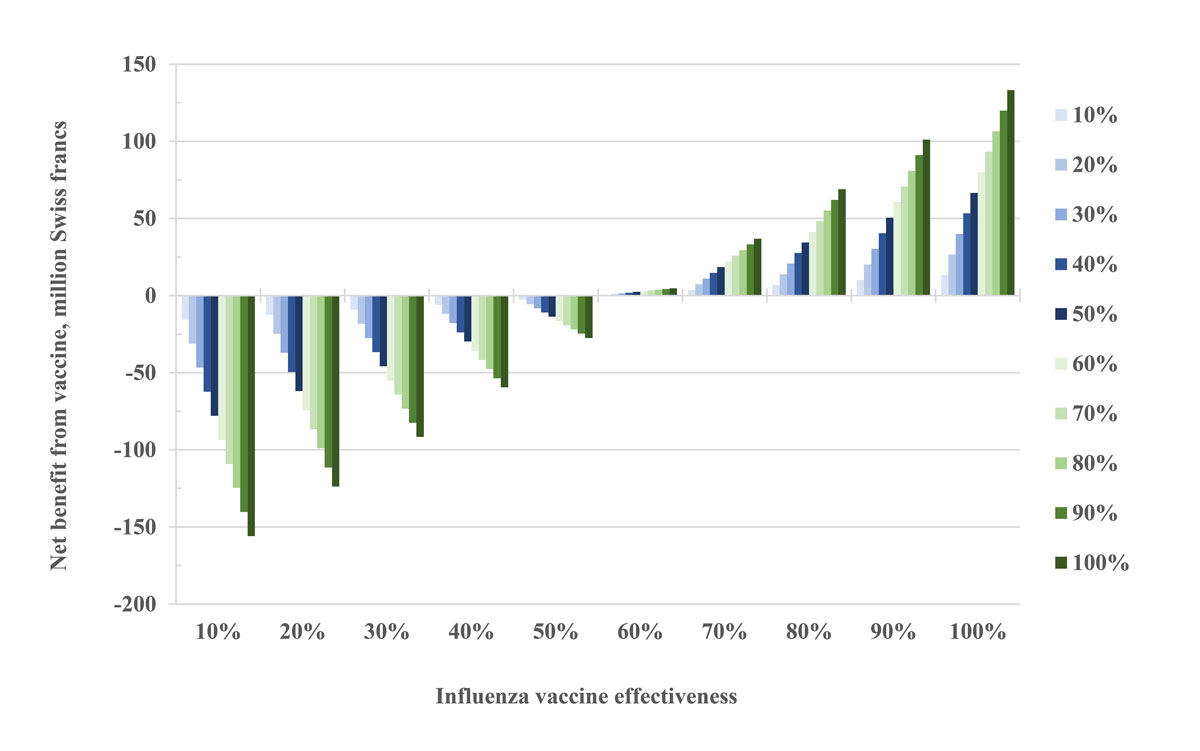
Figure 1 shows the net benefit of influenza vaccination in the 19‒65 years age group as a function of vaccine coverage. At a low vaccine coverage of only 10%, a marginally effective vaccine with an efficacy of 10% results in a loss of CHF 15.6 million, whereas an efficacy of 40% results in a loss of CHF 6.0 million and an efficacy of 80% in a CHF 6.9 million net benefit. If the vaccination coverage rate were 50%, the corresponding costs would be CHF 77.9 million for 10% efficacy and CHF 29.8 million for 40% efficacy, and the benefit for 80% efficacy could reach CHF 34.4 million. A vaccination coverage rate of 100% would result in losses of CHF 155.9 million for 10% efficacy and CHF 59.5 million for 40% efficacy, or lead to a net benefit of CHF 69.0 million at 80% efficacy.
Figure 1 Expected net economic benefit from influenza vaccination in the group of healthy adults aged 19‒65 years in relation to vaccine effectiveness. The different colours indicate vaccination coverage rates in the population.
Pharmacies in Switzerland have been offering prescription-free influenza vaccination for healthy adults since the 2015/16 influenza season. Influenza vaccinations in pharmacies could contribute to an increase in the vaccination rate in the population as a whole by facilitating access to vaccination, and be of particular interest if vaccination recommendations were extended to a broader population, such as in the context of influenza pandemics.
In a comprehensive analysis of available data, we demonstrated that so far only a very small proportion of influenza vaccinations (1.4% of all vaccine doses delivered in Switzerland in the 2017/18 season) were administered in pharmacies at the customer’s expense. Although this proportion doubled between the 2016/17 and 2017/18 seasons, it is still negligible in comparison with the main target group of potential customers, consisting of around 5.4 million people between 19 and 65 years of age, of whom around 91% – that is to say, 4.9 million people – do not belong to any risk group and therefore do not qualify for reimbursement of influenza vaccine costs by their health insurance provider. In the 2017/18 season, only 0.18% of the Swiss population were vaccinated in pharmacies. From the 2016/17 to the 2017/18 season, the proportion of vaccinating pharmacies increased to 24.5% of all pharmacies in the cantons that fulfil the legal requirements. The doubling of the number of vaccinations administered in pharmacies between the two periods is disproportionately high compared with the increase in the overall supply of vaccine doses in the same period. Furthermore, the proportion of vaccines administered in settings that qualify for coverage by health insurance providers decreased in the same period to 4.5% of the Swiss population. However, because of the small number of people vaccinated in pharmacies, it is not possible to determine whether the availability of this service had an influence on vaccinations in other settings or on the overall vaccination rate. It remains to be seen whether this new service complements or competes with traditional ways to get vaccinated.
We also found that the net cost saving for the Swiss economy due to the vaccinations administered in pharmacies was CHF 66,633 in the 2016/17 and CHF 143,021 in the 2017/18 influenza season. For 2017/18 and per 100,000 population, we calculated a net profit of CHF 1918 and demonstrated that 94.4 cases of illness, 17.6 visits to primary care physicians, 0.328 hospitalisations, 1.1 hospitalisation days and 0.019 deaths were prevented, and 0.353 life-years gained. Put in context, these cost savings seem negligible compared with the CHF 80.5 billion of healthcare expenses in Switzerland in 2016 [26]. Projections for the working population show, however, that with a vaccination coverage rate of 50% and a vaccine efficacy of 70%, the Swiss economy could save almost CHF 20 million annually. This number could even be increased to CHF 66 million if the cost per influenza vaccine could be reduced from CHF 38.35 (as used for the current analysis) to the 1999 level of around CHF 20.65, which seems feasible in view of the factory sale prices of just under CHF 10. Based on considerations with regard to marginal effectiveness, however, a vaccine effectiveness of around 60% is needed to reach breakeven. This level of effectiveness is usually reached in the population of 19- to 65-year-olds, although is not guaranteed [11–14].
Our study has several weaknesses. Any quantitative analysis depends on the underlying original data, and the data sources we used have limitations. The vaccination data for the vaccine doses supplied to Switzerland included only the doses delivered, but not the doses actually administered. According to Swiss FOPH estimates, 5‒10% of all doses sold are not administered. The data from the pharmacies is limited to pharmacies participating in phS-net.ch, which entered vaccination data into the system on a voluntary basis. This results in an underestimation of the vaccinations administered in pharmacies, compounded by the fact that pharmacies not participating in phS-net.ch also offered vaccinations. Analyses recently published by pharmaSuisse attempt to address this underestimation by means of extrapolation, which is also subject to a significant degree of uncertainty [18]. The extrapolation by pharmaSuisse includes 19,648 vaccinations in the 2017/18 season, whereas the data set made available to us contained 15,617 vaccinations registered in phS-net.ch. The figures calculated in the current study therefore represent a conservative view of the vaccinations administered in pharmacies. The study by pharmaSuisse supports our finding that only a small proportion of vaccinations were administered in pharmacies, compared with physicians’ offices, especially in the age group over 65, and did not find any evidence of a shift in influenza vaccinations from primary care physicians to pharmacies either.
Our assumptions regarding the economic benefits and disadvantages of influenza vaccination and the methododology used were based on the publication by Piercy and Miles [4]. Although the assumptions in that publication were based on a literature search, original data, and interviews with national and international experts, the decision analysis uses a modelling approach that cannot be compared with empirical data collection and analysis. Some of the assumptions of Piercy and Miles were adopted for the present analysis owing to a lack of current literature and some were enriched with current data. Even though such factors were not obvious to us, we cannot exclude the possibility that other effects, due to changing parameters that affect influenza epidemiology, may have biased our methodological approach, which dated back to 1999. Piercy and Miles did not carry out a cost-benefit analysis in their study, the authors claiming that such a study required a financial evaluation of prevented deaths and years of life gained, for which they could not identify a suitable method. Although they pointed to the social benefits of influenza vaccination for healthy, working adults in their summary section, they do not elaborate on these results in the main text. In contrast, they calculated the cost of influenza vaccination per death prevented or per quality-adjusted year of life gained in the risk groups studied. This approach, however, is also not above criticism as it gives society a choice regarding how much it wants to invest in preventing a death in the corresponding population. At the same time, it does not take into account the social benefits of preventing illnesses not resulting in death or a loss of life-years. The data presented by Piercy and Miles suggest that vaccinating healthy adults at a cost of CHF 1.2 million per death prevented is not cost-effective, which has been used as an argument for not recommending vaccination for this population. Our data clearly show that the vaccination of this population can have an economic benefit and should therefore be taken into consideration in the evaluation of vaccine recommendations, even if the number of deaths prevented is low. A further weakness of our study lies in its lack of generalisability and applicability to other healthcare systems. At the same time, the strong, individualised focus on the Swiss setting and the Swiss healthcare system can be interpreted as a great strength.
In conclusion, influenza vaccination for healthy 19- 65-year-olds results in an economic benefit as long as the marginal effectiveness of the influenza vaccine exceeds a threshold of approximately 60%. For this reason, vaccination in this age category is supported from both an economic and a health policy point of view. It may thus be indicated to assess whether a change of the recommendations for this age group is advisable in Switzerland, similar to other countries that even recommend universal vaccination of all age groups [27–29]. Pharmacies may be useful in implementing an expansion of vaccination recommendations, addressing the increase in demand. A decisive question regarding the expansion of vaccination recommendations, howewer, is the question of costs. At the moment, those individuals who pay for vaccination bear both the costs and adverse effects, and thereby support society as a whole, from a financial and a public health perspective, especially if herd immunity is also taken into consideration [30–32]. One explanation for low vaccination rates might be that only few people currently weigh the personal benefit associated with influenza vaccination as higher than the costs associated with vaccination. In other words, self-interest is more prevalent in the population than the utilitarian view, which takes into account the overall benefits for society [33]. Protection against influenza infection can be considered a public good in the utilitarian sense. The question then arises as to whether, as for other public goods, there is a need to influence vaccination coverage by means of incentives for those vaccinated (e.g., absorption of the costs of vaccination and/or reduction of health insurance premiums) or of disadvantages for unvaccinated persons (e.g., increase in health insurance premiums and/or a lack of compensation for losses due to illness) in order to better protect population health.
Table S1 List of influenza vaccines, retrieved from the Sasis datapool.
| Name of vaccine |
Ex-factory price
(CHF) |
Active substance | Manufacturer |
|---|---|---|---|
| Mutagrip, Inj Susp 2016/2017, Fertspr 0.500 ml | 8.51 | Vaccinum influenzae-Split, inactivatum 2016/2017 | Sanofi-Aventis (Suisse) SA |
| Mutagrip, Inj Susp 2017/2018, Fertspr 0.500 ml | 8.51 | Vaccinum influenzae-Split, inactivatum 2017/2018 | Sanofi-Aventis (Suisse) SA |
| Influvac, Inj Susp 2016/2017, Fertspr 0.500 ml | 9.10 | Vaccinum influenzae-Subunit inactivatum 2016/2017 | BGP Products GmbH |
| Influvac, Inj Susp 2017/2018, Fertspr 0.500 ml | 9.10 | Vaccinum influenzae-Subunit inactivatum 2017/2018 | BGP Products GmbH |
| Fluad, Inj Susp 2016/2017, Fertspr 0.500 ml | 10.05 | Vaccinum influenzae-Subunit inactivatum, adjuvantum 2016/2017 | PaxVax Berna GmbH |
| Fluad, Inj Susp 2017/2018, Fertspr 0.500 ml | 10.05 | Vaccinum influenzae-Subunit inactivatum, adjuvantum 2017/2018 | PaxVax Berna GmbH |
| Agrippal, Inj Susp 2016/2017, Fertspr 0.500 ml | 9.10 | Vaccinum influenzae-Subunit inactivatum 2016/2017 | PaxVax Berna GmbH |
| Agrippal, Inj Susp 2017/2018, Fertspr 0.500 ml | 9.10 | Vaccinum influenzae-Subunit inactivatum 2017/2018 | PaxVax Berna GmbH |
| Fluarix Tetra, Inj Susp m sep Nad 2016/2017, 0.500 ml | 9.27 | Vaccinum influenzae-Split, inactivatum, tetravalens 2016/2017 | GlaxoSmithKline AG |
| Fluarix Tetra, Inj Susp m sep Nad 2017/2018, 0.500 ml | 9.27 | Vaccinum influenzae-Split, inactivatum, tetravalens 2017/2018 | GlaxoSmithKline AG |
Table S2 Assumptions, from the publication by Piercy and Miles [4], that were used for the analyses.
| Variable | Value |
|---|---|
| Age range | 15‒65 years |
| Population size | 4,235,000 |
| Employment rate | 78% |
| Proportion of subjects from high-risk populations | 9.04% |
| Vaccination rate | 9.54% |
| Attack rate | 10% |
| Duration of influenza season | 10 weeks |
| Sick days due to influenza | 8.3 |
| Lost working days (without need for physician visit) per illness episode | 4.5 |
| Lost working days (with need for physician visit) per illness episode | 5.5 |
| Lost working days due to reduced efficiency after return, per illness episode | 0.35 |
| Lost working hours due to vaccination at the workplace, per vaccinated person | 0.5 |
| Percentage of vaccinated persons with primary physician visit due to adverse effects of vaccination | 0.5% |
| Lost working days due to primary physician visit due to adverse effects of vaccination, per vaccination | 0.01 |
| Direct costs of illness, Switzerland, CHF | 41,684,816 |
| Indirect costs of illness, Switzerland, CHF | 168,834,228 |
| Totale costs of illness, Switzerland, CHF | 210,519,044 |
| Working days lost due to illness, Switzerland | 1,058,373 |
| Costs caused by vaccination, Switzerland, CHF | 8,341,600 |
| Vaccine effectiveness (prevention of disease) | 79% |
| Number of influenza cases, Switzerland | 391,569 |
| Number of influenza cases prevented by vaccination, Switzerland | 31,931 |
| Vaccine effectiveness (prevention of primary physician visits) | 32% |
| Visits to primary care physicians per year due to influenza, Switzerland | 190,524 |
| Number of visits to primary care physicians prevented by vaccination, Switzerland | 5964 |
| Vaccine effectiveness (prevention of hospitalisations) | 46% |
| Hospitalisations due to influenza, per year, Switzerland | 2,421 |
| Number of hospitalisations prevented by vaccination, Switzerland | 111 |
| Hospital days per year, Switzerland | 7986 |
| Number of hospital days prevented by vaccination, Switzerland | 365 |
| Vaccine effectiveness (prevention of death) | 65% |
| Mortality per 10,000 population | 0.025 |
| Deaths per year, Switzerland | 99 |
| Number of deaths prevented by vaccination, Switzerland | 7 |
| Life-years lost due to influenza per year, Switzerland | 1808 |
| Loss of life-years prevented by vaccination, Switzerland | 120 |
We thank pharmaSuisse and the Swiss FOPH for providing data on influenza vaccinations in Swiss pharmacies and for Switzerland in general, respectively.
SPK is supported by the Swiss National Science Foundation (grant no. 32003B_156902).
SPK has received travel grants from Astellas and Pfizer and speakers honoraria from Mepha.
1 Kuster SP , Shah PS , Coleman BL , Lam PP , Tong A , Wormsbecker A , et al. Incidence of influenza in healthy adults and healthcare workers: a systematic review and meta-analysis. PLoS One. 2011;6(10):e26239. doi:.https://doi.org/10.1371/journal.pone.0026239
2 Sullivan KM . Health impact of influenza in the United States. Pharmacoeconomics. 1996;9(Suppl 3):26–33, discussion 50–3. doi:.https://doi.org/10.2165/00019053-199600093-00008
3Bundesamt für Gesundheit (BAG). Saisonale Grippe - Lagebericht Schweiz. Erhältlich auf: www.bag.admin.ch/bag/de/home/krankheiten/ausbrueche-epidemien-pandemien/ aktuelle-ausbrueche-epidemien/saisonale-grippe---lagebericht-schweiz.html. [Accessed 26 October 2018].
4Piercy J, Miles A. The economic impact of influenza in Switzerland: interpandemic situation. Bern: Swiss Federal Office of Public Health, Division of Epidemiology and Infectious Diseases, Section of Viral Diseases and Sentinel Systems; 2003.
5 Bundesamt für Gesundheit. Saisonale Grippe 2011/2012: Zeit, sich impfen zu lassen. BAG Bulletin. 2011;42:899–901.
6 McBean AM , Babish JD , Warren JL . The impact and cost of influenza in the elderly. Arch Intern Med. 1993;153(18):2105–11. doi:.https://doi.org/10.1001/archinte.1993.00410180051005
7 Bundesamt für Gesundheit. Wochenbericht zu den grippeähnlichen Erkrankungen. BAG Bulletin. 2018;18:6–9.
8 Nicoll A . Personal (non-pharmaceutical) protective measures for reducing transmission of influenza--ECDC interim recommendations. Euro Surveill. 2006;11(10):E061012.1.
9Bundesamt für Gesundheit (BAG). Saisonale Grippe: So können wir uns schützen. Available at: www.impfengegengrippe.ch/files/downloads/ 17_EP_Factsheet_Allg_d_17.pdf. [Accessed 26 October 2018].
10 Smith CE . Prospects for the control of infectious disease. Proc R Soc Med. 1970;63(11 Part 2):1181–90. doi:.https://doi.org/10.1177/003591577006311P206
11 Kissling E , Nunes B , Robertson C , Valenciano M , Reuss A , Larrauri A , et al.; I-MOVE case–control study team. I-MOVE multicentre case-control study 2010/11 to 2014/15: Is there within-season waning of influenza type/subtype vaccine effectiveness with increasing time since vaccination? Euro Surveill. 2016;21(16):30201. doi:.https://doi.org/10.2807/1560-7917.ES.2016.21.16.30201
12 Kissling E , Rondy M ; I-MOVE/I-MOVE+ study team. Early 2016/17 vaccine effectiveness estimates against influenza A(H3N2): I-MOVE multicentre case control studies at primary care and hospital levels in Europe. Euro Surveill. 2017;22(7):30464. doi:.https://doi.org/10.2807/1560-7917.ES.2017.22.7.30464
13 Rondy M , Kissling E , Emborg HD , Gherasim A , Pebody R , Trebbien R , et al.; I-MOVE/I-MOVE+ group. Interim 2017/18 influenza seasonal vaccine effectiveness: combined results from five European studies. Euro Surveill. 2018;23(9):18–00086. doi:.https://doi.org/10.2807/1560-7917.ES.2018.23.9.18-00086
14 Valenciano M , Kissling E , Larrauri A , Nunes B , Pitigoi D , O’Donnell J , et al.; I-MOVE primary care multicentre case-control team. Exploring the effect of previous inactivated influenza vaccination on seasonal influenza vaccine effectiveness against medically attended influenza: Results of the European I-MOVE multicentre test-negative case-control study, 2011/2012-2016/2017. Influenza Other Respir Viruses. 2018;12(5):567–81. doi:.https://doi.org/10.1111/irv.12562
15Robert Koch Institut (RKI). Schutzimpfung gegen Influenza (Grippe). Available at: https://www.rki.de/DE/Content/Infekt/Impfen/ImpfungenAZ/Influenza/Influenza.html. [Accessed 26 October 2018].
16 www.impfengegengrippe.ch/de-ch/impfung/impfempfehlungen.html.
17Bundesamt für Gesundheit (BAG). Nationale Strategie zu Impfungen (NSI). Available at: https://www.bag.admin.ch/bag/de/home/strategie-und-politik/nationale-gesundheitsstrategien/nationale-strategie-impfungen-nsi.html. [Accessed 26 October 2018].
18pharmaSuisse. Impfen in der Apotheke: Bestandsaufnahme und Erfahrungen der Apotheken. Bericht vom 16. August 2018. Available at: https://vaccinationenpharmacie.ch/assets/aktuelles/7-pharmasuisse-studie-impfen-2018-08-16.pdf. [Accessed 26 October 2018].
19Versicherung CSS. CSS Blog. Available at: https://blog.css.ch/de/gesundheit/grippe/sinnvolle-grippeimpfung/. [Accessed 26. October 2018].
20Bundesamt für Statistik (BfS). Bilanz der ständigen Wohnbevölkerung nach Kanton, 1991-2016. Available at: www.bfs.admin.ch/bfs/de/home/statistiken/bevoelkerung/stand-entwicklung/bevoelkerung.assetdetail.3222015.html. [Accessed 06 July 2018].
21Bundesamt für Statistik (BfS). Erwerbs-, Haus- und Familienarbeit. Available at: bfs.admin.ch/bfs/de/home/statistiken/bevoelkerung/familien/erwerbs-haus-familienarbeit.html. [Accessed 26 October 2018].
22Bundesamt für Statistik (BfS). Ständige und nichständige Wohnbevölkerung nach institutionellen Gliederungen, Staatsangehörigkeit (Kategorie), Geschlecht und Alter. Available at: www.bfs.admin.ch/bfs/de/home/statistiken/bevoelkerung/stand-entwicklung.assetdetail.3262116.html. [Accessed 26 October 2018].
23Swiss DRG. Fallpauschalenkatalog. Available at: www.swissdrg.org/de/akutsomatik/swissdrg-system-60/fallpauschalenkatalog. [Accessed 26 October 2018].
24Aerztegesellschaft des Kantons Zürich. Taxpunktwerte für den Kanton Zürich. Available at: https://aerzte-zh.ch/pdf/Informationen/tarmed/ Taxpunktwerte%20f%C3%BCr%20den%20Kanton%20Zuerich_NEU%20mit%20Logo.pdf. [Accessed 26 October 2018].
25Krankenversicherung (Referenztarife ab 2016). Amtsblatt des Kantons Zürich, Nr. 1, Freitag, 08. Januar 2016. Available at: https://gd.zh.ch/dam/gesundheitsdirektion/ direktion/themen/behoerden/spitalfinanzierung/stationaere_tarife_rrb_urteil/verfuegung_referenztarife_2016_amtsblatt.pdf.spooler.download.1452590218808.pdf/verfuegung_referenztarife_2016_amtsblatt.pdf. [Accessed 26 October 2018].
26Bundesamt für Statistik. Analyse der Kosten des Gesundheitswesens. Available at: www.bfs.admin.ch/bfs/de/home/statistiken/gesundheit/kosten-finanzierung/kosten.html. [Accessed 26 October 2018].
27CDC’s Advisory Committee on Immunization Practices (ACIP) Recommends Universal Annual Influenza Vaccination. Available at: www.cdc.gov/media/pressrel/2010/r100224.htm. [Accessed 26 October 2018].
28 Sander B , Kwong JC , Bauch CT , Maetzel A , McGeer A , Raboud JM , et al. Economic appraisal of Ontario’s Universal Influenza Immunization Program: a cost-utility analysis. PLoS Med. 2010;7(4):e1000256. doi:.https://doi.org/10.1371/journal.pmed.1000256
29 Schabas RE . Mass influenza vaccination in Ontario: a sensible move. CMAJ. 2001;164(1):36–7.
30 Fine P , Eames K , Heymann DL . “Herd immunity”: a rough guide. Clin Infect Dis. 2011;52(7):911–6. doi:.https://doi.org/10.1093/cid/cir007
31 Fine PE . Herd immunity: history, theory, practice. Epidemiol Rev. 1993;15(2):265–302. doi:.https://doi.org/10.1093/oxfordjournals.epirev.a036121
32 Fox JP , Elveback L , Scott W , Gatewood L , Ackerman E . Herd immunity: basic concept and relevance to public health immunization practices. Am J Epidemiol. 1971;94(3):179–89. doi:.https://doi.org/10.1093/oxfordjournals.aje.a121310
33 Galvani AP , Reluga TC , Chapman GB . Long-standing influenza vaccination policy is in accord with individual self-interest but not with the utilitarian optimum. Proc Natl Acad Sci USA. 2007;104(13):5692–7. doi:.https://doi.org/10.1073/pnas.0606774104
SPK is supported by the Swiss National Science Foundation (grant no. 32003B_156902).
SPK has received travel grants from Astellas and Pfizer and speakers honoraria from Mepha.