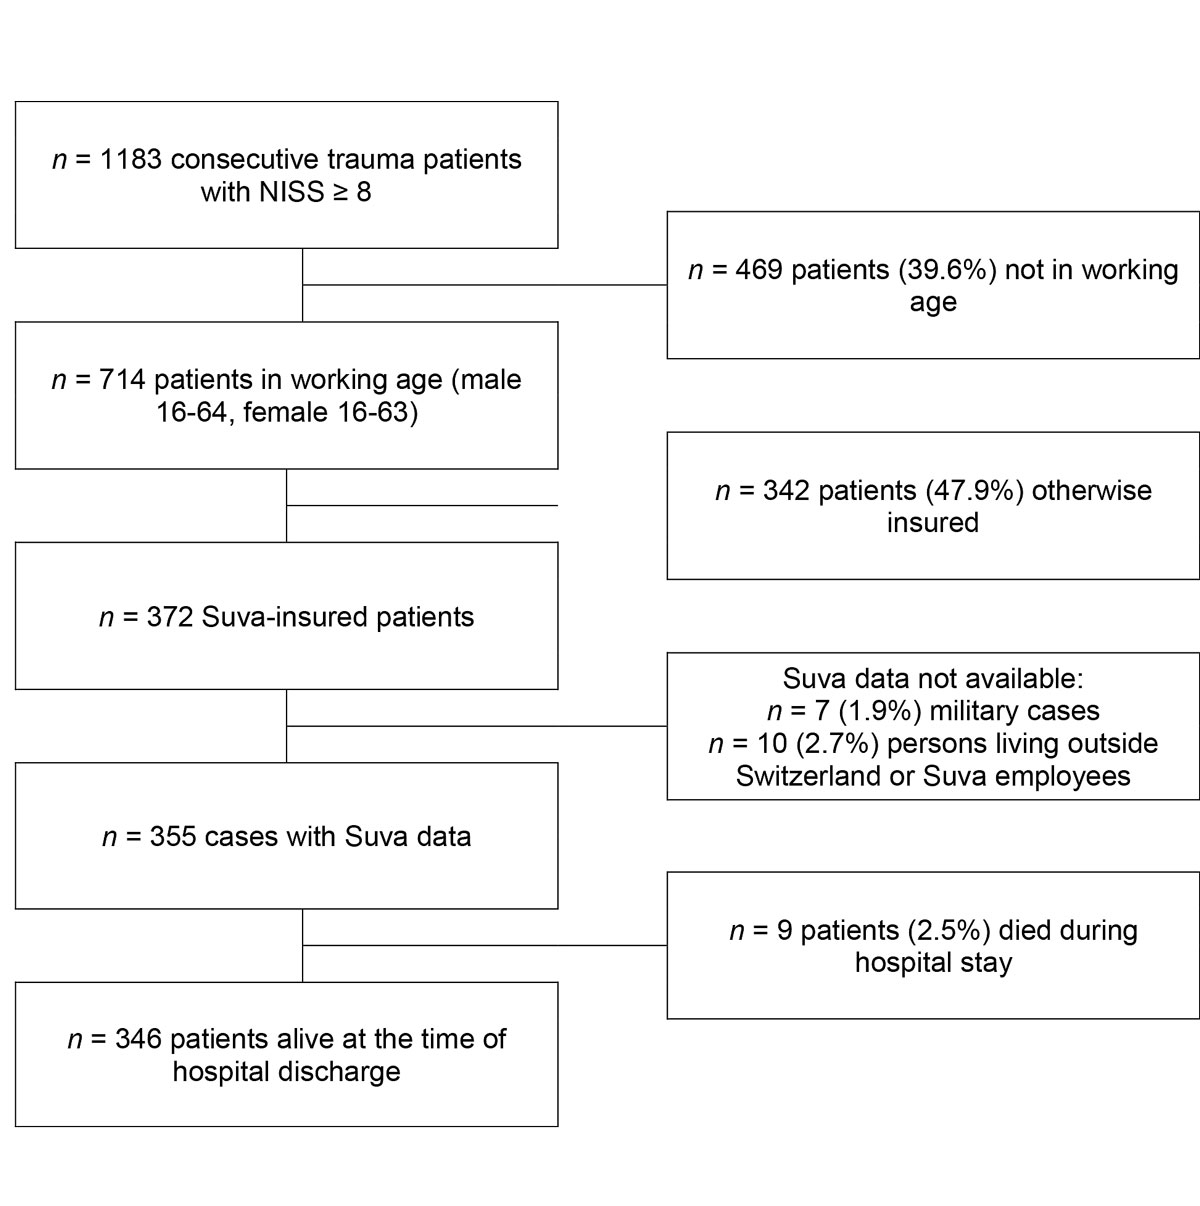
Figure 1 Study cohort flow-chart.
DOI: https://doi.org/10.4414/smw.2019.20144
Injury is a substantial cause of morbidity and mortality in both developed and developing countries [1]. The topic and the differences observed between countries are so important that a number of investigational groups, such as those involved in the Global Burden of Disease and Injury studies, have tried to quantify its important contribution to the overall burden of disease of injury deaths and disability by world regions [1]. Most of the relevant studies only report on outcomes such as mortality and morbidity [2–4]. In contrast, Nemunaitis et al. stated that trauma system effectiveness must rely on more than mortality statistics to assess the overall effectiveness of the system of care and the ultimate burden of injury on society [5]. The comprehensive measurement of function, disability, health and quality of life outcomes after injury is of fundamental importance to trauma care [6]. For the individual of working age, resulting disability has an important impact on his or her ability to return to work. Therefore, incapacity in itself, as well as the duration and degree of inability to work, are well accepted indicators of the daily functional status of the injured patient [7, 8]. From a socioeconomic perspective, particularly for the insurance systems of developed countries, quantifying resultant loss of labour and costs involved is indispensable. As a result of a consensus meeting, Ardolino et al. in 2012 concluded that return to work is an important longer-term outcome measure, albeit a complicated issue. The authors proposed assessment of return to work in an effort to fully estimate the burden of injury at individual and wider levels [9].
Currently, little is known about the prognostic factors that indicate longer-lasting reduced capacity for work (RCW) and/or the financial expenses associated with significant injury in people of working age. In 2016, Gabbe et al. stated a clear need for longer follow-up of patients to quantify the burden of major trauma more fully and to further improve prognostication [7]. Furthermore, reported predictors of return to work differ between studies [10]. In a systematic review on the topic, Clay et al. stated that surprisingly few studies assessed the role of potential determinants in multivariate analyses. They concluded that there is still insufficient evidence to reliably identify variables that act as prognostic determinants of return to work and duration of time away from work [11]. A recent systematic review documented the low level of reporting on compensation systems in studies of return to work or work disability, indicating the need to improve the reporting in published papers on compensation systems [12]. In particular, only small studies are available regarding the possible impact of patient, injury and initial trauma treatment risk factors on insurer related functional and financial longer-term outcomes [13, 14]. In Switzerland health insurance cover is compulsory for all residents living and all employees working in the country [15]. Moreover, all employees working in Switzerland are required by law to be specifically insured against accidents [16]. Those with accident insurance also benefit from financial compensation for subsequent disability, such as pensions or attendance allowances calculated on the basis of the insured person’s insured income [17]. The largest accident insurer, the Swiss National Accident Insurance Fund (Suva), insures approximately every second Swiss employee against the consequences of occupational and non-occupational accidents [18]. Despite such detailed regulations, to the authors’ knowledge, for Switzerland also no systematic evaluations are available investigating in a standardised, prospective manner the potential impact of sociodemographic, injury, early treatment and patient outcome related variables on RCW and associated accident insurer efforts in significantly injured patients.
Given this lack of knowledge, in a pilot scientific cooperation the main Swiss accident insurer Suva provided longer-term outcome and insurance data for further evaluation of consecutively collected trauma cases treated in a Swiss trauma centre. The present prospective longitudinal study had three main objectives:
This prospective longitudinal investigation took place at one of the 12 Swiss trauma centres officially assigned to the treatment of severe trauma (highly specialised medicine, HSM) and was approved by the regional ethics committee (PB_2018-00079). In the study period from 1 January 2010 to 31 December 2014 a total of 1183 patients aged ≥16 years who arrived at the hospital within 24 hours after sustaining injury were treated for significant trauma (New Injury Severity Score [NISS] ≥8). Of these, 714 were of working age (male aged 16–64 years, female 16–63 years at the time of accident), of whom 372 were insured by the Suva. After the exclusion of cases for which the Suva did not provide insurer data for procedural reasons, even though the patients were insured by the Suva (e.g., military cases, persons living outside Switzerland or employees of the company) and the exclusion of all those who died during hospital stay, 1 to 4 years of Suva-data were available for evaluation in 346 cases (see fig. 1).
Data were prospectively obtained and systematically recorded. All demographic, injury and treatment data were collected by specifically trained hospital study nurses not involved in the treatment of individual cases. Demographic characteristics included age at time of injury (years), gender (male/female) and nationality (Swiss yes/no). Pre-hospital variables were extracted from the ambulance or helicopter documentation. For the emergency period of treatment, the first available value, either preclinical or on arrival at the hospital, was used for analysis. Injury-related variables were first systolic blood pressure (mm Hg), first pulse rate, first respiratory rate, first oxygen saturation (%), trauma energy graded as high (traffic accident, fall from >3 m or a gunshot injury) or low (all other cases), monotrauma vs multiple injuries (Abbreviated Injury Scale [AIS] score >0 in at least two body regions), the Glasgow Coma Scale (GCS) score (first available value) [19], the mechanism, Glasgow Coma Scale, age and arterial pressure (MGAP) score [20], the AIS score [21], the ISS and NISS using version 2005, update 2008 of the TraumaRegister of the German Trauma Society(DGU®); the Glasgow Outcome Scale (GOS) score [22] at the end of hospitalisation, and expected risk-adjusted mortality measured with the Revised Injury Severity Classification 2 (RISC2) [23]. Injury severity was determined based on the maximum information available at the end of hospitalisation. In this context, “severe trauma” was defined according to the Swiss HSM trauma criteria: ISS ≥20 or an AIS head score ≥3 [24]. Treatment process variables included rescue by helicopter, secondary care (emergency transfer from another hospital), need for emergency intubation (yes/ no), emergency surgery (following the TraumaRegisterDGU® criteria, yes/ no), admittance to the intensive care unit (ICU, yes/ no), surgery (yes/no), length of hospital stay, mean nursing workload per patient (LEP®) [25], transfer to a rehabilitation clinic following initial hospital stay (yes/no) and discharge home after hospital stay (yes/no).
Patients were included in the group of “Suva-insured” on the basis of information given by the Suva. Under the terms of a contract agreed specifically for this investigation the following outcome variable data [13, 14] per patient were retrieved from insurance databases and supplied by the Suva:
Such costs (CHF) were cumulated over the 4-year follow-up period.
Direct healthcare costs include costs for ambulatory and inpatient cure, nursing costs, and expenses for rescue, medication, auxiliary devices etc. Direct health costs (CHF) were also cumulated for the 4-year period after injury. Integrity compensation is paid in cases of permanent physical or psychological infirmity, with the amount of recompense depending on the officially determined severity of impairment (0–100%, see Suva regulations) [14]. The integrity compensation at the time-point 4 years after the accident was taken for this evaluation (in %).
Further operationalisation and subsequent analysis of data, including original Suva variables, for this investigation were undertaken independently from the Suva. To allow any comparison with the literature, reduced RCW is displayed in two ways: (a) as a dichotomous variable (RCW yes/no), i.e., the fact of a partial or total incapacity to work following injury versus no incapacity to work, and (b) as a continuous variable, i.e., percent RCW (PRCW), mean percentages at the 1-, 2-, 3- and 4-year time-points (0-–100%). Patients may experience a fluctuating (in)ability to work (as illustrated in fig. 2 below), i.e., not all cases remain stable and capacity to work can improve or deteriorate over the years following injury, whereas the study objective was to obtain a comprehensive longer-term overview and not to only assess single years. Therefore, for the key operationalisation of patients’ longer-term incapacity for work an overall mean 4-year RCW (RCW 1–4y) and for further analysis, mean RCW over the years 2–4 (RCW 2–4y) after injury were calculated and used.
Results are presented as mean ± standard deviation (SD) and medians with quartiles or number and percent. All statistical tests were two-tailed. Parametric Student’s t-test and nonparametric Mann-Whitney U-test were used for comparison of means. Chi-square analysis was used to test categorical data. Pearson correlations were used to calculate univariate relationships between independent and dependent variables. In the univariate analysis, missing data were excluded case-wise or for correlations pair-wise. For uni- and multivariate analysis, R2 (coefficient of determination) is given to highlight the strength of relationship of the effects found. For multivariate regression models the adjusted R2 was used for interpretation. Linear regression analyses were calculated including all variables found to be significant in univariate analysis except composite variables like (N)ISS, RISC or MGAP due to their multicollinearity with their variables of origin. Due to their highly skewed distribution, insurance costs were transformed into logarithmic values for further analysis. Variables were organised in expedient blocks: (1) demographic variables; (2) trauma mechanism; (3) injury-related variables; (4) treatment-related variables; (5) patient’s condition at hospital discharge. In each of those blocks, variables were entered forward stepwise, with an entry criterion of p <0.05. Because the presented variable data were almost complete (26 patients with any missing value and a maximum of 7 missing values per variable), missing values were replaced by the mean values of the total sample. In the tables, B with 95% confidence interval (CI), beta and p-value of the last model as well as R2, adjusted R2, R2 change and p-value change for each step are shown. Data were analysed using SPSSTM for Windows 24 (Armonk, NY: IBM Corp, USA), and a p value <0.05 was considered significant.
The investigation included 346 significantly injured Suva-insured patients, all aged >15 years and treated at a Swiss trauma centre (fig. 1). Thirty-five percent of patients (n = 121) experienced a RCW at least once over the four annual observational time-points. Details of the study cohort comparing the subgroups of patients with or without a RCW in terms of baseline sociodemographic, injury, treatment process and outcome characteristics as well as longer-term insurance-related variables are given in table 1.
Figure 1 Study cohort flow-chart.
Table 1 Descriptive data for survivors of trauma (n = 346) grouped according to reduced capacity for work (RCW yes/no) experienced at least once during the four year observation period (continuous variables).
| Variables | Total (n = 346) | No RCW (n = 225) | RCW (n = 121) | R2 |
p-value (parametric
nonparametric) |
|---|---|---|---|---|---|
|
Mean ± SD and median (quartiles)
or n (%) |
Mean ± SD and median (quartiles)
or n (%) |
Mean ± SD and median (quartiles)
or n (%) |
|||
| 1. Demographic | |||||
| Age at accident (years) | 40.8 ± 14.7 43 (27:53) |
39.2 ± 15.0 40 (25:53) |
43.7 ± 13.8 47 (33:55) |
0.02 |
0.007
0.009 |
| Gender, female | 47 (13.6%) | 35 (15.6%) | 12 (9.9%) | 0.01 | 0.145 |
| Swiss | 243 (72.5%) | 170 (77.6%) | 73 (62.9%) | 0.02 | 0.004 |
| 2. Trauma mechanism | |||||
| High trauma energy | 209 (60.6%) | 130 (58.0%) | 79 (65.3%) | 0.01 | 0.189 |
| Car accident | 46 (13.3%) | 28 (12.5%) | 18 (14.9%) | 0.00 | 0.537 |
| Traffic accident except car | 104 (30.1%) | 72 (32.1%) | 32 (26.4%) | 0.00 | 0.273 |
| High fall | 58 (16.8%) | 30 (13.3%) | 28 (23.1%) | 0.02 | 0.020 |
| Rescue by helicopter | 50 (14.5%) | 27 (12.0%) | 23 (19.0%) | 0.01 | 0.077 |
| Secondary care | 86 (24.9%) | 58 (25.8%) | 28 (23.1%) | 0.00 | 0.590 |
| 3. Injury-related | |||||
| 1st systolic blood pressure (mm Hg) | 133.7 ± 20.5 133 (120:146) |
132.7 ± 18.7 133 (121:145) |
135.6 ± 23.6 135 (119:150) |
0.00 | 0.223 0.455 |
| 1st pulse (bpm) | 86.6 ± 18.1 85 (75:99) |
86.8 ± 17.7 85 (75:99) |
86.2 ± 19.0 88 (73:96) |
0.00 | 0.792 0.950 |
| 1st SaO2 (%) | 96.5 ± 4.1 98 (95:99) |
96.5 ± 4.1 98 (96:99) |
96.5 ± 4.2 98 (95:100) |
0.00 | 0.979 0.707 |
| 1st GCS | 13.3 ± 3.4 15 (14:15) |
13.8 ± 2.9 15 (14:15) |
12.5 ± 4.1 15 (13:15) |
0.03 |
0.001
0.003 |
| ISS | 14.2 ± 8.0 12 (9:18) |
12.6 ± 6.5 10 (9:17) |
17.2 ± 9.5 16 (9:22) |
0.07 |
<0.001
<0.001 |
| NISS | 19.1 ± 10.3 17 (12:22) |
16.8 ± 8.6 14 (10:22) |
23.4 ± 11.9 22 (14:27) |
0.09 |
<0.001
<0.001 |
| MGAP | 26.3 ± 4.0 28 (25:29) |
26.9 ± 3.4 28 (27:29) |
25.1 ± 4.7 27 (23:29) |
0.04 |
<0.001
0.001 |
| RISC2 (%) | 2.5 ± 6.7 0.7 (0.4:1.6) |
1.6 ± 3.3 0.6 (0.4:1.2) |
4.2 ± 10.1 0.9 (0.5:2.3) |
0.03 |
<0.001
<0.001 |
| AIS1 head and neck | 1.6 ± 1.5 2 (0:3) |
1.5 ± 1.4 2 (0:3) |
1.9 ± 1.7 2 (0:3) |
0.01 | 0.058 0.074 |
| AIS2 face | 0.4 ± 0.8 0 (0:0) |
0.4 ± 0.8 0 (0:0) |
0.3 ± 0.9 0 (0:0) |
0.00 | 0.705 0.367 |
| AIS3 chest | 1.0 ± 1.4 0 (0:3) |
0.9 ± 1.3 0 (0:2) |
1.2 ± 1.5 0 (0:3) |
0.02 |
0.019
0.026 |
| AIS4 abdomen | 0.5 ± 1.1 0 (0:0) |
0.5 ± 1.0 0 (0:0) |
0.6 ± 1.1 0 (0:1) |
0.00 | 0.558 0.688 |
| AIS5 extremities and pelvis | 1.3 ± 1.2 2 (0:2) |
1.2 ± 1.2 1 (0:2) |
1.5 ± 1.2 2 (0:3) |
0.02 |
0.014
0.013 |
| AIS6 external | 0.3 ± 0.6 0 (0:1) |
0.3 ± 0.5 0 (0:1) |
0.3 ± 0.6 0 (0:1) |
0.00 | 0.893 0.511 |
| AIS head | 1.6 ± 1.5 2 (0:3) |
1.4 ± 1.5 2 (0:3) |
1.8 ± 1.7 2 (0:3) |
0.01 |
0.047
0.066 |
| AIS spine | 0.7 ± 1.1 0 (0:2) |
0.5 ± 1.0 0 (0:2) |
0.9 ± 1.4 0 (0:2) |
0.02 |
0.011
0.074 |
| AIS extremities | 1.1 ± 1.2 1 (0:2) |
1.0 ± 1.1 0 (0:2) |
1.5 ± 1.2 2 (0:3) |
0.03 |
0.001
0.001 |
| ISS >15 | 126 (36.4%) | 61 (27.1%) | 65 (53.7%) | 0.07 | <0.001 |
| Multiply injured | 249 (72.0%) | 164 (72.9%) | 85 (70.2%) | 0.00 | 0.603 |
| 4. Treatment-related | |||||
| LEP total | 5180 ± 6030 3090 (1630:5910) |
3510 ± 4320 2240 (1290:4270) |
8280 ± 7390 5570 (3000:11550) |
0.14 |
<0.001
<0.001 |
| LOS (days) | 11.4 ± 9.5 8.8 (4.1:16.0) |
9.4 ± 8.1 6.8 (3.8:12.9) |
15.1 ± 10.6 13.9 (7.2:20.6) |
0.08 |
<0.001
<0.001 |
| Emergency surgery | 30 (8.7%) | 10 (4.4%) | 20 (16.5%) | 0.04 | <0.001 |
| Surgery | 225 (65.0%) | 129 (57.3%) | 96 (79.3%) | 0.05 | <0.001 |
| ICU admission | 186 (53.8%) | 101 (44.9%) | 85 (70.2%) | 0.06 | <0.001 |
| Intubation (preclinical or emergency room) | 52 (15.0%) | 19 (8.4%) | 33 (27.3%) | 0.06 | <0.001 |
| Intubation (ICU) | 79 (22.8%) | 29 (12.9%) | 50 (41.3%) | 0.10 | <0.001 |
| 5. Hospital outcome | |||||
| GOS (hospital discharge) | 4.8 ± 0.5 5 (5:5) |
4.9 ± 0.2 5 (5:5) |
4.5 ± 0.7 5 (4:5) |
0.14 |
<0.001
<0.001 |
| GOS not well recovered | 48 (14.0%) | 10 (4.5%) | 38 (31.7%) | 0.14 | <0.001 |
| Transfer to rehabilitation clinic after leaving hospital | 94 (27.2%) | 34 (15.1%) | 60 (49.6%) | 0.14 | <0.001 |
| Not discharged home | 140 (40.5%) | 59 (26.2%) | 81 (66.9%) | 0.16 | <0.001 |
| 6. Insurance-related | |||||
| PRCW 1 year (%) | 27.0 ± 41.9 0 (0: 55) |
– | 77.3 ± 33.7 100 (50: 100) |
– | – |
| PRCW 2 years (%) | 18.0 ± 36.0 0 (0: 0) |
– | 51.5 ± 44.6 50 (0: 100) |
– | – |
| PRCW 3 years (%) | 14.3 ± 32.7 0 (0: 0) |
– | 41.1 ± 44.5 20 (0: 100) |
– | – |
| PRCW 4 years (%) | 13.7 ± 31.7 0 (0: 0) |
– | 39.4 ± 43.3 18 (0: 100) |
– | – |
| Mean PRCW 1–4 years (%) | 18.1 ± 31.1 0 (0: 26) |
– | 51.9 ± 31.9 50 (25: 82) |
– | – |
| Integrity compensation rate | 9.3 ± 20.6 0 (0: 10) |
1.2 ± 4.8 0 (0: 0) |
24.4 ± 28.9 15 (0: 40) |
0.29 | <0.001 <0.001 |
| Direct healthcare costs (CHF) | 80,110 ± 117,530 36,870 (15,850: 88,810) |
32,170 ± 37,600 19,220 (11,790: 39,460) |
169,260 ± 157,320 113,840 (70,520: 213,760) |
0.48 (log) | <0.001 <0.001 |
| Insurance costs without direct healthcare costs (CHF) | 96,140 ± 23,6930 20,050 (5840: 70,550) |
14,590 ± 15,103 8950 (3280: 21,320) |
247,781 ± 354,000 131,300 (62,740: 270,810) |
0.54 (log) | <0.001 <0.001 |
| Total insurance costs (CHF) | 176,250 ± 314,800 64,680 (23,890: 204,040) |
46,760 ± 45,380 31,510 (18,130: 63,550) |
417,040 ± 437,230 298,660 (164,470: 463,050) |
0.60 (log) | <0.001 <0.001 |
| RCW 1–4 years (yes) | 121 (35.0%) | – | 121 (100.0%) | – | – |
| Integrity compensation rate >0 | 102 (29.5%) | 21 (9.3%) | 81 (66.9%) | 0.36 | <0.001 <0.001 |
AIS = Abbreviated Injury Scale; BP = blood pressure; GCS = Glasgow Coma Scale score; GOS = Glasgow Outcome Scale; ICU = intensive care unit; Integrity compensation rate >0 = financial claim paid by the insurer in cases of permanent physical or mental infirmity (yes/no); LEP total = nursing workload per patient during hospital stay; LOS = length of hospital stay; mean PRCW = mean percentage incapacity to work 1–4 years (%), indicating the particular percentage of incapacity to work over the 4 year follow-up; MGAP = mechanism, Glasgow Coma Scale score age and arterial pressure; (N)ISS = (New) Injury Severity Score; PRCW = percentage incapacity for work at years 1, 2, 3 and 4 (%), given for the four yearly observational time points each beginning from exactly 1 to 4 years after injury; RCW 1–4 years (yes) = RCW recorded at least once during the 1 to 4 years after injury; RISC2 = Revised Injury Severity Classification 2 (%); SaO2 = oxygen saturation (%); SD = standard deviation
One year after trauma, the average percentage of reduced capacity to work (PRCW) was 27.0%. In the subgroup of patients with a RCW, the average PRCW was 77.3%. The percentage of individuals with a RCW decreased from 32.7% at 1 year to 19.9% at 4 years after injury, with 10.4% being fully and 9.5% partly incapable of work at 4 years. The percentage of patients not fully capable of working but fully capable 1 year later decreased from 10.7% at 1 year to 1.7% 3 years after trauma (fig. 2). Overall, 6.9% of the injured did not return to work during the 4-year study period. The number of patients with a RCW did not decrease between the third and fourth year after trauma. A RCW between 1 and 4 years following injury was twice as likely in patients with major trauma (ISS >15; 51.6%) than in the less severely injured (25.5%, p <0.001; see supplementary table S1 in appendix 1). Correspondingly, all other investigated Suva outcome variables, such as integrity compensation rate or insurance costs on average showed higher values in major trauma patients (all p <0.001). Not all patients with a RCW were fully (100%) incapable of working. One year after significant injury, 22.3% of all patients were fully and 10.4% were partly incapable of working. These percentages decreased to 14.5% and 8.7%, respectively, at year 2, and to 11.3% and 8.4%, respectively, at year 3, and stabilised at 10.4% and 9.4%, respectively, at year 4 (table S2). Patients’ change of capacity to work over the observation period is illustrated in figure 2, which shows an annual increase with a maximum at the last follow-up. The illustration depicts how the percentage of RCW patients who are again capable of working the following year changed from 10.7% of the entire population in the first year to 1.7% in the third year after trauma. On the other hand, each year 1–2% of all patients presented with a deterioration in their ability to work.
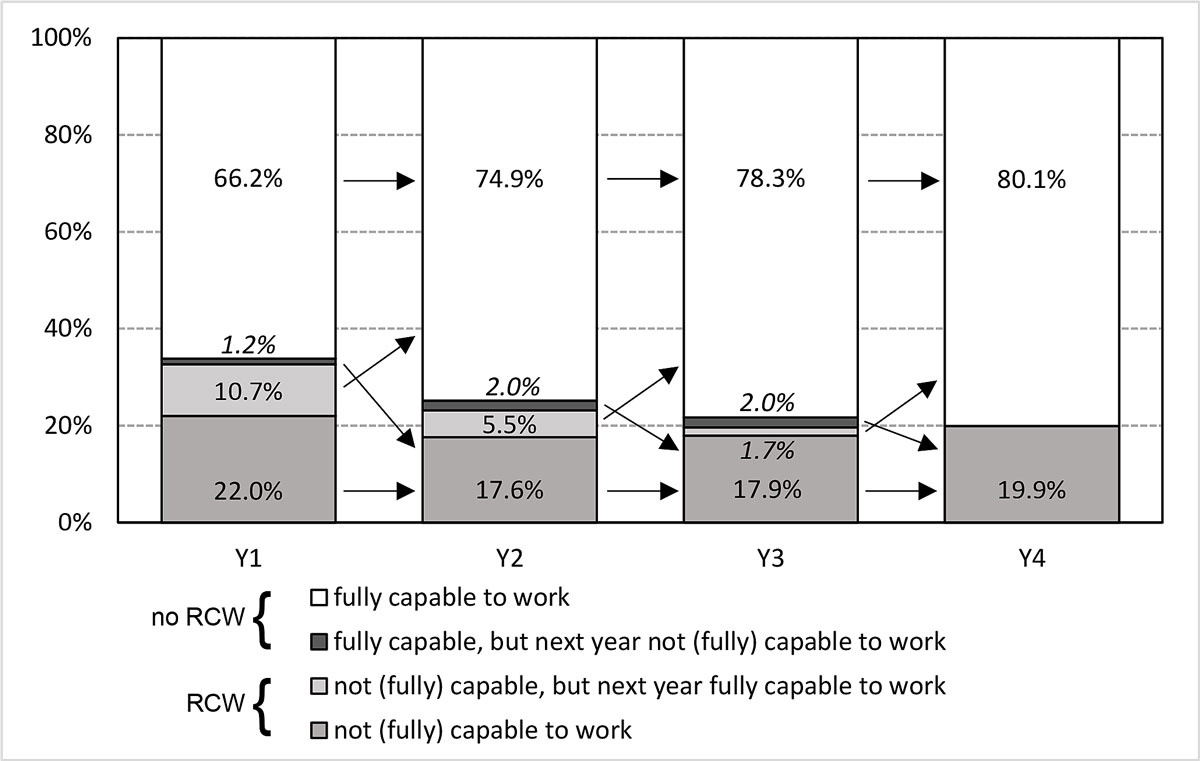
Figure 2 Change in capacity to work after 1 to 4 years. Arrows indicate case changes between subgroups: By definition, the two central groups (coloured black and light grey) include all patients with a changing capability to work between single years, i.e. being capable or not (fully) capable to work in the according year, but not anymore in the following year
In comparison with patients with no RCW at any point, patients who had not regained their full capacity to work (RCW) at any of the four observational time-points were found to be significantly older, less likely to be Swiss, to have sustained more severe injuries (both in the NISS and ISS) and, especially with spinal injuries, were more likely to have undergone early intubation (table 1), In addition, patients who experienced a RCW stayed longer in hospital, were in a worse condition at the time of hospital discharge (GOS score) and were more often discharged into a rehabilitation clinic. Insurer’s medical expense payments were several times higher for RCW than for non-RCW cases (p <0.001).
From an insurer’s perspective, the resulting integrity compensation rate per patient yielded a relevant correlation with the mean incapacity to work over the 4-year observation period (Pearson r = 0.57, R2 = 0.33), with an average integrity compensation rate of 24.4% in RCW cases versus 1.3% in non-RCW cases (p <0.001). The Suva calculated mean total insurance costs per significantly injured patient to be CHF 176,000 ± 315,000, and almost 10 times higher in cases with a RCW at least once over the 4-year period than in those with no RCW (p <0.001; table 1). Thus, 81% of the significantly injured caused insurance costs ranging from CHF 10,000 to one million; for 4.2% of patients’ expenses were expected to exceed one million CHF. Figure 3 illustrates the distribution of lifetime expected total insurance costs per case, also for the groups with and without RCW. Figure 4 shows that 10% of trauma survivors accounted for 87.5% of the study cohort’s total insurance costs, 75.9% of healthcare costs and 92.5% of integrity compensation costs.
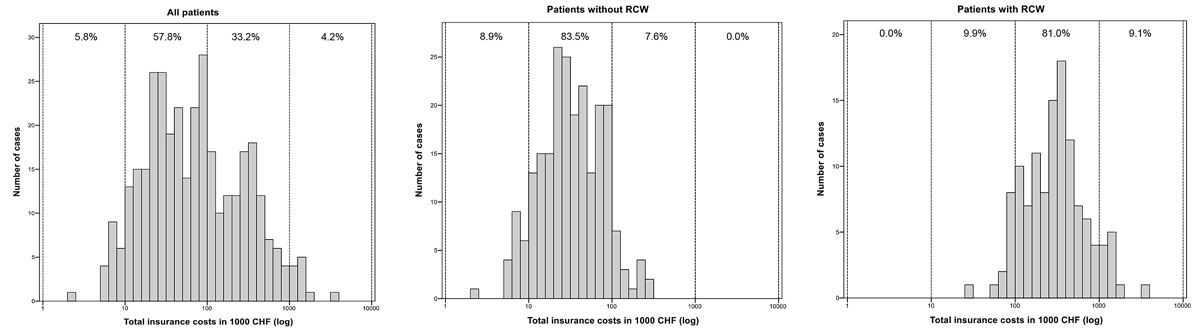
Figure 3 Total insurance costs for patients: All patients and subgroups with and without reduced capacity for work (RCW).
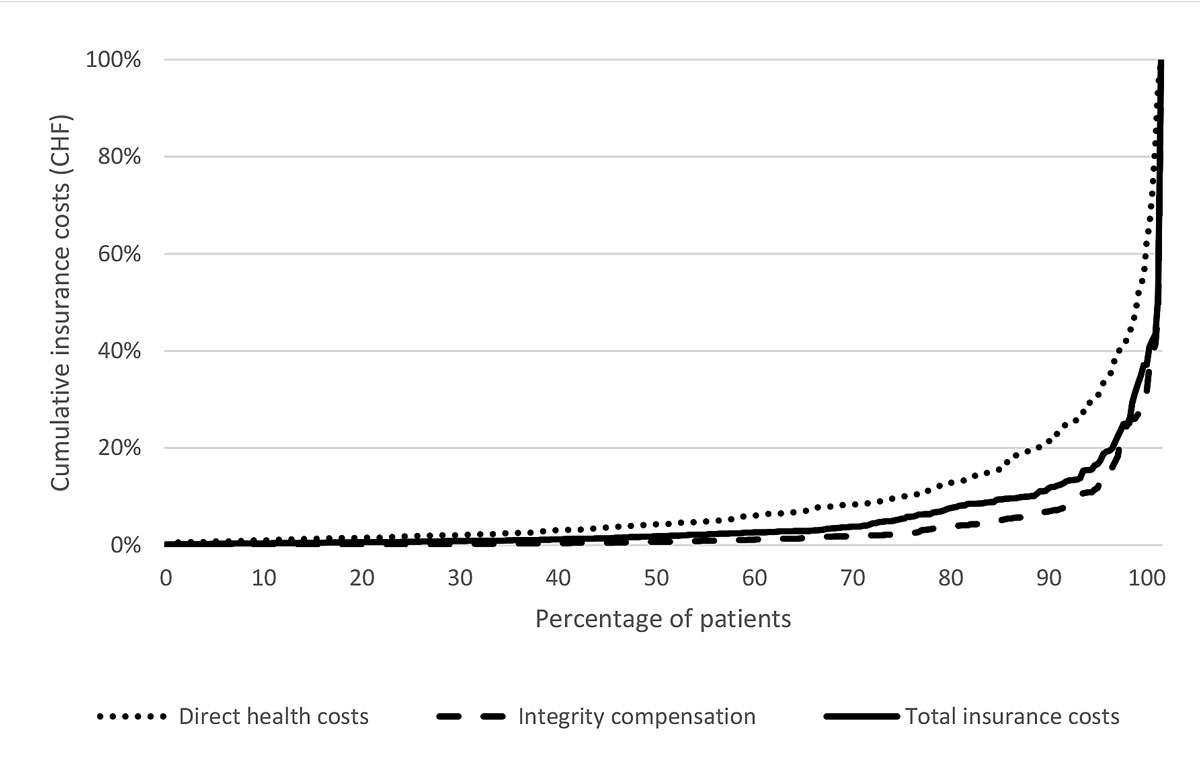
Figure 4 Percent distribution of cumulative insurance costs per percentage of patients.
In univariate analysis (fig. 5), the highest associations with all investigated longer-term accident-insurer variables was found for the outcome at hospital discharge measured as the GOS score (best with direct healthcare costs, Pearson r = 0.65). Total insurance costs demonstrated a moderate association with injury severity (NISS) and expected mortality (RISC2; all Pearson r >0.45). Integrity compensation correlated second best with the NISS (Pearson r = 0.44).
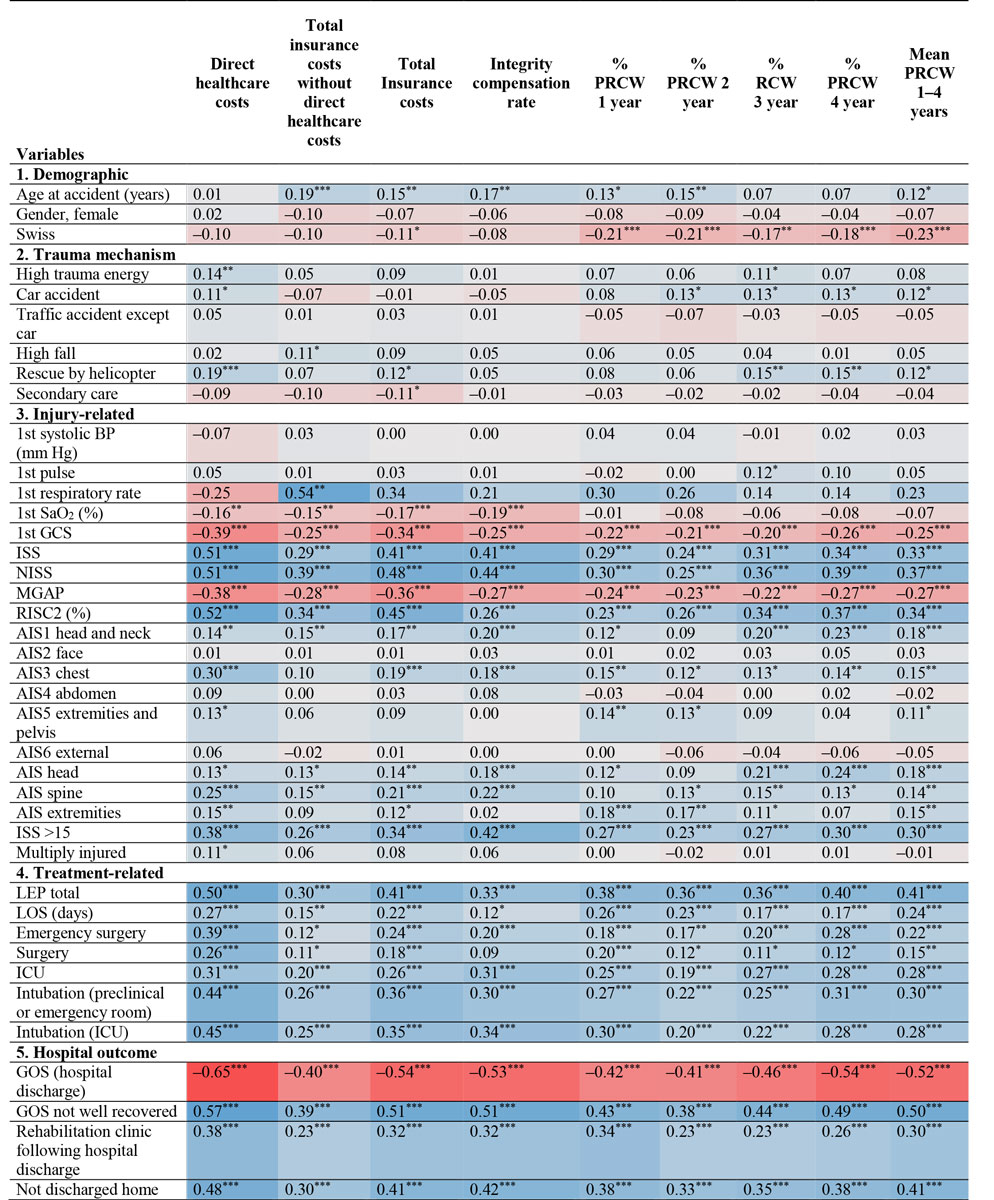
Figure 5 Univariate correlations of insurer outcome data with patient, trauma, treatment and hospital outcome variables for survivors of trauma.
*** p <0.001, ** p<0.01, * p <0.05; the power of the statistical interrelation (r) is illustrated by the intensity of the particular colour used: red for negative and blue for positive correlations.
AIS = Abbreviated Injury Scale score; BP = blood pressure; GCS = Glasgow Coma Scale score; GOS = Glasgow Outcome Scale score ICU = intensive care unit; MGAP = mechanism, Glasgow Coma Scale score age and arterial pressure; LEP total = mean nursing workload per patient during hospital stay; LOS = length of hospital stay; (N)ISS = (New) Injury Severity Score; PRCW = percentage incapacity for work; RISC2 = Revised Injury Severity Classification 2 (%); SaO2 = oxygen saturation (%)
In multivariate analysis of PRCW (table 2), the demographic variables “not being Swiss” and “higher age” together explained 7% (non-adjusted) of the variance of the mean PRCW 1–4 years after trauma. Trauma mechanism (car accidents) added 1%, injury-related variables 17%, hospital treatment (LEP and intubation) and patient condition variables (GOS at hospital discharge) another 6% and 11%, respectively, to give a total of 42% of the variance (non-adjusted) or 40% (adjusted). To answer the question as to which variables are most important in explaining the change of PRCW over the years 2–4, we additionally calculated a linear regression analysis corrected for PRCW in the first year (see supplementary table S3 in appendix 1). Trauma mechanism and injury severity (car accident, higher AIS head and AIS spine, and higher first pulse rate explained 4%, treatment-related variables (LEP and intubation ICU) added another 6% and patients’ condition at the time of hospital discharge (GOS at hospital discharge and not discharged home) an additional 4% of the change of PRCW over the years 2–4 after injury, to give an overall variance of 9% (non-adjusted) or 8% (adjusted).
Table 2 Multivariate analysis of demographic, injury, and early hospital characteristics of survivors of trauma explaining the mean PRCW 1–4 years after injury.
| Block | Model | Variable | Total model | Change at each step | |||||||
|---|---|---|---|---|---|---|---|---|---|---|---|
| B | 95% CI | Beta | p-value | R2 | Adjusted R2 | R2 change | p-value change | ||||
| Lower limit | Upper limit | ||||||||||
| (Constant) | 108.97 | 75.59 | 142.36 | 0.000 | |||||||
| 1 | 1 | Swiss | −13.94 | −19.82 | −8.07 | −0.20 | 0.000 | 0.05 | 0.05 | 0.05 | 0.000 |
| 2 | Age at injury (years) | 0.13 | −0.05 | 0.31 | 0.06 | 0.151 | 0.07 | 0.06 | 0.02 | 0.014 | |
| 2 | 3 | Car accident | 7.12 | −0.57 | 14.82 | 0.08 | 0.069 | 0.08 | 0.07 | 0.01 | 0.023 |
| 3 | 4 | 1st GCS <13 | −7.48 | −16.74 | 1.79 | −0.08 | 0.113 | 0.15 | 0.14 | 0.07 | 0.000 |
| 5 | AIS extremities | 5.32 | 2.96 | 7.69 | 0.21 | 0.000 | 0.18 | 0.17 | 0.03 | 0.001 | |
| 6 | AIS head | 3.06 | 1.04 | 5.08 | 0.16 | 0.003 | 0.21 | 0.20 | 0.03 | 0.000 | |
| 7 | AIS spine | 2.42 | 0.07 | 4.78 | 0.09 | 0.043 | 0.25 | 0.23 | 0.04 | 0.000 | |
| 4 | 8 | LEP total | 0.00 | 0.00 | 0.00 | 0.13 | 0.013 | 0.30 | 0.29 | 0.06 | 0.000 |
| 9 | ICU admission | 4.79 | −1.76 | 11.34 | 0.08 | 0.151 | 0.31 | 0.29 | 0.01 | 0.049 | |
| 5 | 10 | GOS (hospital discharge) | −22.43 | −28.61 | −16.26 | −0.37 | 0.000 | 0.41 | 0.40 | 0.10 | 0.000 |
| 11 | Not discharged home | 7.83 | 1.32 | 14.33 | 0.12 | 0.018 | 0.42 | 0.40 | 0.01 | 0.018 | |
AIS = Abbreviated Injury Scale score; CI = confidence interval; GCS = Glasgow Coma Scale score, first available value; GOS = Glasgow Outcome Scale; ICU = intensive care unit; LEP total = nursing workload per patient; PRCW = percentage RCW, percentage of reduced capacity to work Linear stepwise regression analysis: block 1 = demographic variables; block 2 = trauma mechanism; block 3 = injury-related variables; block 4 = treatment-related variables; block 5 = patient condition at hospital discharge
In the multivariate analysis of total insurance costs (table 3), demographic variables explained 7% of the variance. Trauma mechanism added 3%, injury-related variables 23%, hospital treatment and patient condition variables another 18% and 10%, respectively, to give a total of 61% (non-adjusted) or 60% (adjusted) variance.
Table 3 Multivariate analysis of demographic, injury and early hospital characteristics of survivors of trauma explaining logarithmic total insurance costs.
| Block | Model | Variable | Total model | Change at each step | |||||||
|---|---|---|---|---|---|---|---|---|---|---|---|
| B | 95% CI | Beta | p-value | R2 | Adjusted R2 | R2 change | p-value change | ||||
| Lower limit | Upper limit | ||||||||||
| (Constant) | 5.62 | 5.10 | 6.14 | 0.000 | |||||||
| 1 | 1 | Age at injury (years) | 0.00 | 0.00 | 0.01 | 0.10 | 0.004 | 0.03 | 0.03 | 0.03 | 0.001 |
| 2 | Swiss | −0.21 | −0.30 | −0.12 | −0.16 | 0.000 | 0.06 | 0.06 | 0.03 | 0.002 | |
| 3 | Gender, female | −0.12 | −0.25 | 0.00 | −0.07 | 0.054 | 0.07 | 0.07 | 0.01 | 0.030 | |
| 2 | 4 | High trauma energy | −0.03 | −0.12 | 0.05 | −0.03 | 0.444 | 0.10 | 0.09 | 0.02 | 0.003 |
| 3 | 5 | 1st GCS <13 | −0.05 | −0.19 | 0.10 | −0.03 | 0.524 | 0.17 | 0.16 | 0.07 | 0.000 |
| 6 | AIS extremities | 0.10 | 0.06 | 0.14 | 0.21 | 0.000 | 0.25 | 0.23 | 0.07 | 0.000 | |
| 7 | AIS spine | 0.08 | 0.05 | 0.12 | 0.17 | 0.000 | 0.31 | 0.29 | 0.06 | 0.000 | |
| 8 | AIS head | 0.02 | −0.01 | 0.05 | 0.05 | 0.223 | 0.33 | 0.31 | 0.02 | 0.001 | |
| 4 | 9 | LOS (days) | 0.01 | 0.01 | 0.02 | 0.22 | 0.000 | 0.45 | 0.43 | 0.12 | 0.000 |
| 10 | ICU admission | 0.18 | 0.08 | 0.29 | 0.16 | 0.001 | 0.49 | 0.47 | 0.04 | 0.000 | |
| 11 | Surgery | 0.18 | 0.08 | 0.28 | 0.15 | 0.001 | 0.51 | 0.49 | 0.02 | 0.000 | |
| 5 | 12 | GOS (hospital discharge) | −0.30 | −0.40 | −0.20 | −0.26 | 0.000 | 0.58 | 0.56 | 0.07 | 0.000 |
| 13 | Not discharged home | 0.28 | 0.18 | 0.38 | 0.23 | 0.000 | 0.61 | 0.60 | 0.37 | 29.283 | |
AIS = Abbreviated Injury Scale score; GCS = Glasgow Coma Scale score age and arterial pressure; GOS = Glasgow Outcome Scale score at the time of hospital discharge; ICU = intensive care unit; LOS = length of hospital stay Linear stepwise regression analysis: block 1 = demographic variables; block 2 = trauma mechanism; block 3 = injury-related variables; block 4 = treatment-related variables; block 5 = patient condition at hospital discharge
For healthcare costs only (table S4), demographic variables explained 1% of the variance, trauma mechanism added 3%, injury-related variables 26%, hospital treatment and patient condition variables at hospital discharge another 23% and 11%, respectively, to give a total variance of 64% (non-adjusted) or 63% (adjusted).
For insurer’s integrity compensation only, i.e., total insurance costs without direct healthcare costs (table S5), demographic variables explained 18% of the variance, trauma mechanism added 2%, injury-related variables 13%, hospital treatment and patient condition variables another 7% and 6%, respectively, to give a total variance of 46% (non-adjusted) or 44% (adjusted).
This first prospective longitudinal four-year follow-up evaluation of longer-term capacity to work and accident insurer costs relating to significantly injured persons treated at a Swiss trauma centre produced three major findings.
First, 1 year after trauma, every third patient presented with a resultant RCW. The mean incapacity to work in cases with a RCW was 77%. Over the 4-year observation period, apart from exceptions, more than half of the individuals with RCW had a steady increase in their capacity to work. On the other hand, from a yearly surveillance perspective, the number of patients with a RCW stagnated 3 years after trauma. Four years after injury, every fifth injured patient still reported a RCW, and every tenth patient was totally incapable of work. In the subgroup of more severely injured (ISS >15), RCW had already stagnated in the second year after trauma, with every third patient affected.
Reviewing the according literature, apart from a limited number of relevant investigations, the reader realises the constraint of poorly comparable cohorts in the various studies published, with important differences in national health management and insurance provision between different countries [7, 10, 14, 26–32]. This makes any comparison highly tentative. It appears that even the question of whether there is any improvement in RCW following trauma in developed countries over past decades due to recent medical improvements cannot be answered in a profound manner [7, 26]. Given, for example, the observed impact of patients’ injury severity on subsequent RCW (as discussed later), the observation that injury severity differs importantly between published cohorts (ISS >8 [30], ISS >10 [26], ISS >12 [7], mean ISS 14 [10], NISS >15 [28], ISS >15 [31], median ISS 17 [29], ISS >15 [27], mean NISS >20 [33], polytrauma [14]) makes it almost impossible to compare the resulting widely distributed data on capacity to work. In addition, in most cases only (no) return to work [10] or unemployment rates (26–48% at 1 year [26, 27], 29% at 4 years [29], after trauma) are presented. More detailed percentages of return to work or vice versa RCW (PRCW) are rarely published. The National Study on the Costs and Outcomes of Trauma (NSCOT) revealed an average 1-year RCW rate of about 50% for both trauma and non-trauma centres (mean NISS >20) [33]. To the best of our knowledge, for Switzerland also no well-contrastable information is available. The corresponding information on comparable longer-term RCW is even scarcer. Soberg et al. reported an increasing rate of complete return-to-work rate, at 29% 1 year after injury up to 49% 5 years after trauma. At five years, 23% of the injured were receiving full disability benefits [28]. Overall, the 1–4 year (P)RCW rates found for our Swiss cohort of significantly injured patients appear to be in line with the data published for other developed countries.
Second, as part of the exploration of possible associations of demographic, trauma, treatment and short-term outcome-related factors with an accident insurer’s measures of outcome, multivariable analysis showed that all the investigated parameters taken together provided 40% of the information predicting the mean PRCW between the 1- and 4-year time-points. Not unexpectedly, about half of this predictive power (17%) was explained by measures of injury severity, mostly on the GCS score, but also for injuries of the extremities, head and spine. The next most important predictive factor was found to be the patient’s condition on hospital discharge as measured in the GOS (10%). Other factors describing aspects of demography, injury mechanism or hospital treatment added only limited information to the prediction of longer-term RCW.
This information matches the literature, which indicates that the extent to which parameters of injury severity contribute to the prognosis of longer-term incapacity to work is less than might be assumed at first glance [34–36]. It appears plausible that, apart from age, it is mainly the severity of the trauma sustained that explains a patient’s resulting RCW [26]. In our study this was particularly valid when the block of variables constituting different aspects of injury severity, which remained significant in multivariable analysis, were bundled together. Among composite scorings of injury severity investigated (such as the ISS, NISS or RISC scores), which were excluded from multivariate analysis because of statistical collinearity effects, in univariate analysis the NISS (r2 = 14%) demonstrated the best correlation with longer-term RCW. Several authors reported on a significant correlation of injury severity with RCW as measured on the ISS or for specific injuries such as pelvis, spine or extremity lesions [7, 10, 27, 29] at least 1 year after injury. A large Danish trauma centre investigation found a relative increase in retirement risk of 1.04 (95% CI 1.03–1.05) per ISS point [37]. Similarly, of the sociodemographic factors investigated, a significant association of older age with worse outcome with regard to return-to-work was found in the literature [29, 37] and in the present study. We did not find any studies with which to compare our data with regard to the impact of patients’ nationality on longer-term capacity to work. The finding that not being Swiss was a significant risk for RCW and/or incapacity to work in the longer-term may be largely due to the fact that foreigners in Switzerland more often hold blue collar jobs and are consequently exposed to a higher risk of occupational injuries. This carries with it the longer-term consequence that a return to physical work is more difficult to achieve than with non-manual labour. In their single centre evaluation of 75 major trauma patients with 5-year follow-up data, Soberg et al. [28] found no correlation of injury severity (NISS), gender or age with return-to-work. Instead, they reported on higher education and white collar professions as significant predictors of longer-term return to work. We cannot comment on these findings as these variables were not part of our hospital data collection and could not be provided by the insurer. In a population-based, prospective cohort study using the Australian Victorian State Trauma Registry and including a total of 1086 working age individuals who had suffered major trauma (ISS >12), Collie et al. found that, compared with early sustained return to work, manual occupation and injury in a motor vehicle accident were predictors of delayed and/or no return to work [29]. In our Swiss cohort, multivariate analysis showed that victims of car accidents had a higher rate of RCW than other injured persons. Interestingly, following a systematic review of acute orthopaedic trauma, Clay et al. in 2010 concluded that, other than the role of education and blue collar work, there is insufficient evidence to reliably identify variables that act as prognostic determinants of return to work and agreed with other authors that there is a pressing need for larger more methodologically rigorous prospective studies [11].
A recent US study on over 950,000 trauma patients from the National Inpatient Sample included multivariate analysis and found length of stay (LOS) to depend on access to post-acute facilities, i.e., the authors reported a longer LOS in insured patients [38]. Even though the timely organisation of post-acute care is a challenge for Swiss centres also, one major difference compared with the US and other countries is that, because insurance is obligatory, there are hardly any patients without insurance. Nevertheless, daily experience suggests that there might be an impact on the LOS and on rehabilitation following hospital discharge in Switzerland due to differences in operational characteristics across the different commercial insurers [15]. In this study involving only cases insured by the largest Swiss accident insurer, a low correlation of longer LOS with later RCW was found in multivariate analysis. In addition, the need for ICU treatment enhanced the prediction of longer-term RCW. Surprisingly, even though measures of outcome and quality of life are increasingly acknowledged as an indispensable part of quality control in the treatment of trauma, we did not find any studies on the correlation of patient status at the time of hospital discharge with later return to work. In our investigation, poor patient health as measured on the GOS correlated second best with resultant longer-term incapacity to work. Ultimately, in agreement with the literature, only a small amount of the information necessary to predict a patient’s future susceptibility to RCW is already available at the time of hospital discharge. In this study of the significantly injured, it was possible to predict 40% of the variance of patients’ PRCW based on our study variables. Some work-related factors were not available for our evaluation, such as educational or professional level [11, 28, 29], opportunities for modified return to work [39], individual work satisfaction, personal attitude towards work in general, amount of self-efficacy, expectations for recovery and return to work [40]. These should be included in future studies in an effort to gain a better understanding of and potentially minimise patients’ RCW following trauma.
Third, with regard to total insurance costs arising as a result of the significantly injured, the Suva calculated a sum of about CHF 175,000 per person included in this study. The mean total insurance costs in cases with RCW at least once at any of the four annual observational time-points were found to be in the same range as those calculated for non-survivors (not included in this evaluation: CHF 400,000–450,000), i.e., almost 10 times higher than for individuals with no RCW. On the one hand, almost two thirds of cases generated insurance costs below CHF 100,000 but, on the other hand, in less than 5% of cases insurance costs exceeded CHF 1 million. This shows that, from the insurer’s perspective, one tenth of patients accounted for almost nine tenths of the total insurance costs needed for the total cohort. Studies of trauma-related medical economics indicate that most costs are incurred by a small number of working people who do not return to work [40]. With regard to the subcategory of healthcare costs (about CHF 80,000 per individual in our study), one tenth of the cases were responsible for three quarters of expenses. Whereas healthcare expenditures explained about three quarters of total Suva costs for individuals without RCW, they accounted for only two fifths for RCW patients. Overall Suva costs in the RCW group were mainly determined by long-term compensation payments: RCW cases had an almost 20-fold higher mean integrity compensation rate compared with non-RCW cases. Corso et al. estimated that in the USA in the year 2000 total medical and productivity losses resulting from injuries exceeded $400 billion with 80% of the total resulting from lost productivity [41]. Multivariate analysis of our data regarding accident-insurance costs demonstrated higher explained variances than those found for RCW (40%), with total insurer costs (60%) being best explained by combined variables of injury severity (23% variance), followed by treatment-related variables, especially length of stay (18% variance) and short-term outcome as revealed in the GOS (10% variance). The correlation of investigated parameters with direct healthcare costs only was somewhat higher (63%) whereas integrity compensation explained 44% of the variance – about the same as for PRCW. As we found no similar investigations in the literature to compare these data with and because of the main objectives and the pilot character of this investigation, we did not go into further details in the analysis of cost data. Given, for example, the specific injury-independent caveats related to the definition of single variables such as integrity compensation (e.g., whether included patients have children or the upper limit of salaries included) any interpretation has to be undertaken very carefully. For major trauma patients (ISS >15, year 2004) in an Australian centre, Rowel et al. estimated the average 1-year post-discharge direct and indirect costs to be A$78,577 and A$24,273, respectively. Ten years earlier, a retrospective single-centre study reported on Suva data in major trauma cases (ISS >13): at 5 years, one third of those injured were disabled, causing discounted average lifelong total costs of US$1,293,800.00, compared with the two thirds of patients who recovered without any disabilities with incurred costs of US$147,200. Two thirds of these costs were attributable to a loss of production [13]. Overall, comparing economic data is very difficult from an international point of view owing to differing health standards and insurance systems and any comparison has to be undertaken very carefully.
This study is not without limitations. In addition to the constraints already discussed, this Swiss cross-sectional study is basically limited to the cohort of patients and variables investigated and tested. A recent systematic review of 15 studies found 68 different factors to be examined as predictors of return to work [11]. Recent reviews demonstrated that, in addition to the variables investigated in our study, a variety of personal and social factors have positive and negative influences on sustainable return to work. If possible, future studies should therefore also include variables addressing social environment or personal factors such as attitudes and self-efficacy, as well as economic status, length of absence or job security [42]. The main longer-term outcome measures of our inquiry, such as RCW, were restricted to official accident-insurer data with the advantage of offering a 95% follow-up rate, which is much higher than normally presented in the literature. As such, the medically graded (P)RCW given by the insurer is accident-specific and, per definition, independent from retirement or other disease-dependent incapacity to work in the meantime. As demonstrated in earlier work, patients may be considered comparable from a statistical point of view whether insured by the main accident insurer Suva or not, provided groups are adequately controlled for age and gender [43]. The statistical procedure to enter in the block and stepwise model variables that were not significant in the final model (trauma mechanism or first GCS score) was undertaken because of multicollinearity, which was mostly of all of injury variables with outcome variables and not due to multicollinearity within the blocks. We preferred this way of presenting regression models because the main objective was to evaluate to what extent such blocks of variables (e.g., sociodemographic, injury, treatment process and early outcome characteristics) would additionally explain longer-term outcome measured as RCW.
Since the survey was confined to insured injured persons only, we cannot comment on the positive or negative effects of financial compensation on health outcomes, a topic still under debate [29, 40, 44, 45]. This research did not include any data on patients’ subjective rating of quality of life or functional outcome [25, 46] nor on individual case experiences [40]. On the basis of our outcome measures we cannot make any valid statements on estimated long-term outcomes such as disease-adjusted life years (DALYs) [1] or on the management of disability [47], as has been discussed in the literature. Among other factors not investigated by us, for example older age or closeness to retirement might have an additional impact on RCW. Given the lack of literature on this topic, the current evaluation on purpose studied a heterogeneous cohort of traumatised patients, all presenting with a minimum injury severity of NISS ≥8, with the objective to investigate a large trauma centre cohort. As such, we intentionally restricted our research to RCW following trauma (in contrast to ability to work, for example, after sick leave [48]), but did not concentrate only on specific (and often rare) injuries such as burns [49] or spinal cord lesions [50], topics moreover already covered by distinct reviews or might be the focus of future studies.
In conclusion, this longitudinal single-centre evaluation of significantly injured patients confirmed the existence of important longer-term residual problems in a high proportion of patients, demonstrating 4 years after sustained trauma an (at least partly) RCW in every fifth case and total inability to work in every tenth case. The basic sociodemographic, injury, early treatment or patient condition characteristics under investigation provided two fifths of the information explaining resultant RCW. Suva, the participating accident insurer, calculated an average of CHF 420,000 total insurance costs per RCW case, almost 10 times more than for individuals without RCW. Among the baseline variables investigated, injury characteristics appeared to have the largest impact on longer-term outcome as measured by RCW or accident insurer costs. From an insurer’s perspective, one tenth of patients accounted for almost nine tenths of total insurance outlay needed for the total cohort. Given the significance of these findings, further studies are needed to better understand the main prognostic factors for longer-term incapacity to work with the aim of predicting as soon as possible after injury, and consequently minimising long-lasting RCW with its associated costs.
The appendix is available as a separate file for downloading at: https://smw.ch/article/doi/smw.2019.20144
The authors would like to thank all hospital collaborators, particularly Ms F. Maeder for the reliable management of data and Ms J. Buchanan for English language editing of the manuscript. This pilot study was possible thanks to the involvement of the Swiss accident insurer Suva, which provided patients’ insurance data.
The investigation was financially supported by the hospital and Suva data were provided by courtesy of the Suva, the largest Swiss accident insurer, within the framework of a contract agreed for this pilot project.
The authors declare there are no current or potential conflicts of interest.
1 Haagsma JA , Graetz N , Bolliger I , Naghavi M , Higashi H , Mullany EC , et al. The global burden of injury: incidence, mortality, disability-adjusted life years and time trends from the Global Burden of Disease study 2013. Inj Prev. 2016;22(1):3–18. doi:.https://doi.org/10.1136/injuryprev-2015-041616
2 Moore L , Champion H , Tardif P-A , Kuimi B-L , O’Reilly G , Leppaniemi A , et al.; International Injury Care Improvement Initiative. Impact of Trauma System Structure on Injury Outcomes: A Systematic Review and Meta-Analysis. World J Surg. 2018;42(5):1327–39. doi:.https://doi.org/10.1007/s00268-017-4292-0
3 Gross T , Morell S , Amsler F . Longer-term quality of life following major trauma: age only significantly affects outcome after the age of 80 years. Clin Interv Aging. 2018;13:773–85. doi:.https://doi.org/10.2147/CIA.S158344
4 Thompson L , Hill M , Davies C , Shaw G , Kiernan MD . Identifying pre-hospital factors associated with outcome for major trauma patients in a regional trauma network: an exploratory study. Scand J Trauma Resusc Emerg Med. 2017;25(1):83. doi:.https://doi.org/10.1186/s13049-017-0419-4
5 Nemunaitis G , Roach MJ , Claridge J , Mejia M . Early Predictors of Functional Outcome After Trauma. PM R. 2016;8(4):314–20. doi:.https://doi.org/10.1016/j.pmrj.2015.08.007
6 Hoffman K , Cole E , Playford ED , Grill E , Soberg HL , Brohi K . Health outcome after major trauma: what are we measuring? PLoS One. 2014;9(7):e103082. doi:.https://doi.org/10.1371/journal.pone.0103082
7 Gabbe BJ , Simpson PM , Harrison JE , Lyons RA , Ameratunga S , Ponsford J , et al. Return to work and functional outcomes after major trauma: Who recovers, when, and how well? Ann Surg. 2016;263(4):623–32. doi:.https://doi.org/10.1097/SLA.0000000000001564
8 Scaratti C , Leonardi M , Sattin D , Schiavolin S , Willems M , Raggi A . Work-related difficulties in patients with traumatic brain injury: a systematic review on predictors and associated factors. Disabil Rehabil. 2017;39(9):847–55. doi:.https://doi.org/10.3109/09638288.2016.1162854
9 Ardolino A , Sleat G , Willett K . Outcome measurements in major trauma--results of a consensus meeting. Injury. 2012;43(10):1662–6. doi:.https://doi.org/10.1016/j.injury.2012.05.008
10 Tøien K , Skogstad L , Ekeberg Ø , Myhren H , Schou Bredal I . Prevalence and predictors of return to work in hospitalised trauma patients during the first year after discharge: a prospective cohort study. Injury. 2012;43(9):1606–13. Published online April 15, 2011. doi:.https://doi.org/10.1016/j.injury.2011.03.038
11 Clay FJ , Newstead SV , McClure RJ . A systematic review of early prognostic factors for return to work following acute orthopaedic trauma. Injury. 2010;41(8):787–803. doi:.https://doi.org/10.1016/j.injury.2010.04.005
12 Clay FJ , Berecki-Gisolf J , Collie A . How well do we report on compensation systems in studies of return to work: a systematic review. J Occup Rehabil. 2014;24(1):111–24. Published online April 19, 2013. doi:.https://doi.org/10.1007/s10926-013-9435-z
13 Haeusler JM , Tobler B , Arnet B , Huesler J , Zimmermann H . Pilot study on the comprehensive economic costs of major trauma: Consequential costs are well in excess of medical costs. J Trauma. 2006;61(3):723–31.
14 Gross T , Amsler F . Langzeitoutcome nach Polytrauma im erwerbsfähigen Alter [Long-term outcome following multiple trauma in working age : A prospective study in a Swiss trauma center]. Unfallchirurg. 2016;119(11):921–8. Article in German. doi:.https://doi.org/10.1007/s00113-014-2720-2
15 Gross T , Morell S , Amsler F . To What Extent Are Main Accident-Insurer Cases Representative of All Significantly Injured? A Swiss Monocenter Perspective. J Insur Med. 2019;insm-48-1-1-14.1. Published online April 25, 2019. doi:.https://doi.org/10.17849/insm-48-1-1-14.1
16The Swiss authorities online. Accident insurance: Who is covered? [cited 2018 28. Jan]. Available from: https://www.ch.ch/en/accident-insurance-who-covered/.
17Federal Office of Public Health FOPH. Accident Insurance 2018 [cited 2018 28. Jan]. Available from: https://www.bag.admin.ch/bag/en/home/themen/versicherungen/unfallversicherung.html.
18Annual Report 2016 full version: Schweizer Unfallversicherungsanstalt (SUVA); 2016 [cited 2018 28. Jan]. Suva_Annual_Report_2016_1278-104-16.E.pdf. Available from: https://www.suva.ch/en/material/Documentations/annual-report-2016-full-version/#uxlibrary-from-search.
19 Teasdale G , Jennett B . Assessment and prognosis of coma after head injury. Acta Neurochir (Wien). 1976;34(1-4):45–55. doi:.https://doi.org/10.1007/BF01405862
20 Sartorius D , Le Manach Y , David JS , Rancurel E , Smail N , Thicoïpé M , et al. Mechanism, Glasgow coma scale, age, and arterial pressure (MGAP): a new simple prehospital triage score to predict mortality in trauma patients. Crit Care Med. 2010;38(3):831–7. doi:.https://doi.org/10.1097/CCM.0b013e3181cc4a67
21Gennarelli T. The Abbreviated Injury Scale - 1990 revision. Des Plaines, IL: American Association for the Advancement of Automotive Medicine (AAAM); 1990.
22 Jennett B , Bond M . Assessment of outcome after severe brain damage. Lancet. 1975; 305(7905):480–4. doi:.https://doi.org/10.1016/S0140-6736(75)92830-5
23 Lefering R . Ein neuer Prognose-Score im TraumaRegister DGU (RISC II). Orthopädie und Unfallchirurgie Mitteilungen und Nachrichten. 2015;04(01):80–1. doi:.https://doi.org/10.1055/s-0041-100418
24 Gross T , Braken P , Amsler F . Trauma center need: the American College of Surgeons’ definition in contrast to Swiss highly specialized medicine regulations-a Swiss trauma center perspective. Eur J Trauma Emerg Surg. 2018. doi:.https://doi.org/10.1007/s00068-018-1027-3
25 Attenberger C , Amsler F , Gross T . Clinical evaluation of the Trauma Outcome Profile (TOP) in the longer-term follow-up of polytrauma patients. Injury. 2012;43(9):1566–74. doi:.https://doi.org/10.1016/j.injury.2011.01.002
26 Brenneman FD , Redelmeier DA , Boulanger BR , McLellan BA , Culhane JP . Long-term outcomes in blunt trauma: who goes back to work? J Trauma. 1997;42(5):778–81. doi:.https://doi.org/10.1097/00005373-199705000-00004
27 Vles WJ , Steyerberg EW , Essink-Bot ML , van Beeck EF , Meeuwis JD , Leenen LPH . Prevalence and determinants of disabilities and return to work after major trauma. J Trauma. 2005;58(1):126–35. doi:.https://doi.org/10.1097/01.TA.0000112342.40296.1F
28 Soberg HL , Roise O , Bautz-Holter E , Finset A . Returning to work after severe multiple injuries: multidimensional functioning and the trajectory from injury to work at 5 years. J Trauma. 2011;71(2):425–34. doi:.https://doi.org/10.1097/TA.0b013e3181eff54f
29 Collie A , Simpson PM , Cameron PA , Ameratunga S , Ponsford J , Lyons RA , et al. Patterns and Predictors of Return to Work After Major Trauma: A Prospective, Population-based Registry Study. Ann Surg. 2019;269(5):972–8. doi:.https://doi.org/10.1097/SLA.0000000000002666
30 Overgaard M , Høyer CB , Christensen EF . Long-term survival and health-related quality of life 6 to 9 years after trauma. J Trauma. 2011;71(2):435–41. doi:.https://doi.org/10.1097/TA.0b013e31820e7ec3
31 Redmill DA , McIlwee A , McNicholl B , Templeton C . Long term outcomes 12 years after major trauma. Injury. 2006;37(3):243–6. doi:.https://doi.org/10.1016/j.injury.2005.11.014
32 Prada SI , Salkever D , Mackenzie EJ . Level-I trauma center effects on return-to-work outcomes. Eval Rev. 2012;36(2):133–64. doi:.https://doi.org/10.1177/0193841X12442674
33 Prada SI , Salkever D , MacKenzie EJ . Level-I trauma centre treatment effects on return to work in teaching hospitals. Injury. 2014;45(9):1465–9. doi:.https://doi.org/10.1016/j.injury.2014.02.025
34 Larsen P , Goethgen CB , Rasmussen S , Iyer AB , Elsoe R . One-year development of QOL following orthopaedic polytrauma: a prospective observational cohort study of 53 patients. Arch Orthop Trauma Surg. 2016;136(11):1539–46. doi:.https://doi.org/10.1007/s00402-016-2550-5
35 van Delft-Schreurs CCHM , van Bergen JJM , de Jongh MAC , van de Sande P , Verhofstad MHJ , de Vries J . Quality of life in severely injured patients depends on psychosocial factors rather than on severity or type of injury. Injury. 2014;45(1):320–6. doi:.https://doi.org/10.1016/j.injury.2013.02.025
36 von Rüden C , Woltmann A , Röse M , Wurm S , Rüger M , Hierholzer C , et al. Outcome after severe multiple trauma: a retrospective analysis. J Trauma Manag Outcomes. 2013;7(1):4. doi:.https://doi.org/10.1186/1752-2897-7-4
37 Kuhlman MB , Lohse N , Sørensen AM , Larsen CF , Christensen KB , Steinmetz J . Impact of the severity of trauma on early retirement. Injury. 2014;45(3):618–23. doi:.https://doi.org/10.1016/j.injury.2013.09.007
38 Knowlton LM , Harris AHS , Tennakoon L , Hawn MT , Spain DA , Staudenmayer KL . Interhospital variability in time to discharge to rehabilitation among insured trauma patients. J Trauma Acute Care Surg. 2019;86(3):406–14. doi:.https://doi.org/10.1097/TA.0000000000002163
39 Krause N , Dasinger LK , Neuhauser F . Modified Work and Return to Work: A Review of the Literature. J Occup Rehabil. 1998;8(2):113–39. doi:.https://doi.org/10.1023/A:1023015622987
40 MacEachen E , Kosny A , Ferrier S , Chambers L . The “toxic dose” of system problems: why some injured workers don’t return to work as expected. J Occup Rehabil. 2010;20(3):349–66. Published online February 09, 2010. doi:.https://doi.org/10.1007/s10926-010-9229-5
41 Corso P , Finkelstein E , Miller T , Fiebelkorn I , Zaloshnja E . Incidence and lifetime costs of injuries in the United States. Inj Prev. 2015;21(6):434–40. doi:.https://doi.org/10.1136/ip.2005.010983rep
42 Etuknwa A , Daniels K , Eib C . Sustainable Return to Work: A Systematic Review Focusing on Personal and Social Factors. J Occup Rehabil. 2019. doi:.https://doi.org/10.1007/s10926-019-09832-7
43 Gross T , Morell S , Amsler F . To what extent are main accident-insurer cases representative of all significantly injured? A Swiss monocenter perspective. J Insur Med. 2019;insm-48-1-1-14.1. doi:.https://doi.org/10.17849/insm-48-1-1-14.1
44 Murgatroyd DF , Casey PP , Cameron ID , Harris IA . The effect of financial compensation on health outcomes following musculoskeletal injury: systematic review. PLoS One. 2015;10(2):e0117597. doi:.https://doi.org/10.1371/journal.pone.0117597
45 Spearing NM , Connelly LB . Is compensation “bad for health”? A systematic meta-review. Injury. 2011;42(1):15–24. doi:.https://doi.org/10.1016/j.injury.2009.12.009
46 Gross T , Attenberger C , Huegli RW , Amsler F . Factors associated with reduced longer-term capacity to work in patients after polytrauma: a Swiss trauma center experience. J Am Coll Surg. 2010;211(1):81–91. doi:.https://doi.org/10.1016/j.jamcollsurg.2010.02.042
47 Keune JD . Disability and the contemporary surgical gestalt. Disabil Stud Q. 2018;38(1).
48 Hou WH , Chi CC , Lo HL , Chou YY , Kuo KN , Chuang HY . Vocational rehabilitation for enhancing return-to-work in workers with traumatic upper limb injuries. Cochrane Database Syst Rev. 2017;12:CD010002. doi:.https://doi.org/10.1002/14651858.CD010002.pub3
49 Mason ST , Esselman P , Fraser R , Schomer K , Truitt A , Johnson K . Return to work after burn injury: a systematic review. J Burn Care Res. 2012;33(1):101–9. Published online December 06, 2011. doi:.https://doi.org/10.1097/BCR.0b013e3182374439
50 Hilton G , Unsworth C , Murphy G . The experience of attempting to return to work following spinal cord injury: a systematic review of the qualitative literature. Disabil Rehabil. 2018;40(15):1745–53. doi:.https://doi.org/10.1080/09638288.2017.1312566
The investigation was financially supported by the hospital and Suva data were provided by courtesy of the Suva, the largest Swiss accident insurer, within the framework of a contract agreed for this pilot project.
The authors declare there are no current or potential conflicts of interest.