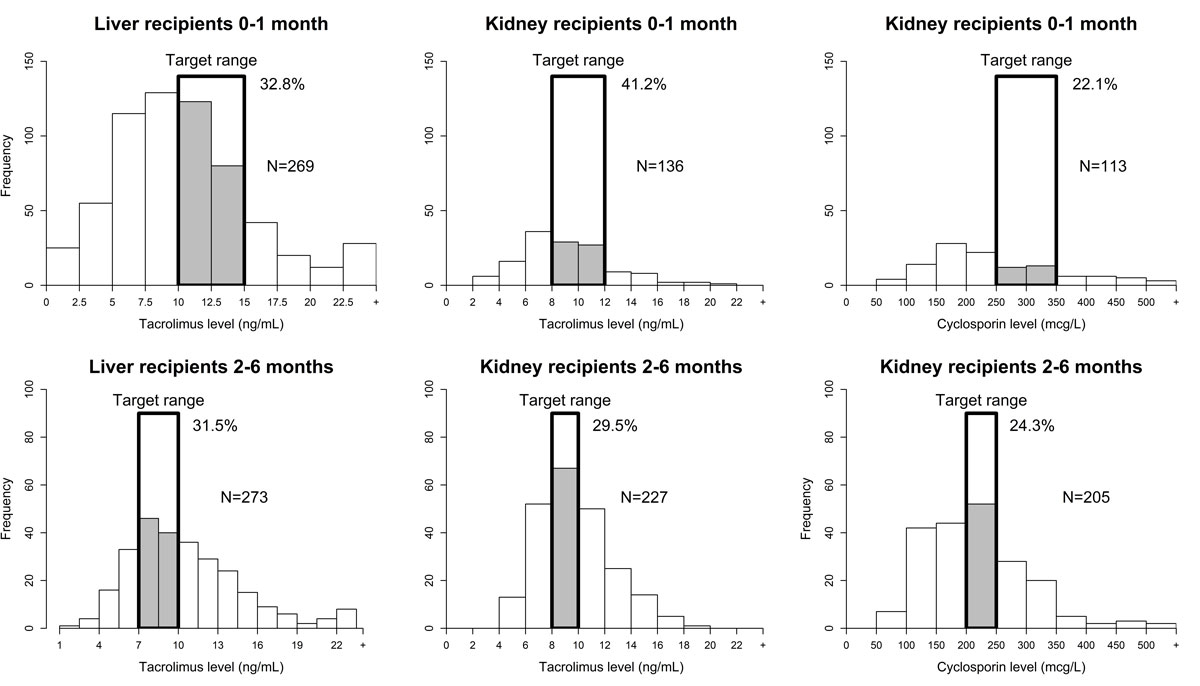
Figure 1 Number of sampled trough levels of each drug (tacrolimus and ciclosporin) during the first month and 2–6 months after liver (LT) and kidney (KT) transplantation and percentage of sampled levels in the target range.
DOI: https://doi.org/10.4414/smw.2019.20156
Optimal treatment with immunosuppressive therapy is critical to the success of solid organ transplantation. The current target management of paediatric liver (LT) and kidney transplantation (KT) is based on induction with antibody therapy, followed by a long-term administration of immunosuppressants. Drugs currently most commonly used in paediatric transplant recipients are, among others, steroids, calcineurin inhibitors (CNIs) such as tacrolimus and ciclosporin, and purine synthesis inhibitor, such as mycophenolate mofetil [1]. Understanding and preventing blood level variability of immunosuppressive drugs is essential to the success of LT and KT. Therapeutic drug monitoring (TDM) of immunosuppressants is necessary because of their narrow target ranges, variability in terms of pharmacokinetics and risks of drug interactions [2]. Underdosing may lead to graft rejection or even death, whereas overdosing can lead to major toxicity, including renal and neurotoxicity [3]. Another reason to reach an adequate CNI target is that it lowers the risk of increased post-transplant levels of preformed donor-specific antibodies or the appearance of de novo donor-specific antibodies [4–6].
Immunosuppressant TDM is routine for CNIs and is considered cost effective when weighed against organ availability and the costs of graft rejection [7]. Clinical interpretation of drug levels is not easy and requires accurate data, multidisciplinary work, and education [8, 9]. In a paediatric study of LT recipients, only 50% of tacrolimus trough levels were in the target range one year after transplantation. Implementation of statistical process controls and a checklist for the management of CNI blood levels was followed by an increase from 50 to 77% of drug levels in the target range [10].
There is no TDM service in our institutions for the clinical interpretation of immunosuppressant drug levels [11]. Guidelines or algorithms for the management of TDM – which could be beneficial for our patients – do not exist and physicians have to rely on their own experience.
The purpose of our study was to analyse TDM results in our liver and kidney recipients and factors associated with blood level stabilisation after LT and KT with the aim to identify modifiable factors to improve patient care.
This was a retrospective study in two Swiss university hospitals (university hospitals of Geneva [HUG] and Lausanne [CHUV]) of paediatric patients with liver or kidney transplantation during the study period. Patients who had undergone re-transplantation were also included. Patients who received combined or sequential LT followed by KT were excluded. No other solid organ transplant recipients were reviewed. The HUG is the single national centre for paediatric LT; therefore, all paediatric LT patients of Switzerland were included. The paediatric nephrology teams of CHUV and HUG are part of the same regional nephrology unit and have been using the same transplant protocols since 2007. The study was accepted by the local ethics committees of both institutions (n° 11-031R [MatPed 11-007R]). Waiver from individual informed consent was obtained from the institutions’ ethics committees.
Tacrolimus levels were measured by immunoassay analysis (HUG: EMIT 2000 [Enzyme Multiplied Immunoassay Technique], Siemens on Roche Cobas Mira immunoassay analyser; CHUV: CMIA Architect i1000SR, Abbott Diagnostics). Ciclosporin levels were measured in CHUV by immunoassay analysis (EMIT on Cobas Integra 400 Plus, Roche Diagnostics). The values measured were trough values, measured just before the next dose. The lower limit of detection for tacrolimus was 2.0 ng/ml, and for ciclosporin was 30 µg/l. Values below these limits were entered as 1 for tacrolimus and 15 for ciclosporin.
For LT, tacrolimus target trough levels were 10–15 ng/ml for the first month after LT, and 7–10 ng/ml thereafter until 6 months after LT. For KT, tacrolimus target trough levels were 8–12 ng/ml for the first month after KT, and 8–10 ng/ml thereafter until 6 months after KT. Ciclosporin target trough levels in KT were 250–350 µg/l during the first month after transplantation and 200–250 µg/l from 2 to 6 months after transplantation. The choice of tacrolimus or ciclosporin in KT patients was based on the age (ciclosporin for <5 years) and Epstein Barr virus (EBV) status (ciclosporin for EBV negative patients) of the child at the time of transplantation [12].
The main study outcome was the percentage of tacrolimus and ciclosporin within the target trough levels during the first month after transplantation. The secondary outcome was the evaluation of patient blood level stabilisation defined as: (1) three consecutive trough levels of tacrolimus or ciclosporin within the target range; (2) discharge from paediatric intensive care; and (3) discharge from hospital. These time-points were chosen because they are usually synonymous with a major improvement in the patient’s clinical condition. Potential factors associated with earlier stabilisation were evaluated for LT and KT: recipient gender, age and weight; living or deceased donor; primary liver (cholestatic, specifically biliary atresia, or metabolic disease) or kidney disease (congenital disease or acute glomerulonephritis [AGN] / haemolytic-uraemic syndrome [HUS]). In addition, for LT the following parameters were collected: age of donor, graft weight, and graft/recipient weight ratio. For KT only, type of drug (ciclosporin or tacrolimus) was evaluated.
Demographic data, such as recipient’s gender, age and weight, primary liver and kidney disease, donor age, graft weight were collected from patient records (HUG and CHUV since 2007) or from paper records (KT, CHUV data 2002–2007). Tacrolimus and ciclosporin trough levels were extracted from the laboratory record systems with the sample’s date and time. Data were merged for each patient using an anonymous patient identification number.
Demographic data were expressed as median, minimum and maximum values.
Distribution of tacrolimus and ciclosporin trough levels during the first month after transplantation was represented in a histogram. A logistic regression model with mixed effects was used for tacrolimus trough levels in LT to model the effect of time since transplant by piecewise constant odds ratios (ORs). The OR reflects the increase in the probability to be in the target range within the next 24 hours.
The cumulative stabilisation incidence, intensive care and hospital discharge, was assessed using Kaplan-Meier methods. The log-rank test was used to compare LT and KT, and to compare tacrolimus and ciclosporin treatment in KT patients. Results were expressed as median survival times in days and 95% confidence interval (CI).
Univariate analysis (log-rank test) was used to assess whether defined factors were associated with an earlier stabilisation in LT and KT. Recipient age and weight, donor age, graft weight and graft/recipient weight ratio were expressed as medians, which were used for statistical analysis.
Statistical significance was considered for a p value <0.05 (two-sided). Microsoft Excel® 97-2003 (Microsoft Office), S-plus 8.0 for Windows (CANdiensten, Netherlands) and STATA® v 11.0 (StataCorp, 4905 Lakeway Drive College Station, Texas 77845 USA) software were used for data handling and analysis.
Forty-six patients (27 LT, 19 KT) were included in this retrospective, descriptive study, with a median age of 1.0 year for LT (range 0.3–16.5) and 15.1 years for KT (range 1.8–19.4; p = 0.002, table 1). Twenty-four were females (52%). Primary liver diseases were cholestatic diseases (51.9%), which were mainly biliary atresia (44.4%), metabolic diseases (18.5%) and other diseases (29.6%). Primary kidney diseases were congenital diseases (52.6%), AGN and HUS (47.4%). Living donors were used in 22.2% of LT, and 57.9% of KT.
Table 1 Paediatric liver and kidney transplant patients: recipient and donor characteristics.
|
Liver tacrolimus
n = 27 |
Kidney tacrolimus
n = 10 |
Kidney ciclosporin
n = 9 |
|||
|---|---|---|---|---|---|
| Recipient | Gender | Female, n (%) | 15/27 (55.6) | 5/10 (50.0) | 4/9 (44.4) |
| Age (years) | Median (range) | 1 (0.3–16.5) | 16.7 (10.5–19.4) | 4.9 (1.8–16.3) | |
| Body weight (kg) | Median (range) | 8.4 (4.1–45.0) | 50.0 (31.0–66.0) | 16.0 (10.0–68.0) | |
| Missing data (n) | 0 | 1 | 0 | ||
| Drugs | Tacrolimus, n (%) | 27/27 (100) | 10/10 (100.0) | 0/9 (0.0) | |
| Ciclosporin, n (%) | 0/27 (0) | 0/10 (0.0) | 9/9 (100.0) | ||
| Diagnosis liver | Primary cholestatic disease, n (%) | 14/27 (51.9) | – | – | |
| Biliary atresia, n (%) | 12/27 (44.4) | – | – | ||
| Primary metabolic disease, n (%) | 5/27 (18.5) | – | – | ||
| Diagnosis kidney | Other congenital disease, n (%) | 8/27 (29.6) | 5/10 (50.0) | 5/9 (55.6) | |
| Non-congenital disease (AGN+HUS), n (%) | 5/10 (50.0) | 4/9 (44.4) | |||
| Donor | Deceased, n (%) | 21/27 (77.8) | 4/10 (40.0) | 4/9 (44.4) | |
| Living, n (%) | 6/27 (22.2) | 6/10 (50.0) | 5/9 (55.6) | ||
| Age (years) | Median (range) | 30 (2–49) | – | – | |
| Missing data (n) | 5 | – | – | ||
| Graft weight (g) | Median (range) | 291 (128–1940) | – | – | |
| Missing data (n) | 3 | – | – | ||
| Graft/recipient weight ratio (% body weight) | Median (range) | 0.032 (0.011–0.053) | – | – | |
| Missing data (n) | 3 | – | – | ||
| Number of measures, n (mean/patient) | 0–1 month | 629 (23.3) | 136 (13.6) | 113 (12.6) | |
| 2–6 months | 273 (10.1) | 227 (22.7) | 205 (22.8) | ||
| >6 months | 201 (7.4) | 374 (37.4) | 369 (41.0) | ||
| All times | 1103 (40.9) | 737 (73.7) | 687 (76.3) | ||
| Trough level, median (range) | 0–1 month | 9.9 (0.0–90.0) | 8.6 (2.0–21.8) | 221 (54–1152) | |
| 2–6 months | 9.8 (2.4–56.4) | 9.4 (4.0–19.0) | 208 (77–609) | ||
| >6 months | 7.2 (2.0–23.0) | 7.3 (2.0–20.0) | 152 (50–1332) | ||
| All times | 9.3 (0.0–90.0) | 8.2 (2.0–21.8) | 177 (50–1332) | ||
AGN = acute glomerulonephritis; HUS = haemolytic-uraemic syndrome
All LT patients were treated with tacrolimus, and KT patients received either tacrolimus (52.6%) or ciclosporin (47.4%). A total of 1102 tacrolimus trough levels were collected in LT patients, and 737 tacrolimus and 687 ciclosporin trough levels in KT patients (table 1).
During the first month after transplantation, on average 23.3 tacrolimus trough levels were measured in LT patients and 13.6 in KT (14.1 ciclosporin trough levels per patient). In LT, tacrolimus median trough level was 9.9 ng/ml (range 1–90.0) during the first month after transplantation. In KT, tacrolimus and ciclosporin median trough levels were 8.6 ng/ml (2.0–21.8) and 221 µg/l (54–1152), respectively.
During the first 2 to 6 months after LT, tacrolimus median trough level was 9.8 ng/ml (2.4–56.4). For KT recipients, tacrolimus and ciclosporin median trough levels were 9.4 ng/ml (4.0–19.0) and 208 µg/l (77–609), respectively.
Six months after transplantation, tacrolimus median trough level in LT was 7.2 ng/ml (2.0–23.0). Tacrolimus and ciclosporin median trough levels in KT were 7.3 ng/ml (2.0–20.0) and 152 µg/ml (50–1332), respectively.
During the first month after transplantation, only 32.8% of tacrolimus trough levels in LT and 41.2% in KT, and 22.1% of ciclosporin trough levels in KT were within the target range (fig. 1). Between 2 and 6 months after transplantation, 31.5% of tacrolimus trough levels in LT were in range whereas 29.5% of tacrolimus and 24.3% of ciclosporin levels in KT were in the target range. Modelling of tacrolimus trough levels in LT showed that during the first 10 days the OR for being in the target increased daily by 1.15 (95% CI 1.04–1.28). After 10 days, the OR was close to 1 (1.03, 95% CI 0.96–1.09), and the probability of being in the target no longer increased. (fig. 2)
Figure 1 Number of sampled trough levels of each drug (tacrolimus and ciclosporin) during the first month and 2–6 months after liver (LT) and kidney (KT) transplantation and percentage of sampled levels in the target range.
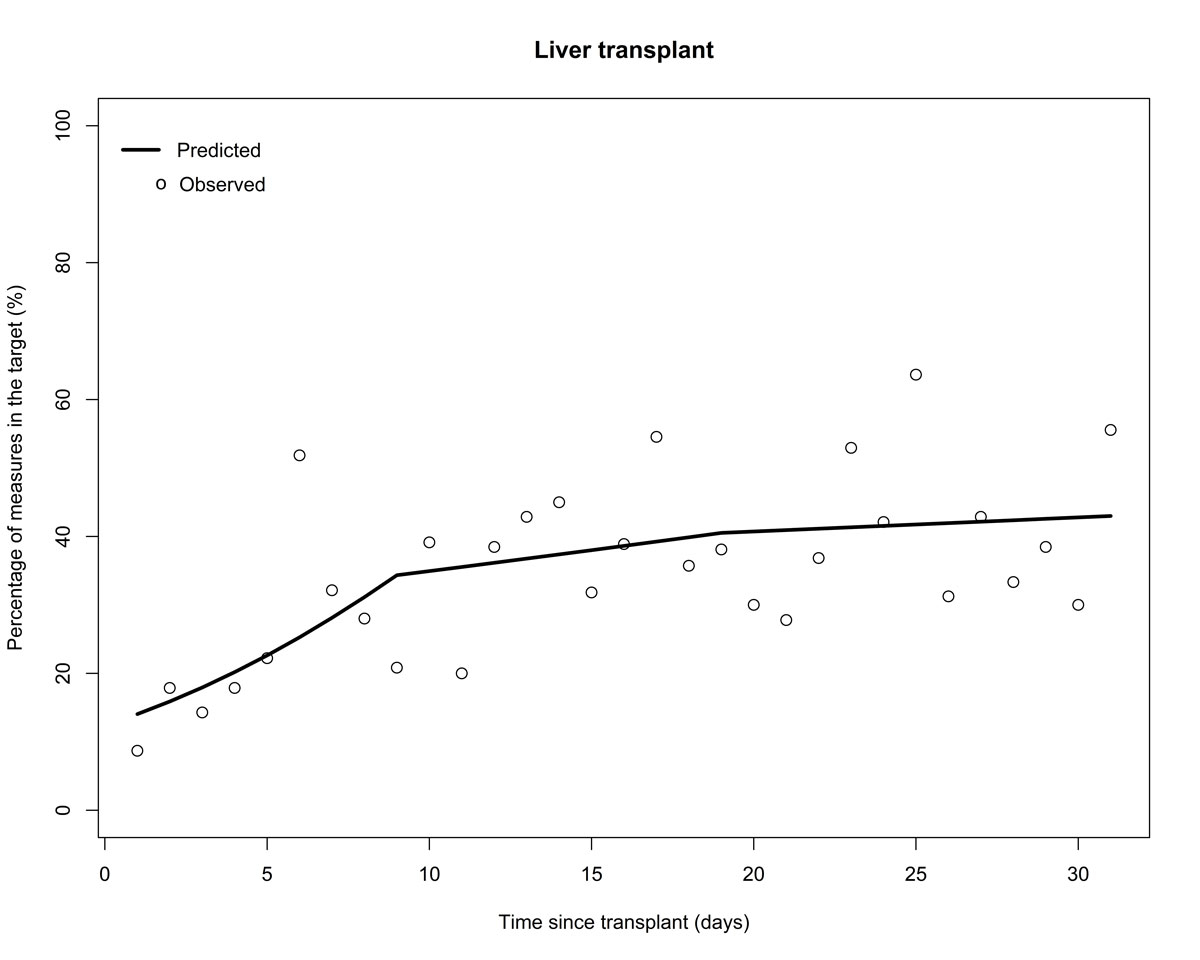
Figure 2 Probability of tacrolimus trough level being in the target range in the first month after liver transplantation.
There was no difference in the 30-day cumulative incidence of tacrolimus trough level stabilisation between LT and KT patients (p = 0.82). In KT, stabilisation of tacrolimus trough levels occurred earlier than for ciclosporin (p = 0.02). Intensive care and hospital discharge occurred earlier in KT patients compared to LT patients (p <0.001). (fig. 3)
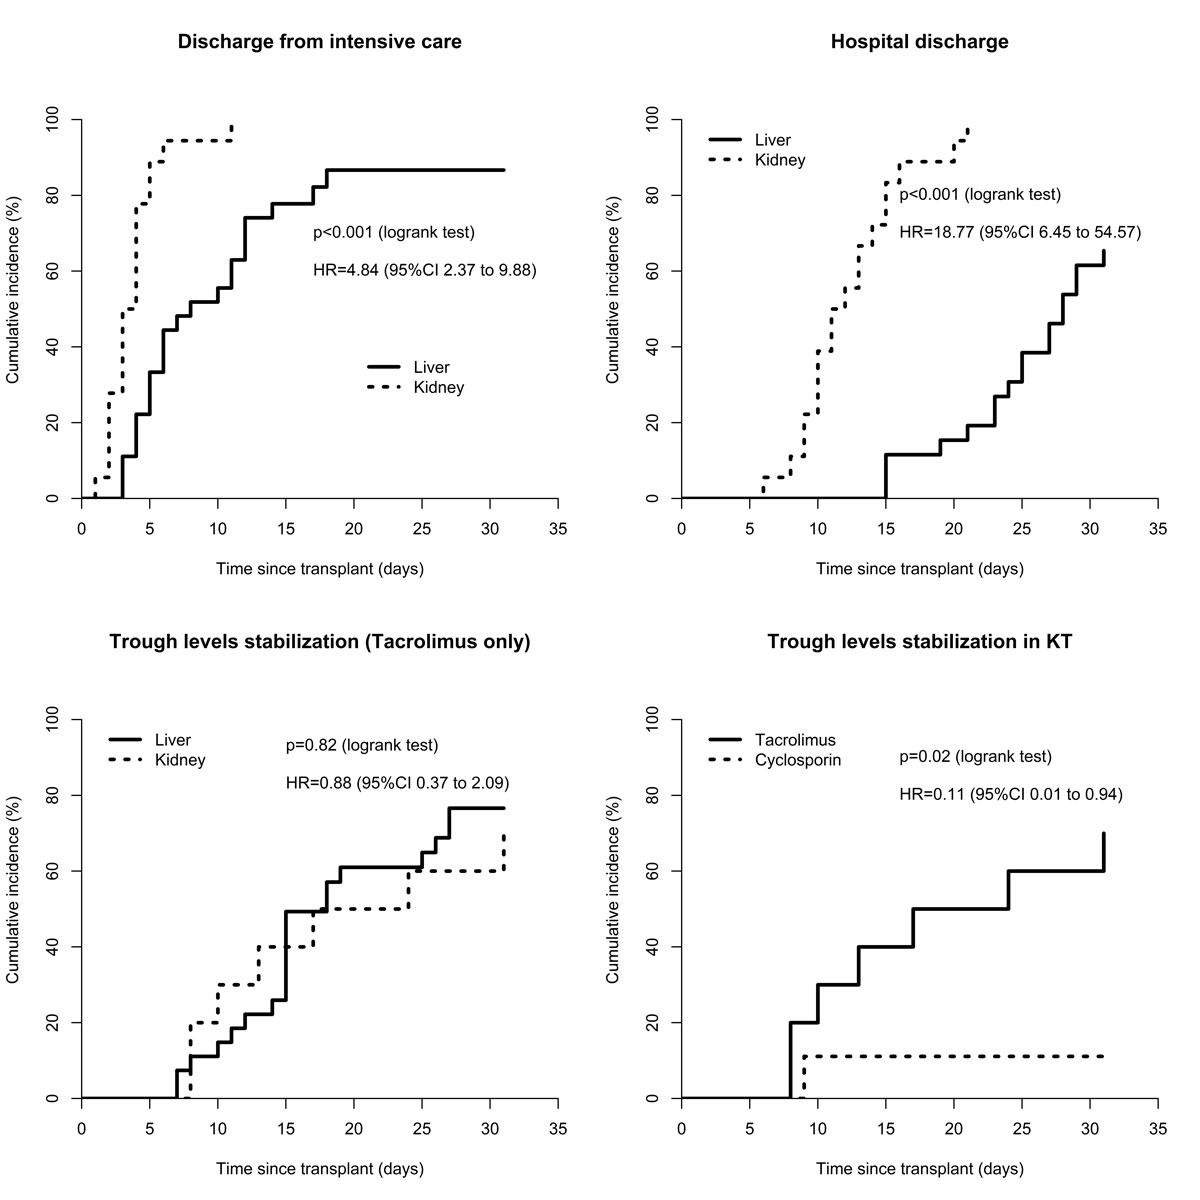
Figure 3 30-day stabilisation cumulative incidence in liver and kidney transplant recipients. CI = confidence interval; HR = hazard ratio; KT = kidney transplantation
In univariate analysis, living-donor LT was significantly associated with an earlier intensive care discharge (5.5 vs 11 days, p = 0.02, table 2). Graft weight >290 g was associated with a trend to earlier hospital discharge (25 days vs not reached at 30 days, p = 0.06), and primary metabolic disease and graft/recipient weight ratio ≥0.03 with earlier tacrolimus trough level stabilisation (14 vs 18 days, p = 0.01 and 15 vs 22 days, p = 0.05, respectively).
Table 2 Factors associated with trough level stabilisation at 30 days (univariate analysis).
| Stabilisation criteria | ||||||||
|---|---|---|---|---|---|---|---|---|
|
Three-consecutive
trough levels |
Intensive care
discharge |
Hospital
discharge |
||||||
| HR (95% CI) | p-value* | HR (95% CI) | p-value* | HR (95% CI) | p-value* | |||
| Liver transplantation | Donor | Deceased | 1 (ref.) | 1 (ref.) | 1 (ref.) | |||
| Living | 1.39 (0.53–3.67) | 0.50 | 3.23 (1.16–9.02) | 0.025 | 1.37 (0.48–3.92) | 0.56 | ||
| Gender | Female | 1 (ref.) | 1 (ref.) | 1 (ref.) | ||||
| Male | 1.05 (0.43–2.54) | 0.91 | 2.38 (0.99–5.74) | 0.054 | 1.83 (0.69–4.83) | 0.22 | ||
| Primary cholestatic disease | No | 1 (ref.) | 1 (ref.) | 1 (ref.) | ||||
| Yes | 1.06 (0.44–2.56) | 0.90 | 1.45 (0.63–3.33) | 0.38 | 1.11 (0.43–2.88) | 0.83 | ||
| Primary biliary atresia | No | 1 (ref.) | 1 (ref.) | 1 (ref.) | ||||
| Yes | 1.03 (0.43–2.50) | 0.94 | 1.35 (0.59–3.08) | 0.48 | 2.07 (0.80–5.40) | 0.14 | ||
| Primary metabolic disease | No | 1 (ref.) | 1 (ref.) | 1 (ref.) | ||||
| Yes | 4.70 (1.33–16.54) | 0.016 | 0.40 (0.12–1.36) | 0.14 | 0.78 (0.22–2.74) | 0.70 | ||
| Body weight† | <8.4 kg | 1 (ref.) | 1 (ref.) | 1 (ref.) | ||||
| ≥8.4 kg | 1.02 (0.42–2.46) | 0.97 | 1.44 (0.63–3.28) | 0.39 | 1.99 (0.75–5.27) | 0.16 | ||
| Recipient age† | <1.02 yr | 1 (ref.) | 1 (ref.) | 1 (ref.) | ||||
| ≥1.02 yr | 0.91 (0.38–2.20) | 0.84 | 1.53 (0.65–3.55) | 0.33 | 1.36 (0.52–3.52) | 0.53 | ||
| Donor age† | <30 yr | 1 (ref.) | 1 (ref.) | 1 (ref.) | ||||
| ≥30 yr | 0.72 (0.26–2.00) | 0.52 | 0.62 (0.24–1.65) | 0.34 | 0.34 (0.11–1.05) | 0.060 | ||
| Graft weight† | ≤290 g | 1 (ref.) | 1 (ref.) | 1 (ref.) | ||||
| >290 g | 1.54 (0.59–4.00) | 0.38 | 1.81 (0.74–4.44) | 0.20 | 2.67 (0.89–8.01) | 0.08 | ||
| Graft/recipient weight ratio (% body weight) | <0.03 | 1 (ref.) | 1 (ref.) | 1 (ref.) | ||||
| ≥0.03 | 2.53 (0.98–6.58) | 0.056 | 0.74 (0.31–1.74) | 0.49 | 0.87 (0.31–2.40) | 0.79 | ||
| Kidney transplantation | Donor | Deceased | 1 (ref.) | 1 (ref.) | 1 (ref.) | |||
| Living | 2.48 (0.50–12.34) | 0.27 | 1.67 (0.62–4.49) | 0.31 | 0.98 (0.37–2.62) | 0.97 | ||
| Gender | Female | 1 (ref.) | 1 (ref.) | 1 (ref.) | ||||
| Male | 0.79 (0.20–3.18) | 0.74 | 1.34 (0.51–3.52) | 0.55 | 1.39 (0.51–3.78) | 0.52 | ||
| Body weight† | <39.4 kg | 1 (ref.) | 1 (ref.) | 1 (ref.) | ||||
| ≥39.4 kg | no convergence | 1.59 (0.59–4.29) | 0.36 | 2.34 (0.83–6.62) | 0.11 | |||
| Recipient age† | <15.1 yr | 1 (ref.) | 1 (ref.) | 1 (ref.) | ||||
| ≥15.1 yr | no convergence | 2.39 (0.87–6.53) | 0.09 | 3.01 (1.10–8.29) | 0.033 | |||
| Drugs | Tacrolimus | 1 (ref.) | 1 (ref.) | 1 (ref.) | ||||
| Ciclosporin | 0.11 (0.01–0.94) | 0.043 | 0.53 (0.19–1.50) | 0.23 | 0.47 (0.17–1.31) | 0.15 | ||
| Diagnosis | Congenital | 1 (ref.) | 1 (ref.) | 1 (ref.) | ||||
| AGN+HUS | 1.87 (0.44–7.90) | 0.39 | 1.66 (0.63–4.37) | 0.31 | 1.15 (0.43–3.04) | 0.78 | ||
AGN = acute glomerulonephritis; CI = confidence interval; HR = hazard ratio; HUS = haemolytic-uraemic syndrome * Log-rank test; † cut-off is median value
In KT, recipient age >15.0 years and weight ≥39.4 kg were associated with earlier trough level stabilisation (both 13 days vs not reached at 30 days, p <0.001), which was reached earlier with tacrolimus than with ciclosporin (20.5 days vs not reached, p = 0.02). Recipient age >15.0 years was also associated with an earlier hospital discharge (10 vs 14 days, p = 0.02).
Reducing adverse events associated with the use of immunosuppressants is a major goal in solid organ transplantation [13, 14]. However, this has to be weighed against the risks of under-immunosuppression and consequent early or late acute or chronic rejection. TDM is one way to evaluate and adjust dosages of immunosuppressive agents [14, 15]. In our cohort of LT and KT recipients, only between 22 and 41% of patients had reached the target trough level for their immunosuppressive medication at the end of the first month after transplantation, and the results were even less satisfactory between the second and sixth months after transplantation, when as few as a quarter of patients were within the target range.
This is particularly worrisome because several authors have demonstrated a link between variability in trough levels and graft outcome [16–18]. It suggests that, despite close and repeated monitoring by well-trained transplant teams following inpatients and outpatients, other factors probably contribute to stabilising trough levels. The lack of a specialised clinical pharmacist [19] and of clear guidelines on how to manage treatments in regard to TDM in our institution may have led to these unsatisfactory results [20]. A recent review of algorithms for immunosuppressive drug dosing in adults and children [21] concluded that TDM is necessary, but it is unclear if the implementation of algorithms improves clinical outcome [22, 23]. In paediatrics, correct dosing is even more of an issue, especially in the very young, because large interindividual variability is reported [24]. Larger centres integrate scientists, clinicians, nurses and pharmacists to form a TDM team to review all drug concentrations and adapt them accurately [9].
Other strategies to monitor and optimise immunosuppressive agents have been proposed. Pharmacodynamics of CNIs, for example, could be used to personalise drug dosing and optimise the treatment [25, 26]. Others have looked at intracellular immunosuppressive drug monitoring [27], which shows promising results for CNIs, but not for mechanistic target of rapamycin (m-TOR) inhibitors (sirolimus, everolimus) and antimetabolite drugs (mycophenolic acid). Finally, genetic determinants seem to be increasingly used to optimise immunosuppressive drug dosing [28–30].
In our study, during the first month stabilisation of trough levels in KT patients was easier to achieve with tacrolimus than with ciclosporin, although the percentage of stabilisations was similar in both groups after 2 months. With tacrolimus, trough level stabilisation was similar in LT and in KT patients during the first month. This could be explained by the fact that both populations stay in the same intensive care unit and later on the same surgical ward.
Taken together, the data concur that greater liver mass is favourable for target trough level stabilisation. This is clearly a predominantly paediatric problem given that split grafts are frequently used whether from deceased or living donors, and that the donor/recipient weight ratio varies with each donor/recipient pair. In addition, issues with diet and absorption is probably a major confounder, something which is difficult to control for and model [31–33].
Unlike others, we also evaluated other markers for immunosuppressant trough stabilisation. In LT, metabolic diseases and higher graft/recipient weight ratio was linked with tacrolimus level stabilisation 4–7 days earlier. This could be explained by proportionately less variation in the distribution volume, and less acutely sick children. However, when we modelled tacrolimus trough levels during the first month after LT, we showed that the odds of being within the target range increased steadily during the first 10 days after LT, but not beyond. This could be explained by the facts that LT patients are more closely monitored during the first days after transplantation, and that adjustments have the biggest impact during the first days.
Older age and weight were associated with earlier trough level stabilisation in KT patients, possibly explained by the fact that tacrolimus, used mainly in older patients, was also associated with earlier trough levels stabilisation compared with ciclosporin [34].
Our study has several limitations. First, it only reports the troughs of a relatively small number of patients. However, we analysed more than 1800 trough levels in these carefully followed patients and could nevertheless produce a convincing model for predicting stabilisation. Second, this study does not report on results from other types of solid organ transplant. Nevertheless, our comparison between the two populations shows that all organs cannot be dealt with similarly. Third, this is not an interventional study, and we did not implement new algorithms to manage TDM in our transplant recipients. Convincing paediatric algorithms are, to our knowledge, still lacking but should probably include age-appropriate targets, pharmacodynamics, genetic considerations, and maybe new approaches regarding TDM dosing techniques and graft and recipient weight. A multidisciplinary approach including a clinical pharmacist with a focus on TDM, compliance enhancement and educational interventions is another strategy with beneficial impact in some studies. In addition, we agree that a categorisation of continuous variables leads to a loss of information. With regression models with proportional hazards for survival data (such as the Cox regression model), associations between continuous variables and survival outcome can be investigated without any categorisation. However, some assumptions are needed for such analyses: the relative increase in hazard ratio) per increment of 1 unit of the continuous variable is the same for any level of the variable. To check this assumption, the complementary log-log of survival are usually graphically represented for various categories of the continuous variable (at least three, preferably four or five categories). Because of the small sample size, we were unable to check in a reliable way if this assumption was verified by data. Therefore, we presented results of less informative analyses (Kaplan-Meier analyses with dichotomised continuous variables and the log-rank test), which require few assumptions, rather than results of more sophisticated analyses for which we cannot guarantee reliability. Finally, because of the retrospective design of our study, not all possible confounding factors may been examined. For example, the use of antifungals, such as fluconazole, or the type of ingested food may have an influence on levels [35, 36]. We cannot therefore exclude that these may have had an influence on patient outcomes and drug levels. Nevertheless, other frequently studied factors, such as donor type, gender, baseline diagnosis, age, graft weight, etc. were indeed included in our study.
In conclusion, in this era when survival after solid organ transplantation has increased dramatically, strategies to protect patients from immunosuppressant-associated adverse events and graft loss should include TDM. TDM is still a problem because of the lack of reliable markers, and difficulties in adjustments and in follow-up. Although nonadherence is often inferred from trough levels not within the target range [37, 38], stabilisation is difficult to reach even during the first month after transplantation when children may still be in the hospital and have supervised medication administration. In our study, immunosuppressant trough level variability was high in the first 6 months after transplantation, with less than a third of the patients in the target range. Factors associated with earlier stabilisation have to be confirmed in a larger study. Pharmacogenomics and personalised medicine might, in the future, be helpful to improve TDM monitoring [39]. Currently, multimodal strategies should be studied to increase the chance of finding the right dose for each patient, and to maintain appropriate drug levels.
The authors are grateful to all members of the Swiss Paediatric Liver Centre for patient care and for their assistance in answering clinical questions. We also thank all children and their parents for their collaboration in our studies.
The authors received no specific funding for this work. The costs of the study were covered by the research funds of the pharmacy of our institution.
No conflict of interest relevant to this article was reported.
1 Halloran PF . Immunosuppressive drugs for kidney transplantation. N Engl J Med. 2004;351(26):2715–29. doi:.https://doi.org/10.1056/NEJMra033540
2 del Mar Fernández De Gatta M , Santos-Buelga D , Domínguez-Gil A , García MJ . Immunosuppressive therapy for paediatric transplant patients: pharmacokinetic considerations. Clin Pharmacokinet. 2002;41(2):115–35. doi:.https://doi.org/10.2165/00003088-200241020-00004
3 Snanoudj R , Rabant M , Royal V , Pallet N , Noël LH , Legendre C . Néphrotoxicité des inhibiteurs de la calcineurine : présentation, problèmes diagnostiques et facteurs de risques [Nephrotoxicity of calcineurin inhibitors: presentation, diagnostic problems and risk factors). Nephrol Ther. 2009;5(Suppl 6):S365–70. doi:.https://doi.org/10.1016/S1769-7255(09)73427-3
4 Tait BD , Hudson F , Cantwell L , Brewin G , Holdsworth R , Bennett G , et al. Review article: Luminex technology for HLA antibody detection in organ transplantation. Nephrology (Carlton). 2009;14(2):247–54. doi:.https://doi.org/10.1111/j.1440-1797.2008.01074.x
5 OʼLeary JG , Samaniego M , Barrio MC , Potena L , Zeevi A , Djamali A , et al. The Influence of Immunosuppressive Agents on the Risk of De Novo Donor-Specific HLA Antibody Production in Solid Organ Transplant Recipients. Transplantation. 2016;100(1):39–53. doi:.https://doi.org/10.1097/TP.0000000000000869
6 Rodrigo E , Segundo DS , Fernández-Fresnedo G , López-Hoyos M , Benito A , Ruiz JC , et al. Within-Patient Variability in Tacrolimus Blood Levels Predicts Kidney Graft Loss and Donor-Specific Antibody Development. Transplantation. 2016;100(11):2479–85. doi:.https://doi.org/10.1097/TP.0000000000001040
7 Touw DJ , Neef C , Thomson AH , Vinks AA ; Cost-Effectiveness of Therapeutic Drug Monitoring Committee of the International Association for Therapeutic Drug Monitoring and Clinical Toxicology. Cost-effectiveness of therapeutic drug monitoring: a systematic review. Ther Drug Monit. 2005;27(1):10–7. doi:.https://doi.org/10.1097/00007691-200502000-00004
8 Bates DW , Soldin SJ , Rainey PM , Micelli JN . Strategies for physician education in therapeutic drug monitoring. Clin Chem. 1998;44(2):401–7.
9 Gross AS . Best practice in therapeutic drug monitoring. Br J Clin Pharmacol. 2001;52(Suppl 1):5S–10S. doi:.https://doi.org/10.1046/j.1365-2125.2001.00770.x
10 Bucuvalas JC , Ryckman FC , Arya G , Andrew B , Lesko A , Cole CR , et al. A novel approach to managing variation: outpatient therapeutic monitoring of calcineurin inhibitor blood levels in liver transplant recipients. J Pediatr. 2005;146(6):744–50. doi:.https://doi.org/10.1016/j.jpeds.2005.01.036
11 Gross AS . Best practice in therapeutic drug monitoring. Br J Clin Pharmacol. 1998;46(2):95–9. doi:.https://doi.org/10.1046/j.1365-2125.1998.00770.x
12 Dharnidharka VR , Sullivan EK , Stablein DM , Tejani AH , Harmon WE ; North American Pediatric Renal Transplant Cooperative Study (NAPRTCS). Risk factors for posttransplant lymphoproliferative disorder (PTLD) in pediatric kidney transplantation: a report of the North American Pediatric Renal Transplant Cooperative Study (NAPRTCS). Transplantation. 2001;71(8):1065–8. doi:.https://doi.org/10.1097/00007890-200104270-00010
13 Chapman JR . Progress in Transplantation: Will It Be Achieved in Big Steps or by Marginal Gains? Am J Kidney Dis. 2017;69(2):287–95. doi:.https://doi.org/10.1053/j.ajkd.2016.08.024
14 Mika A , Stepnowski P . Current methods of the analysis of immunosuppressive agents in clinical materials: A review. J Pharm Biomed Anal. 2016;127:207–31. doi:.https://doi.org/10.1016/j.jpba.2016.01.059
15 Filler G , Alvarez-Elías AC , McIntyre C , Medeiros M . The compelling case for therapeutic drug monitoring of mycophenolate mofetil therapy. Pediatr Nephrol. 2017;32(1):21–9. doi:.https://doi.org/10.1007/s00467-016-3352-2
16 Larkins N , Matsell DG . Tacrolimus therapeutic drug monitoring and pediatric renal transplant graft outcomes. Pediatr Transplant. 2014;18(8):803–9. doi:.https://doi.org/10.1111/petr.12369
17 O’Regan JA , Canney M , Connaughton DM , O’Kelly P , Williams Y , Collier G , et al. Tacrolimus trough-level variability predicts long-term allograft survival following kidney transplantation. J Nephrol. 2016;29(2):269–76. doi:.https://doi.org/10.1007/s40620-015-0230-0
18 Shuker N , Shuker L , van Rosmalen J , Roodnat JI , Borra LC , Weimar W , et al. A high intrapatient variability in tacrolimus exposure is associated with poor long-term outcome of kidney transplantation. Transpl Int. 2016;29(11):1158–67. doi:.https://doi.org/10.1111/tri.12798
19 Griffin SP , Nelson JE . Impact of a Clinical Solid Organ Transplant Pharmacist on Tacrolimus Nephrotoxicity, Therapeutic Drug Monitoring, and Institutional Revenue Generation in Adult Kidney Transplant Recipients. Prog Transplant. 2016;26(4):314–21. doi:.https://doi.org/10.1177/1526924816667950
20 Dasari BV , Hodson J , Nassir A , Widmer J , Isaac J , Mergentel H , et al. Variations in Practice to Therapeutic Monitoring of Tacrolimus following Primary Adult Liver Transplantation. Int J Organ Transplant Med. 2016;7(1):1–8.
21 Andrews LM , Riva N , de Winter BC , Hesselink DA , de Wildt SN , Cransberg K , et al. Dosing algorithms for initiation of immunosuppressive drugs in solid organ transplant recipients. Expert Opin Drug Metab Toxicol. 2015;11(6):921–36. doi:.https://doi.org/10.1517/17425255.2015.1033397
22 Srinivas NR . Therapeutic drug monitoring of cyclosporine and area under the curve prediction using a single time point strategy: appraisal using peak concentration data. Biopharm Drug Dispos. 2015;36(9):575–86. doi:.https://doi.org/10.1002/bdd.1967
23 Bessa AB , Felipe CR , Hannun P , Sayuri P , Felix MJ , Ruppel P , et al. A prospective randomized trial investigating the influence of pharmaceutical care on the intra-individual variability of tacrolimus concentrations early after kidney transplant. Ther Drug Monit. 2016;38(4):447–55. doi:.https://doi.org/10.1097/FTD.0000000000000299
24 Martial LC , Verstegen RH , Cornelissen EA , Aarnoutse RE , Schreuder MF , Brüggemann RJ . A preliminary study searching for the right dose of tacrolimus in very young (≤4 years) renal transplant patients. J Pharm Pharmacol. 2016;68(11):1366–72. doi:.https://doi.org/10.1111/jphp.12639
25 Albring A , Wendt L , Harz N , Engler H , Wilde B , Kribben A , et al. Relationship between pharmacokinetics and pharmacodynamics of calcineurin inhibitors in renal transplant patients. Clin Transplant. 2015;29(4):294–300. doi:.https://doi.org/10.1111/ctr.12504
26 Sapir-Pichhadze R , Wang Y , Famure O , Li Y , Kim SJ . Time-dependent variability in tacrolimus trough blood levels is a risk factor for late kidney transplant failure. Kidney Int. 2014;85(6):1404–11. doi:.. Correction in: Kidney Int. 2014;89:248. doi:.https://doi.org/10.1038/ki.2013.465
27 Capron A , Haufroid V , Wallemacq P . Intra-cellular immunosuppressive drugs monitoring: A step forward towards better therapeutic efficacy after organ transplantation? Pharmacol Res. 2016;111:610–8. doi:.https://doi.org/10.1016/j.phrs.2016.07.027
28 Bruckmueller H , Werk AN , Renders L , Feldkamp T , Tepel M , Borst C , et al. Which Genetic Determinants Should be Considered for Tacrolimus Dose Optimization in Kidney Transplantation? A Combined Analysis of Genes Affecting the CYP3A Locus. Ther Drug Monit. 2015;37(3):288–95. doi:.https://doi.org/10.1097/FTD.0000000000000142
29 Monostory K , Tóth K , Kiss Á , Háfra E , Csikány N , Paulik J , et al. Personalizing initial calcineurin inhibitor dosing by adjusting to donor CYP3A-status in liver transplant patients. Br J Clin Pharmacol. 2015;80(6):1429–37. doi:.https://doi.org/10.1111/bcp.12747
30 Chen P , Li J , Li J , Deng R , Fu Q , Chen J , et al. Dynamic effects of CYP3A5 polymorphism on dose requirement and trough concentration of tacrolimus in renal transplant recipients. J Clin Pharm Ther. 2017;42(1):93–7. doi:.https://doi.org/10.1111/jcpt.12480
31 Liu F , Li Y , Lan X , Wei YG , Li B , Yan LN , et al. Tacrolimus dosage requirements in living donor liver transplant recipients with small-for-size grafts. World J Gastroenterol. 2009;15(31):3931–6. doi:.https://doi.org/10.3748/wjg.15.3931
32 Morine Y , Shimada M , Torii M , Imura S , Ikegami T , Kanemura H , et al. Optimal administration of tacrolimus in reduced-size liver. Dig Dis Sci. 2009;54(8):1789–93. doi:.https://doi.org/10.1007/s10620-008-0551-0
33 Wilberg J , Küpper B , Thrum K , Bärthel E , Koch A , Settmacher U , et al. Oral tacrolimus bioavailability is increased after right split liver transplantation. Transplant Proc. 2007;39(10):3237–8. doi:.https://doi.org/10.1016/j.transproceed.2007.03.102
34 Lancia P , Jacqz-Aigrain E , Zhao W . Choosing the right dose of tacrolimus. Arch Dis Child. 2015;100(4):406–13. doi:.https://doi.org/10.1136/archdischild-2013-305888
35 Bekersky I , Dressler D , Mekki QA . Effect of low- and high-fat meals on tacrolimus absorption following 5 mg single oral doses to healthy human subjects. J Clin Pharmacol. 2001;41(2):176–82. doi:.https://doi.org/10.1177/00912700122009999
36 Kimikawa M , Kamoya K , Toma H , Teraoka S . Effective oral administration of tacrolimus in renal transplant recipients. Clin Transplant. 2001;15(5):324–9. doi:.https://doi.org/10.1034/j.1399-0012.2001.150504.x
37 Pai AL , Rausch J , Tackett A , Marsolo K , Drotar D , Goebel J . System for integrated adherence monitoring: real-time non-adherence risk assessment in pediatric kidney transplantation. Pediatr Transplant. 2012;16(4):329–34. doi:.https://doi.org/10.1111/j.1399-3046.2012.01657.x
38 Akchurin OM , Melamed ML , Hashim BL , Kaskel FJ , Del Rio M . Medication adherence in the transition of adolescent kidney transplant recipients to the adult care. Pediatr Transplant. 2014;18(5):538–48. doi:.https://doi.org/10.1111/petr.12289
39 Millner L , Rodriguez C , Jortani SA . A clinical approach to solving discrepancies in therapeutic drug monitoring results for patients on sirolimus or tacrolimus: Towards personalized medicine, immunosuppression and pharmacogenomics. Clin Chim Acta. 2015;450:15–8. doi:.https://doi.org/10.1016/j.cca.2015.07.022
A part of this work has been presented as a poster at the 17th Congress of the European Association of Hospital Pharmacy in Milano, Italy (21–23 March 2012).
The authors received no specific funding for this work. The costs of the study were covered by the research funds of the pharmacy of our institution.
No conflict of interest relevant to this article was reported.