Describing adverse events in medical inpatients using the Global Trigger Tool
DOI: https://doi.org/10.4414/smw.2019.20149
Nicole
Grossmanna, Franziska
Gratwohlb, Sarah N.
Musycd, Natascha M.
Nielend, Jacques
Donzéaefg, Michael
Simoncd
aDepartment of General Internal Medicine, Inselspital, Bern University Hospital, Switzerland
bDepartment of General Medicine and Palliative Care, Lindenhofgruppe, Bern, Switzerland
cInstitute of Nursing Science, Department of Public Health, Medical Faculty, University of Basel, Switzerland
dNursing and Midwifery Research Unit, Inselspital, Bern University Hospital, Bern, Switzerland
eDepartment of General Medicine and Primary Care, Brigham and Women’s Hospital, Boston, Massachusetts, USA
fHarvard Medical School, Boston, Massachusetts, USA
gDepartment of General Internal Medicine, Hôpital Neuchâtelois, Neuchâtel, Switzerland
Summary
AIMS
The purpose of the study was to describe the type, prevalence, severity and preventability of adverse events (AEs) that affected hospitalised medical patients. We used the previously developed and validated Global Trigger Tool from the Institute for Healthcare Improvement.
METHODS
Using an adapted version of the Global Trigger Tool, we conducted a retrospective chart review of adult patients hospitalised in five medical wards at a university hospital in Switzerland. We reviewed a random sample of 20 patients’ charts for a total study period of 12 months (September 2016 to August 2017). Two trained nurses searched independently for triggers and possible AEs. All AEs were further validated by a senior physician. The number of triggers and AEs detected, as well as the severity and preventability of each, was assessed and analysed using descriptive statistics.
RESULTS
From a sample of 240 patient charts, we identified 1371 triggers and 336 AEs in 144 (60%) inpatients. This translates to an AE rate of 95.7 AEs per 1000 patient days. Most AEs (86.1%) caused temporary harm to the patient and required an intervention and/or prolonged hospitalisation. The estimated preventability of the in-hospital AEs was 29%. Healthcare-associated infections (25.8%) and neurological reactions (22.9%) were the most frequent AE types.
CONCLUSION
We found that about two thirds of patients suffered from AEs with harm during hospitalisation. It is common knowledge that AEs occur in hospitals and that they have potentially harmful consequences for patients, as well as a strong economic impact. However, to adequately prioritise patient safety interventions, it is essential to explore the nature, prevalence, severity and preventability of AEs. This is not only beneficial for the patients, but also cost effective in terms of shorter hospital stays.
Abbreviations:
- AE(s)
-
adverse event(s)
- CI
-
confidence interval
- GTT
-
Global Trigger Tool
- EHR
-
electronic health record
- IHI
-
Institute of Healthcare Improvement
- INR
-
international normalised ratio
- IQR
-
interquartile range
- MASD
-
moisture-associated skin damage
- NCC MERP
-
National Coordinating Council for Medication Error Reporting and Prevention Index
- PPV
-
positive predictive value
- PSI
-
patient safety indicators
- SD
-
standard deviation
Introduction
In-hospital adverse events (AEs) are a global health issue [1]. Many medical ward patients are elderly persons with multiple long-term conditions, making them particularly vulnerable to AEs [2]. Therefore, especially for older patients, monitoring AEs and their consequences is a crucial step towards implementing interventions to improve patient safety in clinical practice [3].
An AE is defined as an unintended physical injury caused by medical care – rather than by the patient's underlying disease – that requires additional monitoring, treatment or hospitalisation [4]. By definition, then, AEs are associated with harm. Medical errors and other mistakes in the process of care have the potential to be harmful; however, as most errors cause no injury to the patient, they are not classed as AEs [5]. Where injuries do occur, consequences may include prolonged hospital stay, disability, increased pain or even death [2, 6].
AEs are common with a wide range of reported incidence. A systematic review showed that between 3.2% and 16.6% of all hospitalised patients were affected by at least one AE [6]. In a more recent US study, 21% of medical inpatients suffered from at least one AE [7]. From an economic perspective, the most obvious impacts of AEs include extra hospitalisation days and additional treatment [2, 6]. A Danish study found a higher mean cost of EUR 9505 per patient exposed to an AE and hospital stay [8]. The most frequently named AE types were adverse drug events, hospital-acquired infections, operative/procedural injuries, poor glycaemic control, venous thromboembolism and pressure ulcers [7].
Depending on the standard of care available, several types of AE are considered preventable [9]. A 2016 multi-country systematic review of nine general hospital studies indicated that incidences of these AE types range from 14 to 71% [10]. In a Swiss hospital, one study reported an overall AE incidence of 14.1%, 42% of which were judged preventable [11]. It is estimated that AEs of all kinds lead to 700–1700 deaths per year in Swiss hospitals [12].
Several approaches to AE measurement exist: (1) clinical surveillance of specific types of AEs (e.g., patient falls, surgical site infections) [13]; (2) (voluntary) incident reporting, which involves front-line personnel identifying and reporting risks and near misses (errors detected before they reach the patient) [5]; and (3) administrative data, such as patient safety indicators (PSIs) [14], which provide information on potential in-hospital complications and AEs.
Unfortunately, all of these approaches miss substantial numbers of AEs. Where statistics depend on voluntary reporting by care providers, several studies have noted that both serious AEs [15] and PSIs [16, 17] are widely underreported. As a result, the most common method of assessing AEs [18] is retrospective chart review: the review of patient charts by trained medical reviewers to identify evidence of patient care-related injuries.
One promising chart review method is the Global Trigger Tool (GTT). Developed by the Institute for Healthcare Improvement (IHI) in the US in 2003 [4], the GTT consists of a systematic two-stage review of closed patient charts, offering an efficient and reliable method of measuring AEs over time. In a US adult care setting, the GTT showed a sensitivity of 95%, with 100% specificity [17]. The GTT has been used extensively across numerous countries and settings, commonly in a form modified to match the specific setting’s needs and patient characteristics (e.g., the review process may be changed, modules omitted and triggers adapted) [3, 10].
Improving patient safety in hospitals demands effective and reliable monitoring of AEs. To our knowledge, though, only one study has measured in-hospital AEs via chart review methodology in a community hospital in Switzerland [11]. As GTT methodology had not yet been used in Swiss hospitals, we applied it to explore AEs in the Department of General Internal Medicine at a university hospital. The purpose of this study was to determine the types, prevalence, severity and preventability of AEs occurring in hospitalised medical patients, using the GTT as a screening tool.
Materials and methods
Design and setting
This descriptive, retrospective chart review study was conducted in the Department of General Internal Medicine at a university hospital in Switzerland. In 2016, this department consisted of five medical wards with roughly 4600 patient discharges annually and an average length of stay of 7.8 days [19]. Admissions occurred mainly through the hospital's emergency unit; the recipients of its services were predominantly older persons with multiple conditions [20].
Sample
Medical inpatients were eligible if they met all the four following criteria: (1) aged 18 or older; (2) a minimum length of stay of 24 hours; (3) had a discharge summary; and (4) all coding completed within 30 days of hospital discharge. The records of readmissions were excluded and not reviewed if they were not the index admission.
Between September 2016 and August 2017 (12 months), once per month, using the R software package, a scientific assistant randomly selected 30 electronic patient charts from those of all patients hospitalised in the internal medicine wards of the study hospital. The selected patients’ eligibility was then checked by one reviewer. Of the 30 charts initially extracted, the first 20 that were eligible were used for chart review each month. A total sample size of 240 randomly selected patient charts was targeted. In this study, no formal power analysis was performed; however, based on the AE rate of 12.3% found in a Swedish study [21], a 95% confidence interval (CI) of 0.084–0.170 was expected with a sample size of n = 240.
Variables and measurements
All patient information originated from administrative data or from the electronic health record (EHR) of the study hospital.
Trigger selection and tool development.
The study focused on medical wards, but included the entire period of hospitalisation, even if patients were treated in multiple departments during the index hospitalisation. AEs were assessed using two of the GTT’s six modules: “care” and “medication”, as well as two triggers from the surgical module. Of remaining three modules of the original GTT, two (“emergency department” and “intensive care”) were excluded because of EHR system differences; the third (“perinatal”) was omitted because it was irrelevant to our study population.
Each module of the GTT focuses on specific triggers [4]. These were adapted to our local setting and translated into German by the research team. As a guide, the members used the German translation provided by the IHI [22]. We adopted some of the guidance of the GTT handbook [4] as necessary, for example, in the case of drug brand names (e.g., Anexate®), the types of drugs used (e.g., antihistamine), laboratory thresholds (e.g., the international normalised ratio [INR] >4). Furthermore, because of the elderly and comorbid population of our study, we treated each readmission within 30 days as an AE. In cases where the reason for readmission might have been caused by the underlying disease, we rated the preventability as low. In addition, three triggers developed by the research team and expert nurses from medical wards (delay in discharge, sudden change in cognitive function, and phlebitis / extravasation injury) were included. In total, this study used 32 triggers (see appendix 1 for a full list).
Harm from adverse events
Each AE was categorised according to whether it originated prior to admission (e.g., pneumonia diagnosed within 72 hours of admission was considered to be present on admission) or during hospitalisation. The National Coordinating Council for Medication Error Reporting and Prevention Index (NCC MERP) harm classification A–I was used to assess event severity [23]. In accordance with the GTT handbook [4], only categories E–I were considered AEs as only this group caused harm to the patients (category E = temporary harm to the patient and required intervention; F = temporary harm to the patient requiring initial or prolonged hospitalisation; G = permanent patient harm; H = intervention required to sustain life; I = patient’s death) [23].
Preventability of adverse events
Reviewers with clinical knowledge and experience assessed the preventability of the identified in-hospital AEs using a four-point Likert-type scale: range 1–4 (1 = not preventable, 2 = probably not preventable, 3 = probably preventable, 4 = preventable). Any AEs receiving scores of 3 or 4 were considered preventable. An event was considered preventable if it was avoidable in the light of the standard care available at the time [9].
Data collection and screening procedure
Data were collected from December 2016 to October 2017 using the EHR of the study hospital. The review team consisted of three healthcare professionals: (1) two primary reviewers who were nurses with bachelors’ degrees, more than 5 years of experience each in internal medicine and knowledge of the EHR; and (2) one trained physician with more than 10 years’ experience in internal medicine. The review team remained unchanged for the total data collection period.
The review team completed a training session to enhance their consistency and ensure a thorough understanding of the GTT methodology. The training consisted of: (1) reading the IHI handbook [4]; (2) individual training using the five charts provided on the IHI’s website; and (3) practice by the primary reviewers on 15 patient charts, five of which were discussed with the physician. After this training, the EHR data review worksheets were created and adapted.
The screening process consisted of one primary and one secondary review (fig. 1).
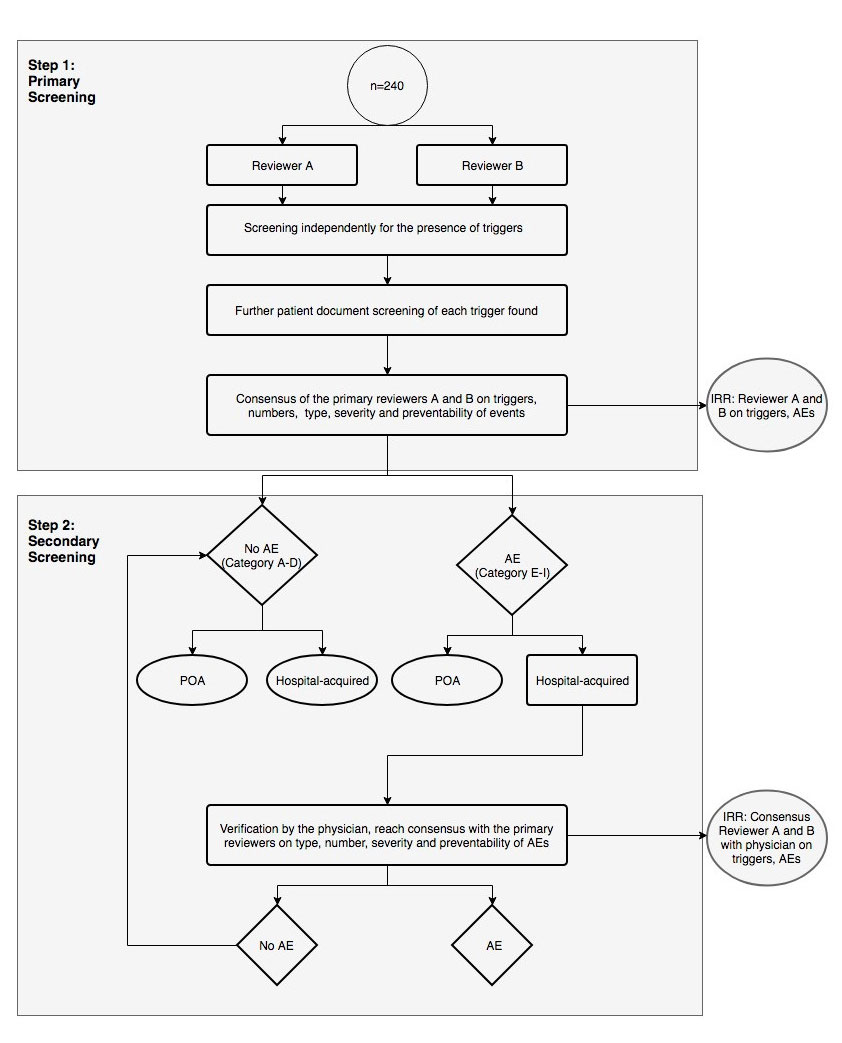
Figure 1 Screening procedure for the identification of adverse events. Two nurses review each electronic health record independently within a maximum time limit of 20 minutes. They compare and discuss their findings and reach consensus. The physician afterwards verifies the findings of the in-hospital AEs (harm E–I).
AE = adverse event; IRR = interrater reliability; POA = present on admission
The National Coordinating Council for Medication Error Reporting and Prevention Index (NCC MERP) categories: A–D = no harm to patients, E–I = harm to patients
Primary review
The two nurses reviewed each EHR independently for a maximum of 20 minutes. They reviewed the chart sections in the following order: discharge summary, laboratory results, medication administration record, vital signs, nursing care plan, nursing notes, doctor notes, operative record and organisational notes for discharge. If a trigger was identified, the reviewer determined whether an AE had occurred by further checking relevant parts of the record. The primary reviewers assessed the frequency, type, severity and preventability of each AE. After completing their separate reviews, the two primary reviewers discussed their findings and reached consensus regarding the suspected AEs, which they then recorded on a consensus worksheet. Data entry was cross-checked for quality assurance in 4% (n = 10) of patient charts.
Secondary review
The physician reviewed the consensus worksheet to reach a final decision on the frequency, type, severity and preventability of the possible in-hospital AEs. If there was any disagreement between the reviewers, this was discussed until consensus was reached. In addition, the physician provided answers to any questions from the primary reviewers that had arisen during the screening process.
Statistical analyses
All statistical analyses were performed using the R statistical software package, version 3.4.4 on Windows [24]. Descriptive analysis of the patients focussed on seven variables: gender, age, main diagnosis, length of hospital stay, surgery during hospitalisation, readmission within 30 days after chart review and whether the patient was deceased. We calculated frequencies and percentages with 95% CIs both for the type, level of harm and preventability of the AEs and for the triggers. We also calculated the prevalence and incidence of AEs per 1000 patient days.
For each trigger noted in the EHR, a positive predictive value (PPV), indicating the probability that it identified an AE, was calculated. Each trigger that directly indicated an AE was counted, with allowances for cases where several triggers were associated with a single AE and where one trigger indicated several AEs. The PPV was calculated as the number of AEs associated with each trigger divided by the number of triggers identified in all studied charts. To determine the quality of the screening process, we assessed interrater reliability both between the two primary reviewers and between the reviewers and the physician via Cohen’s kappa (κ) coefficient. The agreement between reviewers was defined as follows: (1) agreement on the presence or absence of AEs by calculating the Cohen kappa; and (2) agreement on the number of AEs by calculating the weighted Cohen kappa, where high disagreement corresponds to high weights [25]. A kappa coefficient <0.2 is considered poor, 0.21–0.60 fair to moderate, >0.60 acceptable, and ≥0.75 very good [26].
Ethical considerations
The regional Ethics Committee of Bern (KEK-2016-01720) approved this study based on the general consent of patients in the participating hospital.
Results
Two-stage reviews were performed on 240 patient charts (male: 126; mean age 69.8 years, standard deviation [SD] 16.4; range 19–104 years). The most frequent diagnoses were circulatory diseases (17.1%) and neoplasms (15.0%). Ten patients (4.2%) died during the index hospitalisation. The mean length of stay in hospital was 14.6 days (SD 11.6). Patients undergoing surgery (21.2%) during their admission had longer stays, with a mean of 25.3 days (SD 14.7). For further details, see table 1.
Table 1 Characteristics of the patients included in the GTT screening process.
|
Variables
|
n = 240
|
| Age, mean (SD) in years |
69.8 (16.4) |
| Men, n (%) |
126 (52.5) |
| Main diagnosis*, n (%) |
Diseases of the circulatory system (IX) |
41 (17.1) |
| Neoplasms (II) |
36 (15.0) |
| Injury, poisoning and certain other consequences of external causes (XIX) |
25 (10.4) |
| Infectious, parasitic diseases (I) |
25 (10.4) |
| Diseases of the nervous system (VI) |
18 (7.5) |
| Diseases of the respiratory system (X) |
18 (7.5) |
| Length of hospital stay, mean (SD) in days |
14.6 (11.6) |
| Surgery†, n (%) |
51 (21.2) |
| Deceased, n (%) |
10 (4.2) |
| Readmission after chart review (within 30 days), n (%) |
36 (15.0) |
Triggers
The chart reviews identified 1701 triggers. Of these, 330 (19.4%) were present on admission, with the remaining 1371 (80.6%) occurring during hospitalisation. The median numbers of triggers per patient was five (IQR 3–8). The most prevalent triggers during hospitalisation were “anti-emetic administration”, “other” and “any procedure complication” (table 2).
Table 2 Prevalence of triggers during hospitalisation.
|
Module
|
Trigger (n = 32)
|
n
|
Prevalence
% (95% CI)
n = 240
|
PPV (%)*
|
| Care |
Transfusion / use of blood products |
45 |
18.8 (14.0–24.3) |
53.5 |
| CPR team / MET activation or severe health deterioration |
36 |
15.0 (10.7–20.2) |
77.8 |
| Acute dialysis |
1 |
0.4 (0.0–2.3) |
0.0 |
| Positive cultures |
44 |
18.3 (13.6–23.8) |
68.2 |
| X-Ray for emboli or DVT |
5 |
2.1 (0.7–4.8) |
40.0 |
| Decrease in haemoglobin of ≥25% |
21 |
8.8 (5.5–13.1) |
52.4 |
| Patient fall |
22 |
9.2 (5.8–13.5) |
27.3 |
| Pressure ulcers |
47 |
19.6 (14.8–25.2) |
42.6 |
| Readmission within 30 days |
36 |
15.0 (10.7–20.2) |
100.0 |
| Restraint use |
48 |
20 (15.1–25.6) |
64.6 |
| Infections |
83 |
34.6 (28.6–41.0) |
72.3 |
| Stroke |
6 |
2.5 (0.9–5.4) |
100.0 |
| Transfer to higher level of care |
53 |
22.1 (17.0–27.9) |
47.2 |
| Any procedure complication |
179 |
74.6 (68.6–80.0) |
57.0 |
| Other |
157 |
65.4 (59.0–71.4) |
33.8 |
| Medication |
C. difficile-positive stool |
4 |
1.7 (0.5–4.2) |
100.0 |
| PTT >100 seconds |
5 |
2.1 (0.7–4.8) |
40.0 |
| INR >4 |
4 |
1.7 (0.5–4.2) |
50.0 |
| Glucose ≤3mmol or ≥15 mmol |
32 |
13.3 (9.3–18.3) |
6.3 |
| Serum creatinine 2× over baseline |
8 |
3.3 (1.4–6.5) |
37.5 |
| Vitamin K administration |
39 |
16.2 (11.8–21.5) |
20.5 |
| Antihistamine administration |
27 |
11.2 (7.5–15.9) |
37.0 |
| Flumazenil administration |
2 |
0.8 (0.1–3.0) |
0.0 |
| Naloxone administration |
2 |
0.8 (0.1–3.0) |
0.0 |
| Anti-emetic administration |
132 |
55.0 (48.5–61.4) |
18.9 |
| Oversedation hypotension |
89 |
37.1 (31.0–43.5) |
13.5 |
| Abrupt medication stop |
9 |
3.8 (1.7–7.0) |
44.4 |
| Surgical |
Any operative complication |
36 |
15.0 (10.7–20.2) |
97.2 |
| Troponin levels >1.5 ng/l or µg/ml |
20 |
8.3 (5.2–12.6) |
25.0 |
Self-developed
triggers |
Delay in discharge |
39 |
16.2 (11.8–21.5) |
33.3 |
| Phlebitis or extravasation injury |
82 |
34.2 (28.2–40.5) |
8.5 |
| Sudden change in cognitive functions |
58 |
24.2 (18.9–30.1) |
86.2 |
| Total |
1371 |
– |
– |
Adverse events
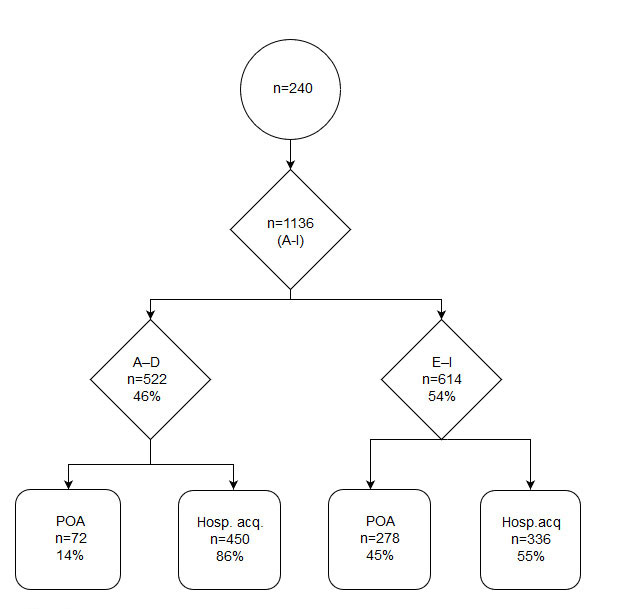
We identified 1136 events, of which 614 (54.0%) were classified as AEs with harm to patients (NCC MERP harm classifications E–I). Of these 614 AEs, 278 (45.3%) were present on admission and 336 (54.7%) occurred during hospitalisation (fig. 2). Detailed results of AEs present on admission are provided in appendix 2. The 336 AEs detected during hospitalisation represented an AE rate of 95.7 AEs per 1000 patient days. These 336 were present in 144 (60.0%) separate patient records: 63 (26.3%) patients suffered from one AE, 33 (13.8%) from two and 48 (20.0%) from three or more. The median number of AEs per patient record was 1.0 (interquartile range [IQR] 0–2; range 0–8) per patient. Healthcare-associated infections such as pneumonia, and urinary tract and fungal infections were the most frequent AE type, representing 62 AEs (25.8%), followed by neurological reactions such as delirium (55 AEs, 22.9%), readmissions (36 AEs, 15%) and skin/tissue damage (24 AEs, 10%). Readmissions were most commonly caused by infections, bleedings, pain and falls.
The most common categories of severity were E (146 AEs, 43.5%) and F (143 AEs, 42.6%). Both indicate temporary harm to patients and they are distinguished by the time necessary to correct the AE: category E events require brief interventions; category F events require extensions of the affected patients’ hospital stays. Twenty-eight (11.6%) patients suffered from life-threating or fatal AEs, such as intraoperative trauma to the lungs, gastrointestinal bleeding or septic shock. Of the 336 AEs identified, 98 (29%) were judged preventable. The most preventable AEs were urinary retention (100%, n = 1), pressure ulcers (88.9%, n = 16), falls (50%, n = 6), surgical complications (46.2%, n = 13) and “others” (42.4%, n = 33). In the category “others”, a wide variety of AEs such as heart failure or respiratory distress (e.g., in the context of fluid substitution), medication errors, delayed treatment or blocked and dislocated tubes/catheters are summarised. Table 3 shows the most prevalent AE types, with their prevalence, severity and preventability (see appendices 3 and 4
for more detailed results).
Table 3 Type, prevalence, severity and preventability of the most prevalent adverse events during hospitalisation for categories E to I only.
|
Type of AE
|
Prevalence of AEs
n = 240
|
Severity of AEs according to NCC MERP (E–I)*, n (%)
|
Preventability†
Preventable %
|
|
n
|
% (CI)
|
E
|
F
|
G
|
H
|
I
|
| Infections |
62 |
25.8 (20.4–31.9) |
26 (41.9) |
28 (45.2) |
2 (3.2) |
5 (8.1) |
1 (1.6) |
24.2 |
| Neurological reaction |
55 |
22.9 (17.8–28.8) |
14 (25.5) |
34 (61.8) |
2 (3.6) |
5 (9.1) |
0 (0.0) |
21.8 |
| Readmission |
36 |
15.0 (10.7–20.2) |
0 (0.0) |
34 (94.4) |
0 (0.0) |
2 (5.6) |
0 (0.0) |
25.0 |
| Skin/tissue damage |
24 |
10.0 (6.5–14.5) |
24 (100) |
0 (0.0) |
0 (0.0) |
0 (0.0) |
0 (0.0) |
33.3 |
| Bleeding |
21 |
8.8 (5.5–13.1) |
13 (61.9) |
5 (23.8) |
1 (4.8) |
2 (9.5) |
0 (0.0) |
19.0 |
| Pressure ulcers |
18 |
7.5 (4.5–11.6) |
18 (100) |
0 (0.0) |
0 (0.0) |
0 (0.0) |
0 (0.0) |
88.9 |
| Surgical complications |
13 |
5.4 (2.9–9.1) |
5 (38.5) |
2 (15.4) |
1 (7.7) |
5 (38.5) |
0 (0.0) |
46.2 |
| Abnormal blood values |
12 |
5.0 (2.6–8.6) |
5 (41.7) |
6 (50.0) |
0 (0.0) |
1 (8.3) |
0 (0.0) |
25.0 |
| Diarrhoea |
10 |
4.2 (2.0–7.5) |
6 (60.0) |
4 (40.0) |
0 (0.0) |
0 (0.0) |
0 (0.0) |
0.0 |
| Others |
33 |
13.8 (9.7–18.8) |
7 (21.2) |
16 (48.5) |
1 (3.0) |
4 (12.1) |
5 (15.2) |
42.4 |
Positive predictive value
Positive predictive values to identify a true AE were calculated for all triggers occurring during hospitalisation. These ranged from 0% for three triggers (acute dialysis, naloxone or flumazenil) to 100% for three triggers (readmission within 30 days, stroke, Clostridium difficile-positive stool). The median PPV was 41.3 (IQR 23.9–65.5) (see table 2 for further details).
Interrater reliability
The Cohen’s kappa (κ) for interrater reliability between the primary reviewers regarding the presence of an AE was 0.98, with a percentage agreement of 99.6%. Regarding agreement on the number of AEs between the primary reviewers, κweighted was 0.96, with a percentage agreement of 80.8%; between the primary reviewers and the physician, κweighted was = 0.98, with a percentage agreement of 87%.
Discussion
We identified 1701 triggers and 614 AEs, of which 336 occurred during hospitalisation–indicating an in-hospital AE rate of 95.7 AEs per 1000 patient days. Our study showed that the GTT is a comprehensive method for identifying a broad spectrum of AEs in a typical internal medicine population of mostly elderly inpatients. In addition, it distinguished clearly between AEs already apparent at admission and those that arose during hospitalisation. As suggested by a recent systematic review concerning trigger tools, detailed results were reported [28].
Triggers
PPVs are often used to assess the efficiency of triggers [3]. In this study, those determined for individual triggers ranged from 0% to 100%. Similar results were reported by one US [29] and one Italian study [30]. Studies have shown considerable variation regarding triggers’ PPVs regardless of their settings or patient populations [3].
In our study, four triggers – “stroke”, “readmission within 30 days”, “C. difficile-positive stool” and “any operative complication” – had the highest PPVs. The first three of these were reliable predictors that always led to an AE in every case they appeared. The trigger “any operative complication” usually indicated complications during surgery that led to harm to patients, giving a high PPV. One previous study yielded a PPV of 2.9% for ”readmissions within 30 days” [29], indicating that, as a trigger, its PPV depends heavily on how individual AEs are defined. As we adapted our definition of the aforementioned trigger, the difference in the PPV rate can be explained.
In fact, we calculated low to medium PPVs for most of our laboratory values and medication triggers. This indicates that, even where triggers are easily located in the EHR and have values outside the reference range, the presence alone of these conditions does not necessarily mean the patient was harmed. On the one hand, a self-developed trigger such as “sudden change in cognitive function”, which was attributed a high PPV (86.2%), mostly reflected changes in attention or cognition described in the nursing notes, often indicated delirium – a condition strongly linked to patient harm. On the other hand, the self-developed “phlebitis or extravasation injury” trigger was detected in 82 cases, of which only 8.5% were judged to involve AEs. The reason for this low PPV is that if noticed early, an extravasation injury itself is not harmful and removing the peripheral intravenous cannula reduces the risk of infection. Further research is necessary to expand the list of triggers in the local setting in order to detect the fullest possible spectrum of AEs.
Adverse events
Our identification of 336 in-hospital AEs assigned to categories E–I will help to establish improvement strategies [29, 31]. In order of incidence, the four most frequent in-hospital AEs we discovered were infections (25.8%), neurological reactions (22.9%), readmission within 30 days (15.0%) and skin/tissue damage (10.0%).
Echoing the 2004 findings of the Swissnoso study, postoperative wound infections, pneumonia and urinary tract infections [32] were the most often observed infections. The Swissnoso study noted that the nosocomial infection rate was highest in internal medicine. This is no surprise: internal medicine patients are often elderly, present multiple morbidities (commonly including severe illnesses), and frequently require invasive care measures (e.g., catheters, surgical procedures). This combination of characteristics leaves internal medicine patients particularly vulnerable to nosocomial infection.
Inouye [33] found an overall incidence of delirium of 29–64% in general medicine and geriatric wards. This helps explain the high rate of neurological reactions in our study group.
In our study, we also found a remarkably high rate of skin/tissue damage such as moisture-associated skin damage (MASD) or the description of “reddish skin”. According to Woo et al. [34], the increasing prevalence of MASD in the aging population worldwide is placing significant burdens both on patients and on their healthcare systems. To minimise the damage, healthcare staff will need to develop the knowledge and skills to assess specific types of MASD and apply appropriate interventions.
Our AE rate of 60% (95.7 AEs per 1000 patient days) was more than three times higher than that found by Halfon et al. (2017) in Swiss medical and surgical patients, using a different methodological approach. That study reported an incidence of 14.1% [11]. In six other general inpatient studies, AEs ranged from 27–99 AEs per 1000 patient days [3].
As found in other GTT studies [15, 35, 36], our study group’s most frequent type of in-hospital AE was healthcare-associated infections. In general, we found that harm categories E (43.5%) and F (42.6%), entailing temporary harm to patients, were most common. This concurred with the results of other studies, which found either harm level E or F most prevalent [16, 35, 37, 38]. However, distinguishing between categories D and E can be very challenging, as it is sometimes unclear whether an intervention was employed to prevent harm (category D) or to minimise harm that had already occurred (category E).
Harm category H, defined as an intervention to sustain life, was most common in response to healthcare-associated infections, and neurological and surgical AEs, and most commonly accompanied transfers to an intensive care unit. However, the inclusion of this transfer under harm category H varies between studies [16, 38]. This may partly explain why our severe AE rates were higher than those measured in other studies [16, 38].
We found an in-hospital AE preventability of 29%, which was low compared with the majority of the nine general inpatient studies (range 14–71%, but with six of these clustering between 50% and 65%) summarised in the 2016 systematic review of Hibbert et al. [10]. One reason for our generally low preventability rate may be our high rate of AEs: the extent to which an AE results from an error or was the result of the natural disease process is often unclear. Therefore, preventability was assessed as rather low. For example infections, which were among the most frequent AEs, were considered to be preventable to a quarter. The reasons for infections (e.g., poor hand hygiene, inaccurate handling of catheters) are, however, often unclear and cannot be determined to a specific day and time, which makes it particularly difficult to judge the preventability. In addition, preventability rates varied across our findings: several types of AEs, such as diarrhoea and abnormal blood values, have low preventability, whereas pressure ulcers have a preventability of almost 90%.
High interstudy variability regarding preventability has been discussed previously [10]. The various scales in use for measuring preventability certainly add to the challenges of accurate comparison. Diverse AE rates between institutions, as well as the wide range of AE rates, may result from the use of different triggers, AE definitions, settings and methodologies [6, 10]. Our study used a definition of AEs that included minor AEs such as fungal infections, whereas other studies have been narrower, focussing on severe or preventable AEs [17]. Therefore, the IHI [4] have suggested that AE rates be used to track changes over time only within a single institution.
Interrater reliability
We found very high agreement between the primary reviewers regarding the presence of AEs (κ = 0.98), as well as a high degree of consensus on the number of AEs between the two primary reviewers (κweighted = 0.96), and between the primary reviewers and the physician (κweighted = 0.98). In the systematic review of Hibbert et al. [10], in which 22 studies measured interrater reliability there was considerable variation in AE agreement both between the primary reviewers (κ = 0.34–0.86) and between primary and secondary reviewers (κ = 0.34–0.89). One plausible explanation for our reviewers’ high level of interrater reliability is a combination of their shared training, the fact that they were a consistent and experienced review team, their use of a structured chart review protocol and their regular participation in team discussions of the results aimed at resolving variations in triggers and AE identification. All of these points have been emphasised by previous studies in efforts to improve consistency and interrater reliability [4, 10, 39].
Clinical relevance
In Switzerland, approaches to measuring AE rates include clinical surveillance of specific AE types (patient falls, surgical site infections) [13], (voluntary) incident reporting and, in some hospitals, morbidity and mortality conferences [40, 41]. However, all of these approaches provide only a partial view of AEs. This study has shown that the GTT method is a detailed and comprehensive tool for the detection of AEs.
However, the GTT cannot be applied without adaptations to the local setting. Triggers must be adapted to local events and operationalised to achieve a standardised approach. In addition, the definition of an AE and the gauging of its severity may give rise to arguments: it is unclear how the level of harm is to be interpreted in each case. Despite the additional work necessary to apply GTT methodology, it provides a thorough system first for detecting AEs, then for raising local awareness of them as a prelude to implementing quality improvement strategies [29].
Limitations
Our study has several potential limitations that should be taken into consideration:
- Retrospective chart review, including via the GTT, depends heavily on the quality of the EHR. For example, where AEs occur but no corrective measures are documented, they cannot be identified.
- The EHR facilitates the review process as all information is provided in one place and not across different archives. The EHR used provided seamless information, even if the patient was transferred to another department of the hospital. However, we excluded two modules (“emergency department” and “intensive care”) from the GTT. Because of the lack of interoperability between the different EHR systems, we only had limited data available in form of a summary. This exclusion may have led to an underestimation of AE’s in our study.
- The small sample size of our retrospective chart review and single-hospital patient sample may limit the generalisability of our findings.
- We looked only at patient charts from the index hospitalisation. As noted above, tracing the origin of possible AEs and their harm would require investigation of previous and subsequent patient charts.
- Patients in internal medicine often suffer from multiple chronic illnesses, leading to complex clinical situations. Even though we used a standardised GTT protocol, interpretation remains subjective, which may lead to misclassification.
Future implications
Developing preventive strategies for the entire hospital will require further investigation, including the application of all six GTT modules to different wards in the study hospital. At the same time, as suggested by a 2017 Swiss chart review study [11], a national strategy will be necessary to produce more reliable estimates of specific AE incidence. As the chart review method is very resource-intensive, despite the setting of triggers and a 20-minute time limit for trigger detection, the possibility of automated trigger/AE detection in the EHR [42, 43] – whether alone or in combination with a chart review – is becoming increasingly important. An additional advantage of automated trigger detection would be the prospective detection of AEs. In retrospective chart reviews, the patient record has been closed and no further interventions can be made to limit patient harm or to investigate factors contributing to AEs. Prospective clinical surveillance [44] would provide a platform to learn from mistakes. In such a situation, the implementation of interventions could reduce the likelihood of AEs (or limit the harm they do) in future inpatients.
Conclusion
We identified 1371 positive triggers indicating 336 in-hospital AEs in 240 medical patients in a university hospital in Switzerland. Of the 336 AEs detected, almost a third could have been prevented. Using the “care” and “medication” modules, we found that the GTT offers a detailed method of identifying AEs in medical inpatients. Our findings provide evidence as to the nature of AEs and indicate that patient safety could be improved by addressing the most prevalent, severe and preventable AEs. An efficient approach to identifying AEs and subsequently to improving patient safety would be not only beneficial to the patients, who could avoid unnecessary harm, but also cost effective in terms of reduced hospital stays.
Appendix 1 Description of the triggers
Appendix 2 Type, prevalence and severity of adverse events present on admission for categories E to I only
Appendix 3 Type, prevalence and severity of events during hospitalisation
Appendix 4 Type, prevalence, severity and preventability of adverse events during hospitalisation
The appendices are available in a separate file at https://smw.ch/article/doi/smw.2019.20149.
Acknowledgements
We thank our colleagues from the Medical Directorate, Dr Endrich, Dr Triep and Dr Beck, for their assistance with the routinely collected health data from Inselspital, University Hospital of Bern. We would also like to thank Chris Shultis for professional editing of the manuscript.
Author contributions
MS developed the idea for this study. MS, SNM and NG contributed to the design, analysis and interpretation of data. NG contributed to the drafting of the manuscript. NG, FG and JD contributed to the data collection, which was prepared by NN. All authors critically revised the manuscript and approved the final version.
References
1World Health Organization. 10 Facts on Patient Safety Geneva, 2017 [cited 2018 June 03]. Available from: http://www.who.int/features/factfiles/patient_safety/en/.
2Vincent C. The nature and scale of error and harm. Patient Safety. 2: Willey Blackwell, BMJ Books; 2010. p. 49–74.
3Health Quality & Safety Commission New Zealand. The Global Trigger Tool: A Review of the Evidence, 2013. Available from: https://www.hqsc.govt.nz/assets/GTT/GTT-evidence-review-Oct-2013.pdf.
4Griffin F, Resar RK. IHI Global Trigger Tool for Measuring Adverse Events. IHI Innovation Series white paper [Internet]. 2009. Available from: www.IHI.org).
5
Naessens
JM
,
Campbell
CR
,
Huddleston
JM
,
Berg
BP
,
Lefante
JJ
,
Williams
AR
, et al.
A comparison of hospital adverse events identified by three widely used detection methods. Int J Qual Health Care. 2009;21(4):301–7. doi:.https://doi.org/10.1093/intqhc/mzp027
6
de Vries
EN
,
Ramrattan
MA
,
Smorenburg
SM
,
Gouma
DJ
,
Boermeester
MA
. The incidence and nature of in-hospital adverse events: a systematic review. Qual Saf Health Care. 2008;17(3):216–23. doi:.https://doi.org/10.1136/qshc.2007.023622
7
O’Leary
KJ
,
Devisetty
VK
,
Patel
AR
,
Malkenson
D
,
Sama
P
,
Thompson
WK
, et al.
Comparison of traditional trigger tool to data warehouse based screening for identifying hospital adverse events. BMJ Qual Saf. 2013;22(2):130–8. doi:.https://doi.org/10.1136/bmjqs-2012-001102
8
Kjellberg
J
,
Wolf
RT
,
Kruse
M
,
Rasmussen
SR
,
Vestergaard
J
,
Nielsen
KJ
, et al.
Costs associated with adverse events among acute patients. BMC Health Serv Res. 2017;17(1):651. doi:.https://doi.org/10.1186/s12913-017-2605-5
9
Thomas
EJ
,
Brennan
TA
. Incidence and types of preventable adverse events in elderly patients: population based review of medical records. BMJ. 2000;320(7237):741–4. doi:.https://doi.org/10.1136/bmj.320.7237.741
10
Hibbert
PD
,
Molloy
CJ
,
Hooper
TD
,
Wiles
LK
,
Runciman
WB
,
Lachman
P
, et al.
The application of the Global Trigger Tool: a systematic review. Int J Qual Health Care. 2016;28(6):640–9. doi:.https://doi.org/10.1093/intqhc/mzw115
11
Halfon
P
,
Staines
A
,
Burnand
B
. Adverse events related to hospital care: a retrospective medical records review in a Swiss hospital. Int J Qual Health Care. 2017;29(4):527–33. doi:.https://doi.org/10.1093/intqhc/mzx061
12Patientensicherheit Schweiz. Ein Public Health-Problem - Facts & Figures Zürich: Stiftung für Patientensicherheit Schweiz; n.d. [cited 2018 June 03]. Available from: http://www.patientensicherheit.ch/de/themen/Patientensicherheit.html.
13Swissnoso. SSI Surveillance: Verein Swissnoso. Nationales Zentrum für Infektionsprävention; 2018 [cited 2018 June 03]. Available from: https://www.swissnoso.ch/module/ssi-surveillance/ueber-ssi-surveillance/das-modul/.
14Agency for Healtcare Research and Quality (AHRQ). Patient Safety Indicators Rockville, MD, USA: Agency for Healtcare Research and Quality 2017 [cited 2018 June 03]. Available from: https://qualityindicators.ahrq.gov/Modules/PSI_TechSpec_ICD10_v60.aspx.
15
Rutberg
H
,
Borgstedt Risberg
M
,
Sjödahl
R
,
Nordqvist
P
,
Valter
L
,
Nilsson
L
. Characterisations of adverse events detected in a university hospital: a 4-year study using the Global Trigger Tool method. BMJ Open. 2014;4(5):e004879. doi:.https://doi.org/10.1136/bmjopen-2014-004879
16
Kennerly
DA
,
Kudyakov
R
,
da Graca
B
,
Saldaña
M
,
Compton
J
,
Nicewander
D
, et al.
Characterization of adverse events detected in a large health care delivery system using an enhanced global trigger tool over a five-year interval. Health Serv Res. 2014;49(5):1407–25. doi:.https://doi.org/10.1111/1475-6773.12163
17
Classen
DC
,
Resar
R
,
Griffin
F
,
Federico
F
,
Frankel
T
,
Kimmel
N
, et al.
‘Global trigger tool’ shows that adverse events in hospitals may be ten times greater than previously measured. Health Aff (Millwood). 2011;30(4):581–9. doi:.https://doi.org/10.1377/hlthaff.2011.0190
18
Murff
HJ
,
Patel
VL
,
Hripcsak
G
,
Bates
DW
. Detecting adverse events for patient safety research: a review of current methodologies. J Biomed Inform. 2003;36(1-2):131–43. doi:.https://doi.org/10.1016/j.jbi.2003.08.003
19Insel Gruppe AG. Bettenkennzahlen. In: Klinik für Allgemeine Innere Medizin, editor. Bern: Inselspital, Universitätsspital Bern; 2016.
20Insel Gruppe AG. Die Universitätsklinik für Allgemeine Innere Medizin Bern: Inselspital; (n.d) [cited 2018 June 01]. Available from: http://www.inneremedizin.insel.ch/de/ueber-uns/.
21
Soop
M
,
Fryksmark
U
,
Köster
M
,
Haglund
B
. The incidence of adverse events in Swedish hospitals: a retrospective medical record review study. Int J Qual Health Care. 2009;21(4):285–91. doi:.https://doi.org/10.1093/intqhc/mzp025
22Bothe J, von Hielmcrone C. Aktives Messinstrument der Patientensicherheit -das IHI Global Trigger Tool. Stärkung der Patientensicherheit zwischen Dänemark und Deutschland [Internet]. 2009 [cited 2018 June 02]. Available from: http://www.ihi.org/resources/Pages/Tools/IHIGlobalTriggerToolforMeasuringAEs.aspx.
23National Coordinating Council for Medication Error Reporting and Prevention (NCC MERP). Types of medication errors 2001 [cited 2019 June 17]. Available from: https://www.nccmerp.org/types-medication-errors.
24R Development Core Team. R: A language and environment for statistical computing. R Foundation for Statistical Computing Vienna, Austria2008. Available from: http://www.R-project.org.
25Winston C. Interrater reliability n.a. [cited 2018 June 01]. Available from: http://www.cookbook-r.com/.
26Polit DF, Beck CT. Nursing research: generating and assessing evidence for nursing practice. 9th ed. Philadelphia: Lippincott, Williams & Wilkins; 2012. 802 S. p.
27Deutsches Institut für Medizinische Dokumentation und Information D. ICD-10-GM. Version 2018, Internationale statistische Klassifikation der Krankheiten und verwandter Gesundheitsprobleme 10. Revision German Modification. Version 2016 Köln: Bundesministeriums für Gesundheit (BMG); 2017 [cited 2018 June 03]. Available from: http://www.dimdi.de/static/de/klassi/icd-10-gm/kodesuche/onlinefassungen/htmlgm2016/index.htm.
28
Musy
SN
,
Ausserhofer
D
,
Schwendimann
R
,
Rothen
HU
,
Jeitziner
MM
,
Rutjes
AW
, et al.
Trigger Tool-Based Automated Adverse Event Detection in Electronic Health Records: Systematic Review. J Med Internet Res. 2018;20(5):e198. doi:.https://doi.org/10.2196/jmir.9901
29
Kennerly
DA
,
Saldaña
M
,
Kudyakov
R
,
da Graca
B
,
Nicewander
D
,
Compton
J
. Description and evaluation of adaptations to the global trigger tool to enhance value to adverse event reduction efforts. J Patient Saf. 2013;9(2):87–95. doi:.https://doi.org/10.1097/PTS.0b013e31827cdc3b
30
Mortaro
A
,
Moretti
F
,
Pascu
D
,
Tessari
L
,
Tardivo
S
,
Pancheri
S
, et al.
Adverse Events Detection Through Global Trigger Tool Methodology: Results From a 5-Year Study in an Italian Hospital and Opportunities to Improve Interrater Reliability. J Patient Saf. 2017. Published online June 10, 2017. doi:.https://doi.org/10.1097/PTS.0000000000000381
31
Good
VS
,
Saldaña
M
,
Gilder
R
,
Nicewander
D
,
Kennerly
DA
. Large-scale deployment of the Global Trigger Tool across a large hospital system: refinements for the characterisation of adverse events to support patient safety learning opportunities. BMJ Qual Saf. 2011;20(1):25–30. doi:.https://doi.org/10.1136/bmjqs.2008.029181
32
Senn
L
,
Sommerstein
R
,
Troillet
N
. Prävention Healthcare-assoziierter Infektionen im Jahr 2017. Swiss Med Forum. 2017;17(45):974–8. doi:.https://doi.org/10.4414/smf.2017.03116
33
Inouye
SK
. A practical program for preventing delirium in hospitalized elderly patients. Cleve Clin J Med. 2004;71(11):890–6. doi:.https://doi.org/10.3949/ccjm.71.11.890
34
Woo
KY
,
Beeckman
D
,
Chakravarthy
D
. Management of Moisture-Associated Skin Damage: A Scoping Review. Adv Skin Wound Care. 2017;30(11):494–501. doi:.https://doi.org/10.1097/01.ASW.0000525627.54569.da
35
Suarez
C
,
Menendez
MD
,
Alonso
J
,
Castaño
N
,
Alonso
M
,
Vazquez
F
. Detection of adverse events in an acute geriatric hospital over a 6-year period using the Global Trigger Tool. J Am Geriatr Soc. 2014;62(5):896–900. doi:.https://doi.org/10.1111/jgs.12774
36
Mevik
K
,
Griffin
FA
,
Hansen
TE
,
Deilkås
ET
,
Vonen
B
. Does increasing the size of bi-weekly samples of records influence results when using the Global Trigger Tool? An observational study of retrospective record reviews of two different sample sizes. BMJ Open. 2016;6(4):e010700. doi:.https://doi.org/10.1136/bmjopen-2015-010700
37
Nilsson
L
,
Risberg
MB
,
Montgomery
A
,
Sjödahl
R
,
Schildmeijer
K
,
Rutberg
H
. Preventable adverse events in surgical care in Sweden: A nationwide review of patient notes. Medicine (Baltimore). 2016;95(11):e3047. doi:.https://doi.org/10.1097/MD.0000000000003047
38
Kurutkan
MN
,
Usta
E
,
Orhan
F
,
Simsekler
MC
. Application of the IHI Global Trigger Tool in measuring the adverse event rate in a Turkish healthcare setting. Int J Risk Saf Med. 2015;27(1):11–21. doi:.https://doi.org/10.3233/JRS-150639
39
von Plessen
C
,
Kodal
AM
,
Anhøj
J
. Experiences with global trigger tool reviews in five Danish hospitals: an implementation study. BMJ Open. 2012;2(5):e001324. doi:.https://doi.org/10.1136/bmjopen-2012-001324
40Patientensicherheit Schweiz. Critical Incident Reporting & Reacting NETwork Zürich: Stiftung für Patientensicherheit; n.d. [cited 2018 June 03]. Available from: http://www.patientensicherheit.ch/de/themen/Aus-Fehlern-lernen---Meldesysteme/CIRRNET.html.
41Patientensicherheit Schweiz. Morbiditäts- und Mortalitätskonferenzen (MoMo) Zürich: Stiftung für Patientensicherheit; n.d [cited 2018 June 02]. Available from: http://www.patientensicherheit.ch/de/themen/Umgang-mit-Zwischenfaellen/Morbidit-ts--und-Mortalit-tskonferenzen-.html.
42
Li
Q
,
Melton
K
,
Lingren
T
,
Kirkendall
ES
,
Hall
E
,
Zhai
H
, et al.
Phenotyping for patient safety: algorithm development for electronic health record based automated adverse event and medical error detection in neonatal intensive care. J Am Med Inform Assoc. 2014;21(5):776–84. doi:.https://doi.org/10.1136/amiajnl-2013-001914
43
Menendez
ME
,
Janssen
SJ
,
Ring
D
. Electronic health record-based triggers to detect adverse events after outpatient orthopaedic surgery. BMJ Qual Saf. 2016;25(1):25–30. doi:.https://doi.org/10.1136/bmjqs-2015-004332
44
Wong
BM
,
Dyal
S
,
Etchells
EE
,
Knowles
S
,
Gerard
L
,
Diamantouros
A
, et al.
Application of a trigger tool in near real time to inform quality improvement activities: a prospective study in a general medicine ward. BMJ Qual Saf. 2015;24(4):272–81. doi:.https://doi.org/10.1136/bmjqs-2014-003432