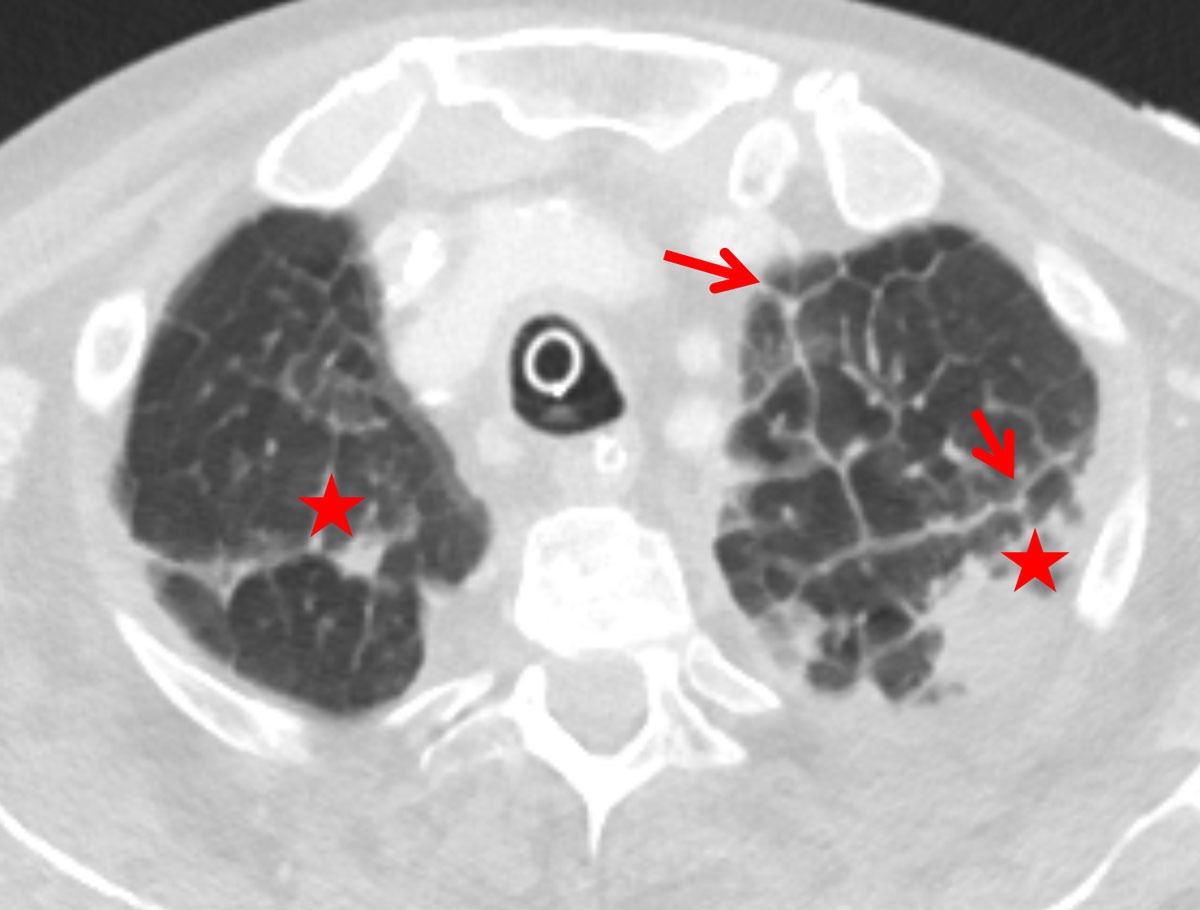
Figure 1 Thickened apical interlobular septa (Kerley B, red arrows) with transudation (asterisk) due to cardiac insufficiency in a 74-year-old female patient.
DOI: https://doi.org/10.4414/smw.2019.20119
Pulmonary oedema is defined as the abnormal accumulation of extravascular fluid in the lung. The most common reasons for pulmonary oedema or pulmonary congestion are cardiac or renal insufficiency (see table 1). Pulmonary congestion is characterised by increased interstitial and/or alveolar fluid caused by an increased capillary pressure (cardiac) or an increased permeability of the pulmonary vessels [1]. The relation between those factors is depicted in the Starling equation:
Table 1 Aetiology of lung oedema [3].
| Increased capillary hydrostatic pressure | Cardiac (left ventricular insufficiency) | |
| Hyperperfusion | Renal insufficiency | |
| Overhydration | ||
| High altitude pulmonary oedema | ||
| Postembolic | ||
| Postpneumonectomy | ||
| Neurogenic | ||
| Pulmonary vein occlusion | ||
| Decreased extracapillary pressure | Re-expansion pulmonary oedema | |
| Negative pressure pulmonary oedema | ||
| Decreased oncotic pressure | Renal insufficiency | |
| Overhydration | ||
| Hepatic insufficiency | ||
| Malnutrition | ||
| Increased capillary permeability | Extracapillary | Toxin inhalation |
| Aspiration | ||
| Pulmonary infection | ||
| Intracapillary | Sepsis | |
| Hypotension | ||
| Pancreatitis | ||
| Disseminated intravascular coagulation | ||
| Trauma | ||
| Reduced lymphatic resorption | Lymphangiosis carcinomatosa | |
| Pneumoconiosis | ||
| Lymphangiectasia | ||
Jv = Kf [(Pc−Pi)−(Πc−Πi)]
Where Jv = net fluid movement (ml/min) – positive value indicates movement out of the circulation; Kf = vascular permeability coefficient; Pc = capillary hydrostatic pressure; Pi = interstitial hydrostatic pressure; Πc = capillary oncotic pressure; and Πi = interstitial oncotic pressure [2].
One of the most common reasons for requesting chest radiographs is presumed to be a clinical suspicion of pulmonary oedema. The typical signs of pulmonary congestion such as increased heart size and shape, vascular pedicle width, peribronchial cuffing and septal lines have been described by Milne et al. [3]; however, the assessment of pulmonary congestion remains one of the more difficult routine tasks in chest radiology. There are few publications concerning signs of pulmonary oedema on computed tomography (CT) that describe the dilemma of vascular cranialisation of the supine patient and patterns of pulmonary oedema. Publications about lung oedema on CT used to focus on lung density; for example, Vergani et al. focused on the difference between acute respiratory distress syndrome (ARDS) and cardiogenic pulmonary oedema by analysing the distribution of ground-glass and airspace consolidation [4]. Currently, there are few publications addressing the CT appearance of signs known from chest x-ray: almost all focus on ground-glass attenuation and airspace consolidation [4–6].
Increased cardiothoracic ratio [ 3–5 ]: the classic cardiothoracic ratio is measured on a PA chest x-ray but can also be measured on CT images. It is the ratio of the maximum horizontal cardiac diameter to the maximum horizontal thoracic diameter (inner edge of ribs / edge of pleura). A normal measurement should be ≤0.5.
Elevated diameter of the superior and inferior vena cava [ 3 ]: marker of increased central venous pressure and increased circulating blood volume.
Peribronchial cuffing: haziness or increased density around the walls of a bronchus or large bronchiole seen end-on, both on plain radiographs and on CT. It may represent bronchial wall thickening or fluid around bronchi due to congestion.
Interlobular septal thickening (Kerley B lines) [ 3–6 ]: thickening of the peripheral interlobular septa recognised as pulmonary lobules in the pulmonary interstitium because of their typical size and polygonal shape [6–8].
Ground glass opacity: increased attenuation of the lung in CT. Bronchial walls, vessels and septal lines can still be seen through the GGO [8, 9].
Consolidation: increased attenuation of the lung in the high-resolution CT scan. Bronchial walls, vessels and septal lines cannot be seen due to adjacent dense consolidation [8, 9].
Pleural effusion: collection of fluid within the pleural space.
In patients with pulmonary congestion, Kerley B lines on conventional imaging usually follow gravity with a basilar predominance [4]. Also on CT, they can be found in the lower and dorsal areas. It is our experience that septal thickening in these patients can also be seen in the lung apex. Therefore, we hypothesised that patients with pulmonary congestion demonstrate Kerley B lines in the apex of the lung and that this could be a new sign for pulmonary congestion on CT scans.
The aim of the study was to test the prevalence of apical Kerley B lines in patients with pulmonary congestion and examine established radiographic signs in CT in comparison to patients with interstitial lung disease (ILD).
Institutional review board approval could be waived owing the retrospective nature of the study with irreversible anonymisation of patients’ identifiers. We included patients with reported pulmonary congestion or ILD on CT from January 2014 to January 2017.
We included 180 patients: 90 patients with pulmonary congestion and 90 patients with ILD. All cases were retrospectively and consecutively included, starting in January 2014, until there were 90 cases. To find the patient population we used a full text search of the radiological reports in RIS (Radiological Information System, General Electric, Milwaukee, Wisconsin, USA) and matched/combined the results with the electronic patients medical files found (electronic patient documentation, CGM PHOENIX clinical information system, Switzerland). The diagnosis of pulmonary congestion was made semi-quantitatively from radiological proof of water retention and a clinical diagnosis of heart and/or kidney failure. All cases of pulmonary congestion that we found with the full text search were verified by two chest radiology experts with 19 and 11 years of experience.
Patients with an unknown origin of congestion or a cause other than cardiac or renal insufficiency (such as toxic oedema) were excluded from the study population. Finally, 43 patients with cardiac insufficiency, 17 patients with renal insufficiency and 30 patients with combined cardiac/renal insufficiency were included.
The diagnoses were made by board-approved specialists in cardiology and nephrology according to the international guidelines [10–12].
The group with pure cardiac insufficiency consisted of 43 patients: 23% with valvular heart disease (n = 10), 16% arrhythmogenic heart disease (7), 14% coronary heart disease (6), 12% unknown or dilated cardiomyopathy (5), 9% hypertensive heart disease (4), 2% amyloidosis (1) and 23% mixed, mostly hypertensive and valvular heart disease (10). The New York heart association (NYHA) class was rarely found in the electronic patient history; therefore we relied on the left ventricular ejection fraction (LVEF). LVEF was classified as normal (≥55%), mild reduction ( 45–54%), moderate reduction (30–44%) or severe reduction (<30%) according to the American Heart Association [10]. Our heart failure group included 23 patients with normal, 8 with mild, 9 with moderate and 3 with severe reduced LVEF. Mean LVEF ± SD (standard deviation) was 53 ± 16%.
The 17 patients with pure renal insufficiency suffered from the following diseases: 12% glomerulonephritis/interstitial nephritis (n = 2), 12% renal transplant (n = 2), 6% diabetes (n = 1), 6% hypertension (n = 1), 6% medication induced nephropathy (n = 1), 6% tumour disease (n = 2), 18% mixed nephropathies (n = 3) and 29% unknown (n = 5).
Only a few patients with renal failure were rated according to the albumin:creatinine ratio; therefore we classified the renal insufficiency on the basis of the glomerular filtration rate (eGFR) according to the guidelines of the Kidney Disease Improving Global Outcomes (KDIGO) [11, 12]: G1, G2, G3, G4 and G5 stand for normal eGFR (≥90 ml/min), mild reduction (60–89 ml/min), moderate reduction (30–59 ml/min), severe reduction (15–29 ml/min) and kidney failure (eGFR <15 ml/min), respectively. At the time of the chest CT examination, 3, 6, 1 and 6 patients were classified into eGFR groups G2, G3, G4, G5, respectively, and one patient had a normal filtration rate (G1). On average the eGFR was 41 ± 28 ml/min in the group with pure renal failure.
In the mixed group of 30 patients suffering from cardiac and renal failure the disease prevalences were comparable to those in the groups with pure cardiac or kidney disease. The average LVEF was 45 ± 16% and the average eGFR was 46 ± 23 ml/min.
Additional, 90 patients with ILD were retrospectively selected from the interstitial lung disease board at our hospital. All patients with suspicion of pulmonary fibrosis at our hospital undergo the ILD-board procedure. The diagnosis was made by a pneumologist, a radiologist and a pathologist in consensus, according to international guidelines [13–15].
CT scans were performed using a 128-detector row CT scanner (Siemens Somatom Definition FLASH, Siemens Healthineers, Erlangen, Germany) or a 64-detector row CT scanner (Philips Brilliance 64, Philips Medical Systems, Best, Netherlands) as part of the routine clinical workup. CT scans were performed during the end-inspiratory phase with the breath-hold technique. Images were acquired in the supine position from apex of the lung to the costodiaphragmatic angles. A tube voltage from 100 to 120 kVp and a reference mAs from 100 to 120 were applied. On the 128-detector scanner a collimation of 128 × 0.6 mm was used with a pitch of 0.6. A slice thickness of 1 mm was reconstructed, and iterative reconstruction level 3 and hard lung kernel of I70f were applied. On the 64-detector scanner a collimation of 64 × 0.625 mm was used with a pitch of 1.42. A slice thickness 1 mm was reconstructed, and iterative reconstruction level 4 and hard lung kernel of I70f were applied.
The read-out was performed on a Picture Archiving and Communication System (PACS, Sectra, Linköping, Sweden). Two radiologists with 2 and 8 years of experience in chest radiology reviewed the CT images in consensus.
The cardiothoracic ratio and the diameters of the superior and inferior vena cava were measured. Pleural effusion, peribronchial cuffing, interlobular septal thickening (Kerley B lines, see figs 1 and 2 ), ground glass opacity and consolidation were analysed for prevalence, distribution and quantity. To determine the cardiothoracic ratio, the maximum horizontal diameter of the heart in the axial plane and the maximum inner thoracic diameter (inner edge of ribs / edge of pleura) were captured and divided. The diameters of the superior and inferior vena cava (short axis) were measured on an axial plane just before their entrance into the right atrium of the heart. Thickening of the interlobular septa and the bronchial walls (peribronchial cuffing) was graded as 1 if <1 mm, 2 if 1–3 mm or 3 if >3 mm. The amount of pleural effusion was visually estimated as low grade (trace of effusion), moderate (<500 ml) and high-grade (>500 ml). The amounts of ground glass opacity and consolidation were graded from 1 to 3 (+, ++, +++) in each region. The distributions of these latter patterns were analysed in four anatomical regions separately (z-axis): apex (uppermost 2 cm of the lungs), upper lungs (cranial of the aortic arch), middle lungs (cranial of the lower lung veins) and lower lungs (heart level and lower). In addition, the oedema patterns were classified into predominantly central with subpleural spearing (butterfly oedema) and gravity oedema (lower dorsal parts of the lungs most affected).
Mann-Whitney-test was applied for numerical variables. Categorical data were analysed with the chi-square test. If any of the cells of a contingency table were below 10, then Fisher’s exact test was used. Bonferroni correction was applied according to the number of variables (three numerical and five categorical). MedCalc® version 15.0 (MedCalc Software, Ostend, Belgium) and a significance level of p <0.05 was utilised. Groups 1, 2, 3 and 4 were the cardiac, renal, mixed insufficiency and ILD, respectively. Group 1 was tested against group 2. In addition, the combined group 1, 2 and 3 was compared with group 4.
Interlobular septal thickening (IST) in the lung apex was present in of 81% and 76% of the cardiac and renal groups, respectively, which was significantly more than in the ILD group (26%, p <0.0001, figs 1–4 ). The distribution in the insufficiency group was more homogenous throughout the lungs than in the ILD group, in which the amount of septal thickening increased to 90% towards the lower lobes (table 2). The average thickness of the interlobular septa was rated between 1 and 2 with significantly thicker septal lines in the insufficiency group (1.45 ± 0.6) compared with the ILD group (1.28 ± 0.5; p <0.0001, fig. 3).
Figure 1 Thickened apical interlobular septa (Kerley B, red arrows) with transudation (asterisk) due to cardiac insufficiency in a 74-year-old female patient.
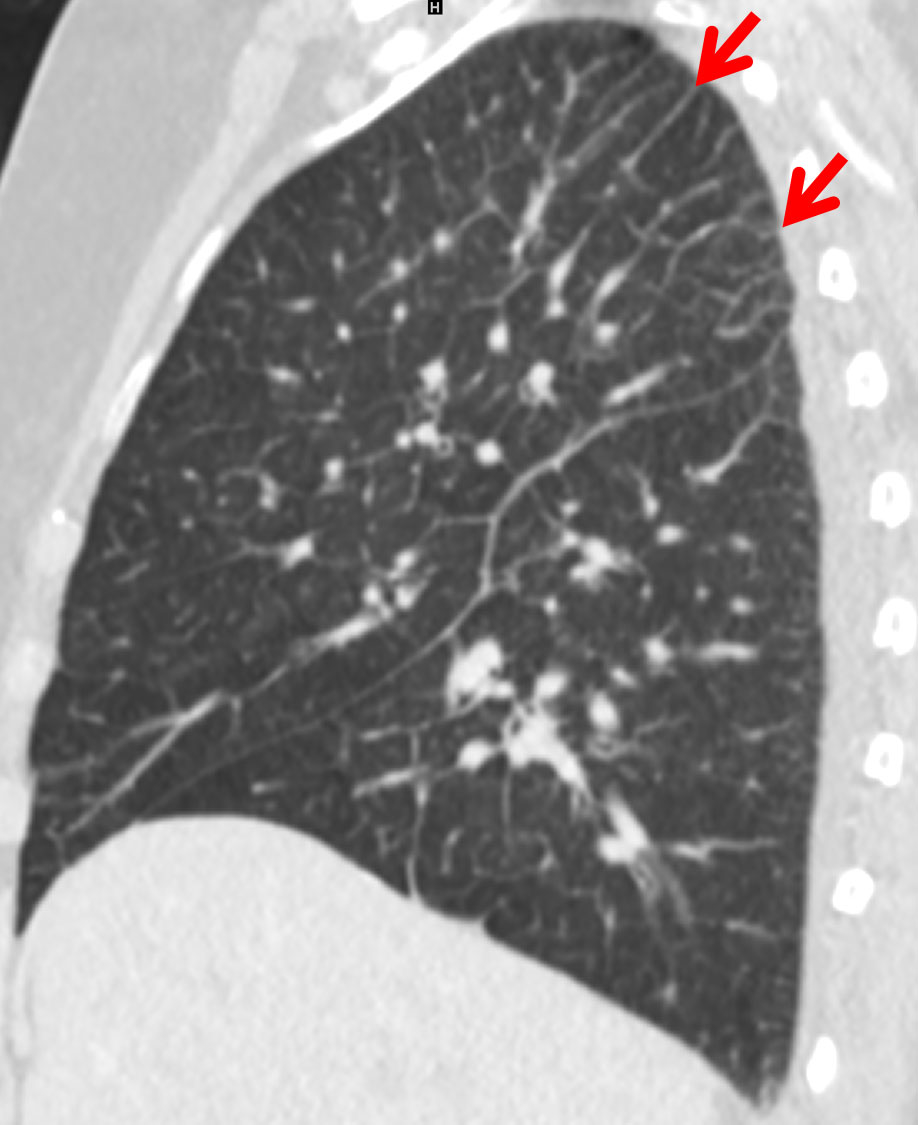
Figure 2 Predominantly apical Kerley B lines (red arrow) due to early pulmonary congestion in a 74-year-old male patient with cardiac insufficiency.
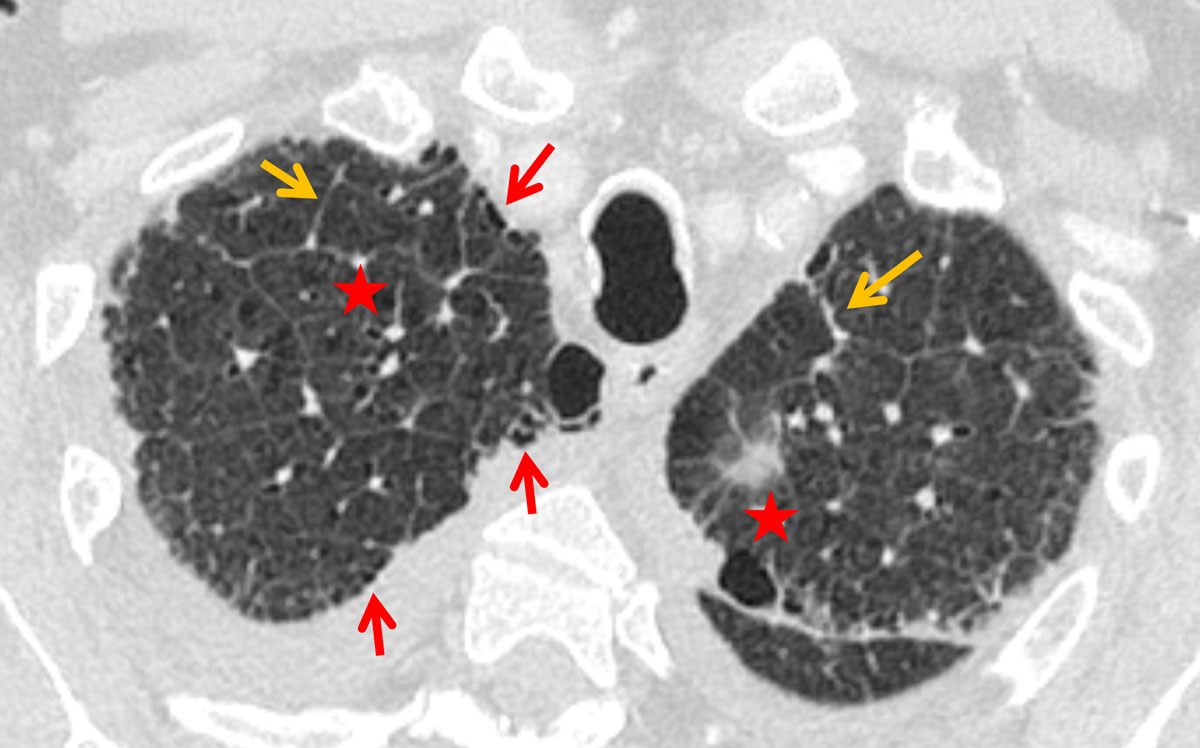
Figure 3 Interlobular septal thickening (orange arrows), slight architectural distortion (asterisks) and a faint honeycombing (red arrows) in a 70-year-old male patient with idiopathic pulmonary fibrosis (IPF).
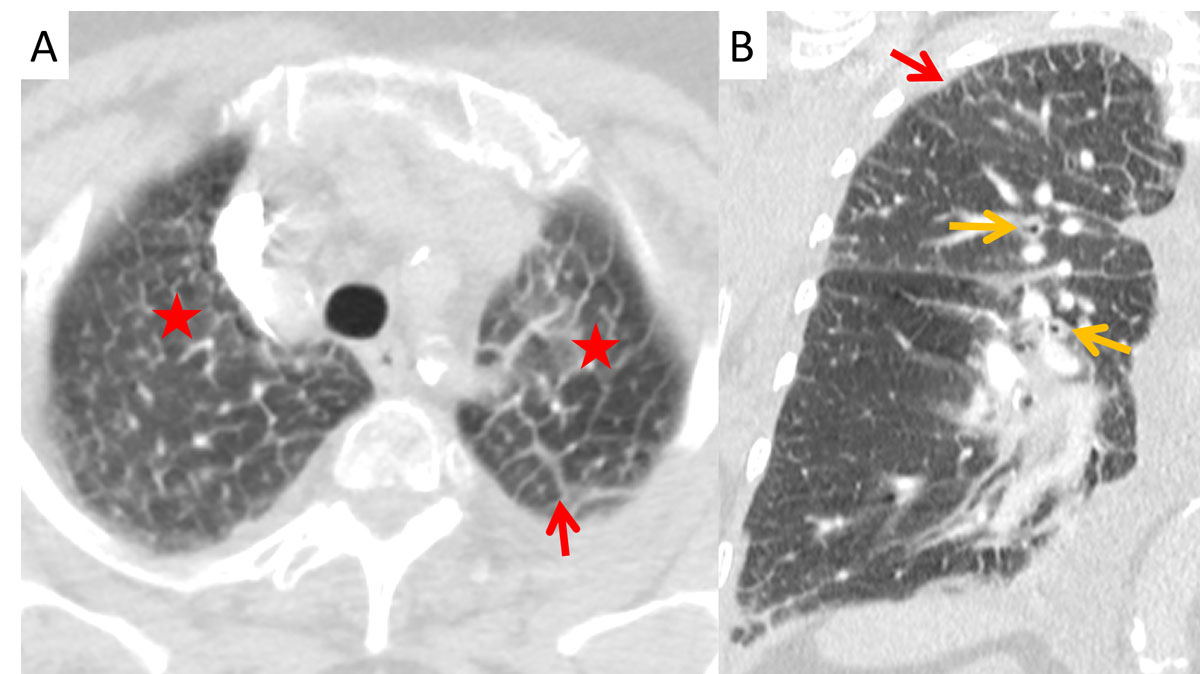
Figure 4 Apical Kerley B lines (red arrows) in (A) axial and (B) coronal planes with peribronchial cuffing (orange arrows) and ground glass opacities (asterisk) from transudation in a 63-year-old male patient with renal insufficiency.
Table 2 Prevalence of cardio-pulmonary congestion signs.
| Cardiac vs renal insufficiency | Cardiac and/or renal insufficiency vs interstitial lung disease | ||||||
|---|---|---|---|---|---|---|---|
|
Cardiac
(n = 43) |
Renal
(n = 17) |
p-value |
Insufficiency
(n = 90) |
Interstitial lung disease
(n = 90) |
p-value | ||
| Cardiopulmonary congestion signs | Cardiothoracic ratio, mean ± SD | 0.58 ± 0.08 | 0.53 ± 0.06 | 0.06 | 0.56 ± 0.07 | 0.50 ± 0.05 | <0.0001 |
| Diameter inferior vena cava (mm), mean ± SD | 25 ± 4 | 23 ± 4 | 0.08 | 25 ± 4 | 21 ± 4 | <0.0001 | |
| Diameter superior vena cava (mm), mean ± SD | 19 ± 3 | 20 ± 3 | 1 | 19 ± 3 | 16 ± 4 | <0.0001 | |
| Pleural effusion | 74% | 65% | 1 | 76% | 6% | <0.0001 | |
| Peribronchial cuffing | 67% | 29% | 0.04 | 59% | 12% | <0.0001 | |
| Interlobular septal thickening | Apex | 81% | 76% | 1 | 73% | 26% | <0.0001 |
| Upper lung | 79% | 76% | 1 | 71% | 32% | <0.0001 | |
| Middle lung | 40% | 53% | 1 | 42% | 33% | 1 | |
| Lower lung | 77% | 88% | 1 | 83% | 90% | 1 | |
| Ground glass opacity | Predominantly central with subpleural sparing | 0% | 0% | 1 | 0% | 0% | 1 |
| Gravitational oedema | 14% | 6% | 1 | 14% | 0% | <0.0001 | |
| Upper lung | 35% | 59% | 0.58 | 38% | 31% | 1 | |
| Middle lung | 21% | 47% | 0.24 | 29% | 40% | 0.79 | |
| Lower lung | 30% | 59% | 0.3 | 42% | 87% | <0.0001 | |
| Consolidation | Butterfly oedema | 0% | 0% | 1 | 0% | 0% | 1 |
| Gravitational oedema | 2% | 6% | 1 | 4% | 0% | 0.6 | |
| Upper lung | 7% | 12% | 1 | 8% | 9% | 1 | |
| Middle lung | 7% | 18% | 1 | 10% | 10% | 1 | |
| Lower lung | 16% | 12% | 1 | 16% | 12% | 1 | |
Peribronchial cuffing was significantly more often present in the cardiac than in the renal and ILD groups, in 67%, 29% and 12% of patients, respectively (p = 0.04 and p <0.0001). The average thickness of the bronchi did not differ significantly between the various groups, ranging from 1.27 to 1.4 (SD 0.5–0.8) with p-values >0.9 (fig. 4).
The other cardio-pulmonary congestion signs did not differ between the cardiac and the renal groups but were significantly less in the ILD group (table 2): cardiothoracic ratio, enlargement of inferior and superior vena cava and presence of pleural effusion decreased from 0.56 to 0.50 (p <0.0001) from 25.1 to 21.3cm (p <0.0001), from 19.4 to 16.2 cm (p <0.0001) and from 76 to 6% (p <0.0001), respectively. ILD patients suffered more from ground glass opacity in the lower lobes – 87% versus 42% in the insufficiency group (p <0.0001) – although the insufficiency group presented more with gravitational ground glass opacity (14 vs 0%, p <0.0001)
Typical clinical symptoms of a pulmonary congestion are dyspnoea, tachypnoea, pleural effusion, oedema of the legs and a feeling of faintness [16]. In this situation many clinicians order a chest x-ray to check for signs of decompensation [17]. It is readily available, practical, noninvasive, low cost and provides good information about lung oedema [18]. Although CT is not routinely used in the evaluation of pulmonary congestion, the findings from conventional chest radiographs translate well to CT images. One can see the enlarged heart, the dilated superior and inferior vena cava, pleural effusion, peribronchial cuffing, ground glass opacities, consolidations and IST, which correspond to the Kerley B lines [6–9]. Additionally, other conditions causing symptoms such as dyspnoea, for example pneumonia, pulmonary embolism and tumour, can be excluded and other primary lung diseases can be detected.
In this study, more than 80% of the patients with cardiac insufficiency and more than 70% of the patients with renal insufficiency presented with IST (Kerley B lines) in the lung apex. Miniati et al. described an identical distribution of the septal lines on conventional chest x-ray in the lower lungs among patients with heart or renal insufficiency [19]. While their distribution in the insufficiency group was homogenously throughout the lungs, the amount of Kerley B lines in our study increased to 90% towards the lower lobes in the ILD group. Findings of ILD predominate in the lung bases [8]. Patients with heart or renal insufficiency showed peribronchial cuffing due to increased capillary hydrostatic pressure or decreased oncotic pressure [1, 20]. One reason for the apical prevalence of the Kerley B lines in congested patients could be the redistribution of the pulmonary blood flow into the cranial parts of the lung, probably increasing the capillary pressure with resultant transudation. Kerley B lines are not a new sign in chest radiology, but their location in the lung apex is here described for the first time.
In our cohort the cardiothoracic ratio and the diameter of the inferior vena cava were nonsignificantly larger in the cardiac group than the renal group. Several authors showed that the correlation between the cardiothoracic ratio measured on chest X-ray and CT in insufficiency were significant [21–23]. Milne et al. described an enlarged heart in patients with renal and cardiac failure (85 vs 73%) [3]. Milne mentioned a prevalence of pleural effusion of 25–50% on conventional chest X rays, whereas in our CT study three out of four insufficiency patients were shown to have a pleural effusion, probably due to better detection of smaller effusions. Milne described the gravitational oedema for cardiac insufficiency and central oedema for renal insufficiency. On CT, gravitational oedema could be demonstrated in only between 2% and 14% of the insufficiency group. Probably the result of the supine position during CT acquisition, direction of gravity and latency of cranialisation may interfere with the classification of gravity oedema.
In our cohort the best sign for differentiating pulmonary congestion seemed to be peribronchial cuffing, which was twice as prevalent with cardiac insufficiency as with renal insufficiency (p = 0.04). In CT imaging, pulmonary congestion can best be differentiated from ILD using the diameter of the vena cava, the presence of pleural effusion, peribronchial cuffing and apical Kerley B lines (each p <0.0001).
Interlobular septal thickening (Kerley B lines) in the lung apex is a pathognomonic sign for pulmonary congestion, although not exclusive for congestion since ILD may also produce apical septal thickening. In combination with peribronchial cuffing and increased cardiothoracic ratio it allows for differentiation between cardiac/renal insufficiency and ILD.
No financial support and no other potential conflict of interest relevant to this article was reported.
1Matthys H. Klinische Pneumologie. Heidelberg: Springer Medizin Verlag; 2008.
2 Starling EH . On the Absorption of Fluids from the Connective Tissue Spaces. J Physiol. 1896;19(4):312–26. doi:.https://doi.org/10.1113/jphysiol.1896.sp000596
3 Milne EN , Pistolesi M , Miniati M , Giuntini C . The radiologic distinction of cardiogenic and noncardiogenic edema. AJR Am J Roentgenol. 1985;144(5):879–94. doi:.https://doi.org/10.2214/ajr.144.5.879
4 Vergani G , Cressoni M , Crimella F , L’Acqua C , Sisillo E , Gurgitano M , et al. A Morphological and Quantitative Analysis of Lung CT Scan in Patients With Acute Respiratory Distress Syndrome and in Cardiogenic Pulmonary Edema. J Intensive Care Med. 2017:885066617743477. doi:.https://doi.org/10.1177/0885066617743477
5 Komiya K , Ishii H , Murakami J , Yamamoto H , Okada F , Satoh K , et al. Comparison of chest computed tomography features in the acute phase of cardiogenic pulmonary edema and acute respiratory distress syndrome on arrival at the emergency department. J Thorac Imaging. 2013;28(5):322–8. doi:.https://doi.org/10.1097/RTI.0b013e31828d40b2
6 Gluecker T , Capasso P , Schnyder P , Gudinchet F , Schaller MD , Revelly JP , et al. Clinical and radiologic features of pulmonary edema. Radiographics. 1999;19(6):1507–31, discussion 1532–3. doi:.https://doi.org/10.1148/radiographics.19.6.g99no211507
7Reed JC. Chest radiology, plain film patterns and differential diagnoses. Maryland Heights, Missouri: Mosby Inc; 2003.
8Elicker BM, Webb WR. Fundamentals of High-Resolution Lung CT. Philadelphia, PA: Lippincott Williams and Wilkins; 2013
9 Reuter M , Biederer J . Mustererkennung im hochauflösenden Computertomogramm (HRCT) der Lunge [Identification of lung architecture using HRCT]. Radiologe. 2009;49(2):159–72. German. doi:.https://doi.org/10.1007/s00117-008-1735-5
10 Yancy CW , Jessup M , Bozkurt B , Butler J , Casey DE, Jr , Colvin MM , et al. 2017 ACC/AHA/HFSA Focused Update of the 2013 ACCF/AHA Guideline for the Management of Heart Failure: A Report of the American College of Cardiology/American Heart Association Task Force on Clinical Practice Guidelines and the Heart Failure Society of America. J Am Coll Cardiol. 2017;70(6):776–803. doi:.https://doi.org/10.1016/j.jacc.2017.04.025
11 Levin A , Stevens PE . Summary of KDIGO 2012 CKD Guideline: behind the scenes, need for guidance, and a framework for moving forward. Kidney Int. 2014;85(1):49–61. doi:.https://doi.org/10.1038/ki.2013.444
12 Webster AC , Nagler EV , Morton RL , Masson P . Chronic Kidney Disease. Lancet. 2017;389(10075):1238–52. doi:.https://doi.org/10.1016/S0140-6736(16)32064-5
13 Wells AU . Managing diagnostic procedures in idiopathic pulmonary fibrosis. Eur Respir Rev. 2013;22(128):158–62. doi:.https://doi.org/10.1183/09059180.00001213
14 Travis WD , Costabel U , Hansell DM , King TE, Jr , Lynch DA , Nicholson AG , et al.; ATS/ERS Committee on Idiopathic Interstitial Pneumonias. An official American Thoracic Society/European Respiratory Society statement: Update of the international multidisciplinary classification of the idiopathic interstitial pneumonias. Am J Respir Crit Care Med. 2013;188(6):733–48. doi:.https://doi.org/10.1164/rccm.201308-1483ST
15 Lynch DA , Sverzellati N , Travis WD , Brown KK , Colby TV , Galvin JR , et al. Diagnostic criteria for idiopathic pulmonary fibrosis: a Fleischner Society White Paper. Lancet Respir Med. 2018;6(2):138–53. doi:.https://doi.org/10.1016/S2213-2600(17)30433-2
16Baenkler H-W, Arastéh K, Bieber C. Duale Reihe Innere Medizin. Stuttgart: Georg Thieme Verlag KG; 2009.
17 Milne EN . What is “congested” in cardiac failure? A newer approach to plain film interpretation of cardiac failure. Rays. 1997;22(1):94–106.
18 Miniati M , Pistolesi M , Milne EN , Giuntini C . Detection of lung edema. Crit Care Med. 1987;15(12):1146–55. doi:.https://doi.org/10.1097/00003246-198712000-00016
19 Miniati M , Pistolesi M , Paoletti P , Giuntini C , Lebowitz MD , Taylor AE , et al. Objective radiographic criteria to differentiate cardiac, renal, and injury lung edema. Invest Radiol. 1988;23(6):433–40. doi:.https://doi.org/10.1097/00004424-198806000-00005
20 Christe A , Vock P . Radiologische Differentialdiagnose des Lungenödems[Radiologic criteria to differentiate pulmonary edema]. Ther Umsch. 2004;61(11):665–70. In German. doi:.https://doi.org/10.1024/0040-5930.61.11.665
21 Winklhofer S , Berger N , Ruder T , Elliott M , Stolzmann P , Thali M , et al. Cardiothoracic ratio in postmortem computed tomography: reliability and threshold for the diagnosis of cardiomegaly. Forensic Sci Med Pathol. 2014;10(1):44–9. doi:.https://doi.org/10.1007/s12024-013-9504-9
22 Jotterand M , Doenz F , Grabherr S , Faouzi M , Boone S , Mangin P , et al. The cardiothoracic ratio on post-mortem computer tomography. Int J Legal Med. 2016;130(5):1309–13. doi:.https://doi.org/10.1007/s00414-016-1328-1
23 Gollub MJ , Panu N , Delaney H , Sohn M , Zheng J , Moskowitz CS , et al. Shall we report cardiomegaly at routine computed tomography of the chest? J Comput Assist Tomogr. 2012;36(1):67–71. doi:.https://doi.org/10.1097/RCT.0b013e318241e585
No financial support and no other potential conflict of interest relevant to this article was reported.