aDivision of Development and Growth, Department of Children and Adolescents, University Hospital, Geneva, Switzerland
bUniversity Hospital of Child and Adolescent Psychiatry and Psychotherapy, University of Bern, Switzerland
cMonash Institute of Cognitive and Clinical Neurosciences, Monash University, Australia
dDepartment of Neonatology, University Hospital Zurich and University of Zurich, Switzerland
eClinic of Neonatology, Department Woman-Mother-Child, University Hospital Lausanne, Switzerland
fDivision of Neonatal and Intensive care, Department of Children and Adolescents, University Hospital, Geneva, Switzerland
gChild Development Centre, University Children’s Hospital, Zurich, Switzerland
hDivision of Neuropaediatrics, Development and Rehabilitation, University Children’s Hospital, University of Bern, Switzerland
Summary
BACKGROUND
Infants born very preterm are at higher risk of long-term neurodevelopmental problems than children born at term. Although there are increasing numbers of reports on outcomes from international cohorts of premature infants, a Swiss national report on infants after 2 years of age is lacking.
AIMS OF THE STUDY
To describe neurodevelopmental outcomes at early school age of preterm children born in Switzerland with a special focus on the cognitive abilities.
METHODS
This prospective national cohort study included children born alive before 30 weeks of gestation in 2006. At 5 years of age, children underwent a neurological examination and intelligence testing with the Kaufman Assessment Battery for Children first edition (K-ABC). We assessed the mental processing composite score (MPC) and its subscales to explore specific cognitive deficits. The primary outcome was cognitive impairment (MPC score <−1 standard deviation from the normative mean), motor impairment (cerebral palsy), or sensory impairment (any visual or hearing deficiency). The need for early intervention or therapies and the association of perinatal factors with cognitive impairment were secondary and tertiary outcomes. Logistic regression models were used to analyse associations between neonatal factors and cognitive outcome.
RESULTS
Of 289 survivors, 235 were assessed. Of the 199 children with results obtained from the K-ABC, 42 (21%) showed cognitive impairment and 80 (40%) showed impairment in short-term memory. Cerebral palsy was diagnosed in 14 (6%), and visual and auditory impairment in 36 (15%) and 12 (5%) children, respectively; 63 (27%) needed early intervention or therapies. Cognitive impairment was associated with low socioeconomic status, but not with gestational age, small birthweight for gestational age, bronchodysplasia, or significant brain injury. A total of 146 children (63%) survived without any impairment.
CONCLUSION
This is the first study to report neurodevelopmental outcomes at early school age in a Swiss cohort. The majority had favourable outcomes, but 21% of children demonstrated cognitive impairment, which was most pronounced in short-term memory. Our findings were similar to those of international cohorts and indicate that preterm children born before 300/7 gestational weeks, especially those living in unfavourable social environments, are at an increased risk of cognitive impairment and need close monitoring beyond early school age.
Trial registration no
KEK-ZH-Nr.2014-0552
Abbreviations:
- VP
-
very preterm
- EP
-
extremely preterm
- GW
-
gestational weeks
- MPC
-
Mental Processing Composite
- K-ABC
-
Kaufman Assessment Battery for Children first edition
- GMFCS
-
Gross Motor Classification System
Introduction
Progress in obstetric management and neonatal intensive care has improved the survival of very preterm (VP) (gestational age <320/7 weeks), and especially of extremely preterm (EP) (gestational age <280/7 weeks) infants [1]. Recent long-term follow-up studies do not report a reduction in severe morbidity in this vulnerable population [2]. Cognitive, language and emotional or behavioural difficulties are found in around 30%, cerebral palsy in 10–15% [3] and visual or hearing impairments in 3–5% [4] of pre-schoolers born before 340/7 gestational weeks (GW). A substantial proportion (15–20%) of children born VP require physical and occupational therapy, speech and language therapy, early intervention, psychological support [5] or remedial assistance in school, which represents a significant economic burden for society and families.
In Switzerland, VP children represent 1% of the annual births (https://www.bfs.admin.ch/). A previous Swiss national cohort study demonstrated that a third of children born EP suffer from moderate to severe neurodevelopmental impairment at a corrected age of 2 years [6]. Studies have shown the limited validity of early developmental assessment (between 1 and 3 years of age) in predicting cognitive deficits at school age [7]. However, a recent study reported a good correlation between the intelligent quotient in adulthood (26 years) and the one at 4 years in VP children with persistent cognitive impairment and at 6 years of age in VP children without cognitive impairment [8]. Assessments of recent cohorts of VP children at early school age are scarce. However, a recent Dutch study showed that 50–75% of children born at <300/7 GW still have motor and/or cognitive impairment between 5 and 6 years of age [9]. Therefore, it seems important to increase our understanding of neurodevelopmental outcomes at early school age to improve prognostication. The goal is to provide early therapeutic strategies to impact positively later cognitive development and social integration.
The primary aim of our exploratory study was to describe neurodevelopmental outcome at early school age in a Swiss national cohort of children born before 300/7 GW in 2006, with a specific focus on cognitive outcomes. The second aim was to assess the number of children who received early intervention or therapies. The third aim was to investigate which perinatal factors were associated with impaired cognitive outcome.
Methods
Study population
This study is a prospective multicentre population-based cohort study. Children born alive at <300/7 GW in Switzerland between January 1 and December 31 2006 and registered in the Swiss Neonatal Network and Follow-up Group were included. Children with congenital malformations affecting neurodevelopment (complex congenital heart diseases, hiatal hernia, polymicrogyria, midline malformation syndromes, myelomeningocele) were excluded, as were children from centres that did not routinely perform standardised cognitive assessment at 5 years of age. Monitored children were examined in the participating Swiss development centres by developmental paediatricians, paediatric neurologists and developmental psychologists.
Ethics
Parents were informed during the neonatal stay that all data concerning their VP infants would be collected and registered in the national database. Data collection and evaluation were approved by the institutional ethical review board (KEK-ZH-Nr20140552) and the Swiss Federal Commission for Privacy Protection in Medical Research.
Data collection and definition of neonatal variables
Demographic, perinatal and neurodevelopmental outcome data, as well as the use of early intervention or therapies (physical therapy, occupational therapy, speech therapy, psychomotor therapy, psychological therapy) at early school age, were routinely recorded online with a secure interface protecting confidentiality and applying completeness and plausibility checks. Gestational age was based on the best estimate from early ultrasound or last menstrual period. Birth weight z-score calculations, patent ductus arteriosus, neonatal sepsis, bronchopulmonary dysplasia, necrotising enterocolitis [10], major brain injury (such as intraventricular haemorrhage grade 3 or 4 and/or cystic leukomalacia) and retinopathy of prematurity were defined as previously published for this cohort. Socioeconomic status (SES) was estimated from maternal education and paternal occupation using a validated 12-point score (range 2–12) [11], 2 being the highest socioeconomic level.
Neurodevelopmental assessment
Cognition was assessed around the children’s fifth birthday using the German, French and Italian versions of the Kaufman Assessment Battery for Children first edition (K-ABC) [12], validated in the general population and in VP children. The Mental Processing Composite (MPC) scale, considered equivalent to an intelligence quotient, is a general measure of cognitive ability and is derived from a combination of the two subscales of sequential and simultaneous processing. The sequential processing subscale primarily measures short-term memory with two subtests targeting auditory short-term memory (word order and number recall) and one subtest testing visual short-term memory (hand movements). The simultaneous processing subscale examines the abilities to solve problems related to visuospatial information: matrix analogies (logical reasoning), triangles (visuospatial processing), spatial memory and gestalt closure (visual perception).
Each scale and subscale is standardised to a mean (standard deviation [SD]) of 100 (15), and each subtest to a mean of 10 (3). If the MPC score was below 40 (the lowest score on the K-ABC), the child was assigned a score of 39. Mild cognitive impairment was defined as MPC score <−1; ≥−2 SD and moderate to severe cognitive impairment <−2 SD below the normative mean.
Each child underwent a standardised neurological examination. Cerebral palsy was defined according to the definition published by Rosenbaum et al. [13] and classified according to the guidelines of the Surveillance Group of Cerebral Palsy in Europe [14]. Gross motor function was classified according to the Gross Motor Classification System (GMFCS) [15]. We further categorised participants with cerebral palsy into community walkers (GMFCS 1–2) and non-community walkers and wheelchair-dependent (GMFCS 3–5).
Major visual impairment was defined as blindness, and minor visual impairment as the presence of squint or refractive errors. Major hearing impairment was defined as hearing loss not corrected by hearing aids, and minor impairment as hearing loss corrected with aids (40–90 dB hearing level).
Statistical analysis
Statistical analysis was performed with STATA 14 software and R (3.4.2). All demographic and developmental data are described as frequencies and percentages for categorical data and as means and standard deviations or medians and ranges, as appropriate, for continuous data. For categorical data, differences were assessed using the chi-squared test or Fisher’s exact test, as appropriate. For continuous data, the Student’s t-test or the Mann-Whitney U-test were used, as appropriate. Comparisons are presented as odds ratios [16] or mean differences, with 95% confidence intervals (CIs) and p-values. A two-tailed p-value <0.05 was considered significant for all analyses. No adjustment was made for multiple comparisons.
Univariable logistic regressions were conducted to define individual associations between neonatal factors known from the literature [6, 16–18] to influence neurodevelopmental outcome (gestational age, gender, birthweight z-score, antenatal corticosteroids, patent ductus areteriosus, necrotising enterocolitis, bronchopulmonary dysplasia, major brain injury, socioeconomic status) and cognitive impairment defined as MPC score <−1SD. Only variables with a p-value below 0.2 in the univariable setting were included in the final multivariable model; the other variables were excluded as they had no influence on the model. Results are reported as odds ratios with 95% CIs.
Results
Participants
In 2006, 73,371 infants were born alive in Switzerland. Of these, 405 were born before 300/7 GW. A flow chart of study recruitment and follow-up is shown in figure 1. We excluded two children because of a trisomy 21 and valproic acid embryopathy and 22 children because they were born in three centres that did not perform standardised cognitive assessment at 5 years of age. The mortality rate was 24% (92/381), with 36 infants dying in the delivery room, 55 in neonatal intensive care, and 1 in the first year of life. All infants born at 23 completed GW (n = 19) died in the delivery room. The proportion of infants surviving increased with gestational age from 27% at 240/7–246/7 weeks to 93% at 290/7–296/7 weeks (see supplementary table S1 in appendix 1).
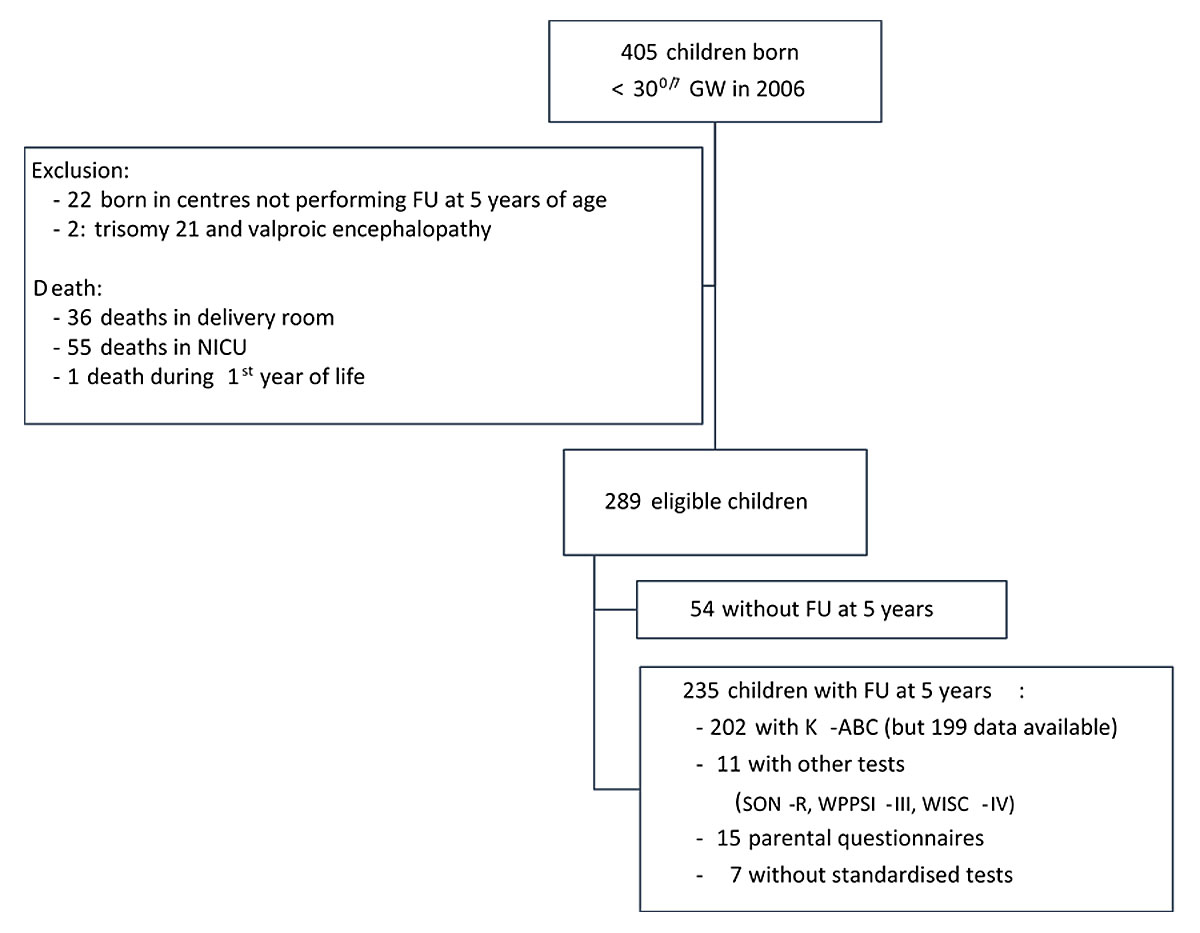
Figure 1 Study recruitment and follow-up.
GW = gestational weeks; FU = follow up; NICU = neonatal intensive care unit; K-ABC = Kaufman Assessment Battery for Children, first edition; SON-R = Snijders-Oomen non-verbal intelligence tests; WPPSI-III = Wechsler Preschool and Primary Scale of Intelligence, third edition; WISC-IV = Wechsler Intelligence Scale for Children, fourth edition.
At early school age, 289 surviving children were invited to be assessed in the Swiss 5-year follow-up programme, of whom 235 (81%) were examined; in total, 123 were born between 280/7 GW and <296/7 GW and 112 were born <280/7 GW. Reasons for non-participation included moving (n = 9, 17%), parental refusal (n = 11, 20%), age of assessment outside the targeted range of 4.5 and 6.5 years (n = 7, 13%) and loss to follow-up (n = 27, 50%). Baseline characteristics were similar between monitored (n = 235) and lost to follow-up children (n = 54; table 1) and only statistically different for twin births between monitored (n = 235) and excluded children (n = 22; table S2 in appendix 1).
Table 1 Comparison of baseline and neonatal characteristics of children with and without a follow-up at early school age.
|
Children with follow-up
(n = 235) n (%) or median (IQR) |
Children without follow-up
(n = 54) n (%) or median (IQR) |
p-value | |
|---|---|---|---|
| Antenatal steroids (completed) | 209 (89%) | 47 (87%) | 0.69 |
| Caesarean delivery | 182 (77%) | 40 (74%) | 0.09 |
| Singleton | 163 (69.3%) | 40 (74%) | 0.60 |
| Inborn | 218 (92.8%) | 50 (92.6%) | 1.00 |
| Male gender | 129 (55%) | 25 (46%) | 0.23 |
| Gestational age (weeks) | 28.1 (26.7–29) | 28.3 (26.6–29) | 0.46 |
| Birthweight z-score | −0.04 (−0.65 – +0.53) | 0.01 (−0.64 – +0.4) | 0.90 |
| Umbilical artery pH | 7.32 (7.27–7.35) | 7.31 (7.25–7.34) | 0.22 |
| PDA Surgical ligation |
90 (38%) 9 (4%) |
18 (33%) 4 (7%) |
0.50 0.27 |
| Bronchopulmonary dysplasia | 9 (4%) | 2 (3.5%) | 0.99 |
| Necrotising enterocolitis | 10 (4.3%) | 0 | 0.99 |
| Proven neonatal sepsis | 46 (19.6%) | 7 (13%) | 0.30 |
| Major brain lesions | 22 (9.3%) | 2 (3.7%) | 0.30 |
| ROP stage 3 or higher | 5 (2%) | 2 (3.5%) | 0.45 |
| Length of hospital stay (in days) | 76 (59–73) | 71.5 (55.5–90) | 0.23 |
| SES score at birth | 6 (4–8) | 6 (4–8) | 0.20 |
IQR = interquantile range; PDA = patent ductus arteriosus; ROP = retinopathy of prematurity; SES = socioeconomic status (score range 2–12; score 2 is the highest socioeconomic level, 12 the lowest socioeconomic level) p-values are from the Mann-Whitney U-test for continuous variables, and Fisher exact or chi-squared tests for categorical or binary outcomes. Proven neonatal sepsis is grouped as early- and late-onset sepsis. Major brain lesions included cystic leukomalacia and intraventricular haemorrhage grade 3 and 4.
Cognitive outcome
Of the 235 children seen for the 5-year follow-up, 202 were assessed with the K-ABC at a median age of 5.7 years (interquartile range [IQR] 5.5–6.0), of whom 199 had available scores (fig. 1). Cognitive outcomes are presented in table 2. The median (IQR) MPC score was 92 (86–101); 17.5% of the children showed mild cognitive impairment (MPC <−1; ≥−2 SD) and 3.5% moderate to severe cognitive impairment (MPC <−2 SD). The proportion infants with of cognitive impairment was higher in boys (26/107) than in girls (9/92, p = 0.009). Impairment (<−1 SD) in cognitive subdomains was found in 84 (42%) and 80 children (40%) in subtests assessing verbal short-term memory (word order and number recall, respectively), 60 children (31%) in visual short-term memory (hand movements), 61 children (31%) in logical reasoning (matrix analogies), 53 children (27%) in visuospatial processing (triangles), 45 children (23%) in spatial memory, and 23 children (12%) in visual perception (gestalt closure). Table S1 shows the cognitive outcomes by week of gestational age.
Table 2 Overview of cognitive outcomes with subtest scaled scores by sex grouped by both scales composing the Mental Processing Composite.
|
Whole cohort
n = 199 |
Boys
n = 107 |
Girls
n = 92 |
Boys versus Girls | |||
|---|---|---|---|---|---|---|
| Mean (SD) | Mean (SD) | Mean (SD) | Mean difference (95% CI) | |||
| MPC score | 92.5 (12.4) | 91.7 (1.3) | 93.5 (1.2) | −1.8 (−5.3 – +1.7) | ||
| Sequential processing | Overall | 91.9 (14) | 91.5 (14.7) | 92.4 (14) | −0.9 (−4.9 – +3.2) | |
| Word order | 7.4 (2.8) | 7.2 (2.8) | 7.7 (2.9) | −0.5 (−1.3 – +0.3) | ||
| Number recall | 7.2 (2.3) | 7.2 (2.4) | 7.2 (2.4) | 0.1 (−0.6 – +0.8) | ||
| Hand movements | 8 (2.7) | 7.9 (2.9) | 8.1 (2.6) | −0.17 (−0.95 – +0.6) | ||
| Simultaneous processing | Overall | 93.8 (15) | 92.6 (15.4) | 95.1 (14.6) | −2.5 (−6.7 – +1.7) | |
| Matrix analogies | 7.5 (2.7) | 7.4 (2.9) | 7.7 (2.6) | −0.3 (−1 – +0.5) | ||
| Triangles | 8.4 (3.2) | 8.2 (3.4) | 8.6 (3) | −0.3 (−1.25 – +0.6) | ||
| Spatial memory | 8.5 (3.2) | 8.4 (3.2) | 8.5 (3.3) | −0.6 (−1 – +1) | ||
| Gestalt closure | 10.6 (3.2) | 10.5 (3.4) | 10.8 (3) | −0.4 (−1.3 – +0.55) | ||
| n (%) | n (%) | n (%) |
Odds ratio
(95% CI) |
|||
| MPC score | <−1 SD | 42/199 (21) | 29/107 (27) | 13/92 (14) | 2.2 (1.1–4.5) | |
| <−2 SD | 7/199 (3.5) | 3/107 (2.8) | 4/92 (4.3) | 0.6 (0.14–2.85 | ||
| Sequential processing | Overall | <−1 SD | 60/199 (30.1) | 34/107 (31.8) | 26/92 (28.3) | 1.18 (0.6–2.2) |
| <−2 SD | 12 /199 (6) | 8/107 (7.5) | 4/92 (4.3) | 1.77 (0.5–6.1) | ||
| Word order | <−1 SD | 85/199 (42.7) | 56/107 (52.3) | 39/92 (42.4) | 1.4 (0.8–2.4) | |
| <−2 SD | 11/199 (5.5) | 7/107 (6.5) | 4/92 (4.3) | 1.5 (0.4–5.4) | ||
| Number recall | <−1 SD | 80/199 (40.2) | 41/107 (38.3) | 39/92 (42.4) | 0.8 (0.5–1.5) | |
| <−2 SD | 9/199 (4.5) | 5/107 (4.7) | 4/92 (4.3) | 1.1 (0.3–4.1) | ||
| Hand movements | <−1 SD | 60/199 (30.2) | 37/107 (34.6) | 23/92 (25%) | 1.5 (0.8–2.9) | |
| <−2 SD | 8/199(4) | 5/107 (4.7) | 3/92 (3.2) | 1.4 (0.3–6.1) | ||
| Simultaneous processing | Overall | <−1 SD | 51/199 (25.6) | 30/107 (30) | 21/92 (22.8) | 1.3 (0.7–2.5) |
| <−2 SD | 11/199 (5.5) | 5/107 (4.7) | 6/92 (6.5) | 0.7 (0.2–2.4) | ||
| Matrix analogies | <−1 SD | 61/199 (31) | 37/107 (35) | 24/92 (26) | 1.5 (0.8–2.8) | |
| <−2 SD | 12/199 (6) | 8/107 (7.5) | 4/92 (4) | 0.3 (0.02–2.8) | ||
| Triangles | <−1 SD | 53/199 (27) | 30/107 (28) | 23/92 (25) | 1.2 (0.6–2.2) | |
| <−2 SD | 20/199 (10) | 14/107 (13) | 6/92 (6.5) | 2.2 (0.8–5.9) | ||
| Spatial memory | <−1 SD | 45/199 (23) | 26/107 (24) | 19/92 (21) | 1.3 (0.6–2.4) | |
| <−2 SD | 14/199 (7) | 7/107 (6.5) | 7/92 (7.6) | 0.9 (0.3–2.5) | ||
| Gestalt closure | <−1 SD | 23/199 (12) | 15/107 (14) | 8/92 (9) | 1.7 (0.7–4.2) | |
| <−2 SD | 4/199 (2) | 2/107 (1.9) | 2/92 (2) | 0.85 (0.1–6.2) | ||
| CI = confidence interval; MPC = Mental Processing Composite; SD = standard deviation | ||||||
Motor and sensory outcome
Motor and sensory outcomes at a median age of 5.7 years are summarised in table 3. Cerebral palsy was present in 14 children (6%). The cerebral palsy rate was not different between children born <280/7 GW and children born between 280/7 and 296/7 GW. Seventy percent of children who developed cerebral palsy had brain lesions visible on a head ultrasound scan.
Table 3 Motor and sensory impairment at early school age by gestational age.
|
All children
240/7–296/7 GW n = 235 |
Extremely preterm children
240/7–276/7 GW n = 112 |
Very preterm children
280/7–296/7 GW n = 123 |
||||
|---|---|---|---|---|---|---|
| n (%) | n (%) | 95% CI | n (%) | 95% CI | ||
| Cerebral palsy | All | 14/235 (6) | 6/112 (5.4) | 2.4–11.5 | 8/123 (6.5) | 3.3–12.5 |
| GMFCS level 1–2* | 7/235 (3) | 4/112 (3.6) | 1.3–6.1 | 3/123 (2.4) | 0.7–7.4 | |
| GMFCS level 3–5 | 6/235 (2.5) | 2/112 (1.8) | 0.4–6.9 | 4/123 (3.3) | 1.2–8.4 | |
| Visual impairment | Minor | 35/235 (14.9) | 18/112 (16.1) | 10.3–24.2 | 17/123 (13.8) | 8.7–21.2 |
| Major | 1/235 (0.4) | 1/112 (0.9) | n.a. | 0 | n.a. | |
| Hearing impairment | Minor | 10/235 (4.3) | 5/112 (4.5) | 1.8–10.4 | 5/123 (3.9) | 1.9–9.2 |
| Major | 2/235 (0.9) | 1/112 (0.9) | n.a. | 1/123(0.8) | n.a. | |
GMFCS = Gross motor function classification system. GMFCS level 1–2: mildest form, child can walk independently; GMFCS level 3–5: child uses device or requires physical assistance to walk. * GMFCS level for one child is unknown. For all comparisons between extremely preterm children and very preterm children (p >0.05)
Visual and hearing impairments were found in 36 (15%) and 12 children (5.1%), respectively. Of these, one child was blind, two were deaf and four had both visual and hearing impairment. Visual and hearing impairments were similar in children born <280/7 GW and children born between 280/7 and 296/7 GW (25/112 [22%] and 23/123 [8%], respectively). Sex was not associated with the frequency of cerebral palsy, or visual and hearing impairments.
Early intervention and therapies
Up to the 5-year follow-up, 103/235 (44%) children had at least one intervention/therapy at some point during their early years of life. At the 5-year follow-up, 63 children (27%) still needed one or more services. Speech therapy was the most frequently prescribed service (12%), followed by occupational therapy (9%), physical therapy (6%), early intervention (6%), psychomotor therapy (4.5%) and psychological support (2.5%). Need for therapy was similar in children born <280/7 GW and those born between the 280/7 and 296/7 GW (table 4). The median socioeconomic status scores of families of children with and without the utilisation of service(s) did not differ (median 6, IQR 6–9). Boys used more services than girls (42/87 vs 21/104, p = 0.04). The mean MPC score in children still under early intervention or therapy at 5-year follow-up was 11.0 points lower than that in children who never used services at all (95% CI: −17.5 to −4.5, p <0.001). Out of the 63 children still under early intervention or therapy, 23 had at least one of three neurological morbidities, such as cerebral palsy (11 children), visual impairment (14 children, and auditory impairment (5 children).
Table 4 Early intervention and therapies at early school age by gestational age group.
|
All cohort
240/7–290/7 n = 235 |
Children born
240/7–76/7 n = 112 |
Children born
280/7–296/7 n = 123 |
p-value | |
|---|---|---|---|---|
| Any therapies/early intervention* | 63/235 (27%) | 33/112 (29.5%) | 30/123 (24.4%) | |
| One therapy | 13/235 (5.5%) | 7/112 (6.3%) | 6/123 (4.9%) | 0.4 |
| Multiple therapies | 50/235 (21.3%) | 26/112 (23.2%) | 24/123 (19.5%) | 0.84 |
| Physiotherapy | 14/235 (6%) | 8/112 (7.1%) | 6/123 (4.9%) | 0.58 |
| Occupational therapy | 21/235 (8.9%) | 11/112 (9.8%) | 10/123 (8.1%) | 0.65 |
| Speech therapy | 29/235 (12.3%) | 15/112 (13.4%) | 14/123 (11.4%) | 0.64 |
| Early intervention* | 14/235 (6%) | 7/112 (6.3%) | 7/123 (5.7%) | 1 |
| Psychomotor therapy | 10/235 (4.3%) | 6/112 (5.4%) | 4/123 (3.3%) | 0.52 |
| Child psychology or psychiatry | 6/235 (2.6%) | 2/112 (1.8%) | 4/123 (3.3%) | 0.7 |
Values are numbers (percentage); p-values are from Fisher exact test for ratios * Early intervention is a weekly stimulation at home by a therapist with the aim to promote the cognitive development and to support the parent in their educative role.
Risk factors for cognitive impairment and need for early intervention or therapies
Univariable analyses showed that the risk of having cognitive impairment was higher for boys, children with major brain lesions and for children living in families with low socioeconomic status. In the multivariable model, the single strongest predictor for cognitive impairment was a low socioeconomic status score (adjusted OR 1.2, 95% CI 1.06–1.4; table 5).
Table 5 Factors associated with an impaired cognitive outcome defined as a MPC score <−1SD at early school age.
| Univariable | Multivariable | |||
|---|---|---|---|---|
| OR (95% CI) | p-value | OR (95% CI) | p-value | |
| Born extremely preterm*
(240/7–276/7 GW) |
0.9 (0.7–1.1) | 0.30 | ||
| Birthweight z-score | 1.4 (0.9–2.2) | 0.11 | 0.64 (0.4-1) | 0.051 |
| Multiple gestation | 1.9 (0.9–3.8) | 0.09 | 0.57 (0.05-4.22) | 0.67 |
| Male gender | 2.3 (1.1–4.7) | 0.03 | 2.1 (0.95-6.6) | 0.06 |
| Patent ductus arteriosus | 0.76 (0.4–1.5) | 0.40 | ||
| Antenatal corticosteroids (completed) | 1.04 (0.4–3) | 0.90 | ||
| Necrotising enterocolitis | 0.46 (0.2–1.3) | 0.10 | 0.2 (0.02–1.8) | 0.15 |
| Neonatal sepsis | 1.5 (0.7–3.3) | 0.30 | ||
| Bronchopulmonary dysplasia | 1.5 (0.3–8.1) | 0.60 | ||
| Major brain lesions | 2.9 (1–8.2) | 0.04 | 2.3 (0.7–7.7) | 0.15 |
| Socioeconomic status† | 3.9 (1.4–10.6) | 0.007 | 1.2 (1.06-1.4) | 0.009 |
MPC = Mental Processing Composite; CI = confidence interval; OR = odds ratio * Compared with infants born very preterm (280/7–296/7) † Analysed as a continuous variable
In the multivariable model, any current use of a service at 5-year follow-up was associated with male sex (adjusted OR 2.0, 95% CI 1.0–3.9), major brain lesions (adjusted OR 2.7, 96% CI 1.3–5.7), and lower socioeconomic status score (adjusted OR 2.7, 95% CI 1.3–4.9).
Discussion
This prospective national cohort study showed that the majority of children born <30 GW in Switzerland in 2006 had a favourable cognitive, motor and sensory outcome at early school age. Although they had cognitive scores in the lower normal range on average, a fifth of the children demonstrated cognitive impairment and subtest analyses showed that impairment was greatest in short-term memory. Whereas at least 40% of the children had used educational health services at some time point during the past, only a quarter of them still attended one or more services at the time of the 5-year follow-up assessment. Lower socioeconomic status was the only factor associated with cognitive impairment in our study population.
In this study, neonatal mortality depended strongly on gestational age and was slightly lower for EP infants than reported in other international cohorts [2, 19].
Compared to the K-ABC norms, our study population showed cognitive scores in the lower normal range. These results are not surprising, as group means of cognitive performance in VP children have been shown to be one half to two thirds of a standard deviation below the group means of term -born children [20]. Our results are in line with a recent meta-analysis [21] that included 44 case-control studies using different IQ measures in 4- to 17-year-old children born VP, in the period from 1980 to 2009. The meta-analysis showed a 12-point difference in IQ (0.8 SD) for preterm children in comparison to their term-born peers. This corresponds to a mean performance within the normal range, but group means do not necessarily reflect the heterogeneity within the group. In our study, the subscore analysis of cognitive outcomes revealed that a large proportion of the children born before 300/7 GW (40%) showed low performance in two subtests of verbal short-term memory and visual short-term memory (31%). Deficits in all memory domains have been reported in VP children, with VP children being 2–3 times more likely to have memory impairments than term-born control children [22]. Considerable difficulties in visual short-term memory, visuospatial and visual processing, logical reasoning and spatial memory have been reported in school-age VP children [23]. Our results are in line with the current literature on cognitive difficulties in VP children and highlight the need for early detection and adequate support.
The prevalence of cerebral palsy in our population (6%) was comparable to that described in literature rendered for the same gestational age and period of time [24]. Comparison of our rates of visual and hearing impairment with those of other cohorts is difficult, because different definitions were used. However, our rate of major visual impairment (0.4%) was similar to the blindness rate at 5 years of age reported in the EPIPAGE Cohort Study (0.7%) in children born 240/7–296/7 GW [25].
As in previous studies, we found that the socioeconomic level of the family was associated with impaired cognitive outcome during early schooling. A recent systematic review based on 12 studies explored the predictive factors of cognitive development at the age of 5–13 years in children born before 330/7 GW and identified the level of parental education as a prognostic factor for cognitive outcome, whereas younger gestational age and parental income/occupation had little prognostic value [26].
The current study found the proportion of children under any form of intervention or therapy at early school age (27%) slightly lower than that reported in a Dutch study (40% of 64 children born <300/7 GW) [27] and in the EPIPAGE cohort (36% of 922 children born <310/7 GW). In our study, only major brain lesions and lower socioeconomic status score were associated with use of therapies at a median age of 5.7 years. Out of the children undergoing one or several interventions or therapies at that age, only 36.5% had neurological morbidities, such as cerebral palsy, visual impairment or auditory impairment. Although a few randomised controlled studies have assessed the efficiency of early interventions over the first year of life in infants without neurosensory impairments [28], the need for therapies can be considered a good indirect indicator for the existence of developmental difficulties in children born VP and should encourage further diagnostic investigations to provide them with more specific educational support.
This study has several clinical implications. VP children, including those with no apparent morbidities, should have neuropsychological follow-up in order to monitor cognitive problems. Preterm children living in unfavourable social circumstances are particularly vulnerable. The combination of VP birth and low parental socioeconomic status creates a situation in which children are exposed to a combination of biological and environmental risk factors that may impact their cognitive development.
A first limitation of our study was the sample size (n = 235) eligible for the 5-year follow-up assessment, which corresponds to a rate of 80%. Sackett et al. suggested that a dropout rate of more than 20% poses a serious threat to validity [29]. However, neonatal baseline characteristics and social background did not differ between participants and nonparticipants, meaning that the sample examined might be considered as representative for the whole cohort. A second limitation was the exclusion of 22 children without access to national 5-year follow-up. Monitored children might have been at a higher risk of poor cognitive outcomes than children born in a centre where follow-up was not performed routinely. Therefore, there is a possible slight underestimation of cognitive outcomes in our cohort. A third limitation is the absence of a control group of children born at term. For this reason, we relied on test norms as a baseline in the estimate of the level of cognitive functioning of the study children. As the sociodemographic characteristics of the VP children assessed in this study are likely to differ from the standardisation sample, we might have underestimated the rates of impairment in our Swiss cohort. Fourth, while we report cognitive findings at the subtest level, it is important to note that the subtests are part of the K-ABC test battery, which is designed to measure general cognitive ability. These measures can provide additional information about the nature of cognitive difficulties, but specialised neuropsychological measures are necessary for detecting specific cognitive weakness.
Conclusion
This is the first study to provide an overview of the cognitive and neurological outcomes at an early school age for children born <300/7 GW in Switzerland. Compared to larger, well-known international cohort studies, our results revealed similar cognitive, motor and sensory outcomes. We found that one fifth of children showed cognitive impairments, and two fifths showed poor short-term memory. VP children often need one or several interventions or therapies, even when they are not diagnosed with severe neurodevelopmental impairment. Our findings highlight the need to offer long-term neuropsychological follow up in children born <300/7 GW, in particular children from socially disadvantaged families.
Appendix 1 Supplementary tables
Table S1 Mortality and cognitive outcome at early school age according to gestational age.
| Death | Median MPC (IQR) |
MPC
85
(−1SD) |
MPC 84-70
(<−1; −2SD) |
MPC<70
(<−2SD) |
||||||
|---|---|---|---|---|---|---|---|---|---|---|
| Whole cohort | 92/381 (24.1%) | 92 (86–101) | 157/199 (79%) | 35/199 (18.5%) | 7/199 (3.5%) | |||||
| Gestational age (weeks) | EP | 82/217 (37.8%) | 93 (87–101) | 78/95 (82,1%) | 15/95 (15.8%) | 2/95 (2.1%) | ||||
| VP | 10/164 (6.1%) | 92 (85–101) | 79/104 (76%) | 20/104 (19.2%) | 5/104 (4.8%) | |||||
| p-value | < 0.001 | 0.27 | 0.30 | 0.50 | 0.45 | |||||
| Completed weeks | 23 | 19/19 (100%) | ||||||||
| 24 | 24/33 (73%) | 89 (78–99) | 5/7 (71%) | 1/7 (14%) | 1/7 (14%)) | |||||
| 25 | 13/38 (34%) | 96 (91–107) | 19/21 (90%) | 2/21 (10%) | - | |||||
| 26 | 17/58 (29%) | 92 (87–101) | 26/30 (87%) | 4/30 (13%) | - | |||||
| 27 | 9/69 (13%) | 93.5 (86–101) | 42/51 (82%) | 8/51 (16%) | 1/51 (2%) | |||||
| 28 | 4/77 (5%) | 92 (84–101) | 46/59 (78%) | 11/59 (19%) | 2/59 (3%) | |||||
| 29 | 6/87 (6.9%) | 91 (85–101) | 52/64 (81%) | 9/64 (14%) | 3/64 (5%) | |||||
EP = extremely preterm infants (born between 240/7 and 276/7 gestational weeks);MPC = Mental Processing Composite; IQR = interquantile range; SD = standard deviation; VP = very preterm infants (born between 280/7 and 296/7 gestational weeks) p-values are from by t-tests for continuous variables, from Fisher exact or chi-squared tests for categorical or binary outcomes.
Table S2 Comparison of baseline and neonatal characteristics of children with a follow-up at early school age and children excluded due to the lack of access to the national follow-up program at 5 years of age.
|
Children with follow-up
(n = 235) n (%) or median (IQR) |
Excluded children
(n = 22) n (%) or median (IQR) |
p-value | |
|---|---|---|---|
| Antenatal steroids (completed) | 209 (89%) | 19 (86%) | 0.72 |
| Caesarean delivery | 182 (77%) | 16 (73%) | 0.61 |
| Singleton | 163 (69.3%) | 22 (100%) | 0.001 |
| Inborn | 218 (92.8%) | 22 (100%) | 0.2 |
| Male gender | 129 (55%) | 14 (63%) | 0.5 |
| Gestational age (weeks) | 28.1 (26.7–29) | 28.3 (26.6–29.1) | 0.92 |
| Birthweight z-score | −0.04 (−0.65–+0.53) | 0.29 (−0.32–+0.4) | 0.61 |
| Umbilical artery pH | 7.32 (7.27–7.35) | 7.22 (7.16–7.22) | 0.96 |
| PDA with surgical ligation | 9 (4%) | 0 | 0.99 |
| Bronchopulmonary dysplasia | 9 (4%) | 0 | 0.99 |
| Necrotising enterocolitis | 10 (4.3%) | 0 | 0.99 |
| Proven neonatal sepsis | 46 (19.6%) | 3 (13%) | 0.77 |
| Major brain lesions | 22 (9.3%) | 3 (13.6%) | 0.45 |
| ROP stage 3 or higher | 5 (2%) | 0 | 0.99 |
| Length of hospital stay (in days) | 76 (59–73) | 86 (65–100) | 0.4 |
| SES score at birth | 6 (4–8) | 6 (5–7) | 0.20 |
IQR = interquantile range; PDA = patent ductus arteriosus; ROP = retinopathy of prematurity; SES = socioeconomic status (score range 2–12; score 2 is the highest socioeconomic level, 12 the lowest socioeconomic level). p-values are from the Mann-Whitney U-test for continuous variables, and Fisher exact or chi-squared tests for categorical or binary outcomes. Proven neonatal sepsis is cactegorised into early- and late-onset sepsis. Major brain lesions included cystic leukomalacia and intraventricular haemorrhage grade 3 and 4.
Acknowledgments
We thank all of the current and past study group members, paediatricians and psychologists. We would also like to thank the following units for collaborating in the SwissNeoNet – Aarau: Cantonal Hospital Aarau, Children's Clinic, Department of Neonatology (P Meyer, C Anderegg), Department of Neuropaediatrics (A Capone Mori, D Kaeppeli); Basel: University Children's Hospital Basel, Department of Neonatology (S Schulzke), Department of Neuropaediatrics and Developmental Medicine (P Weber); Bellinzona: San Giovanni Hospital, Department of Paediatrics (GP Ramelli, B Simonetti Goeggel); Bern: University Hospital Bern, Department of Neonatology (M Nelle), Department of Paediatrics (B Wagner), Department of Neuropaediatrics (M Steinlin, S Grunt); Biel: Development and Paediatric Neurorehabilitation Centre (R Hassink); Chur: Children's Hospital Chur, Department of Neonatology (T Riedel), Department of Neuropaediatrics (E Keller, C Killer); Fribourg: Cantonal Hospital Fribourg, Department of Neuropaediatrics (K Fuhrer); Lausanne: University Hospital (CHUV), Department of Neonatology (J-F Tolsa, M Roth-Kleiner), Department of Child Development (M Bickle-Graz); Geneva: Department of Child and Adolescent, University Hospital, Neonatology Units (RE Pfister), Division of Development and Growth (PS Huppi, C Borradori-Tolsa); Lucerne: Children's Hospital of Lucerne, Neonatal and Paediatric Intensive Care Unit (M Stocker), Department of Neuropaediatrics (T Schmitt-Mechelke, F Bauder); Lugano: Regional Hospital Lugano, Department of Paediatrics (V Pezzoli); Muensterlingen: Cantonal Hospital Muensterlingen, Department of Paediatrics (B Erkert, A Mueller); Neuchâtel: Cantonal Hospital Neuchâtel, Department of Paediatrics (M Ecoffey); St Gallen: Cantonal Hospital St Gallen, Department of Neonatology (A Malzacher), Children's Hospital St Gallen, Neonatal and Paediatric Intensive Care Unit (JP Micallef), Department of Child Development (A Lang-Dullenkopf); Winterthur: Cantonal Hospital Winterthur, Department of Neonatology (L Hegi), Social Paediatrics Centre (M von Rhein); Zurich: University Hospital Zurich (USZ), Department of Neonatology (D Bassler, R Arlettaz), University Children's Hospital Zurich, Department of Neonatology (V Bernet) and Child Development Centre (B Latal, G Natalucci).
Notes
Giancarlo Natalucci was supported by the Swiss National Science Foundation (grant: PZOOP3_161146).
Mark Adams receives a salary as network coordinator for the Swiss Neonatal Network and Follow-up Group.No other potential conflict of interest relevant to this article was reported.
References
1 Chen F , Bajwa NM , Rimensberger PC , Posfay-Barbe KM , Pfister RE ; Swiss Neonatal Network. Thirteen-year mortality and morbidity in preterm infants in Switzerland. Arch Dis Child Fetal Neonatal Ed. 2016;101(5):F377–83. doi:.https://doi.org/10.1136/archdischild-2015-308579
2 Cheong JLY , Anderson PJ , Burnett AC , Roberts G , Davis N , Hickey L , et al.; Victorian Infant Collaborative Study Group. Changing Neurodevelopment at 8 Years in Children Born Extremely Preterm Since the 1990s. Pediatrics. 2017;139(6):e20164086. doi:.https://doi.org/10.1542/peds.2016-4086
3 Woodward LJ , Moor S , Hood KM , Champion PR , Foster-Cohen S , Inder TE , et al. Very preterm children show impairments across multiple neurodevelopmental domains by age 4 years. Arch Dis Child Fetal Neonatal Ed. 2009;94(5):339–44. doi:.https://doi.org/10.1136/adc.2008.146282
4 Ancel PY , Goffinet F , Kuhn P , Langer B , Matis J , Hernandorena X , et al.; EPIPAGE-2 Writing Group. Survival and morbidity of preterm children born at 22 through 34 weeks’ gestation in France in 2011: results of the EPIPAGE-2 cohort study. JAMA Pediatr. 2015;169(3):230–8. doi:.https://doi.org/10.1001/jamapediatrics.2014.3351
5 Johnson S , Hennessy E , Smith R , Trikic R , Wolke D , Marlow N . Academic attainment and special educational needs in extremely preterm children at 11 years of age: the EPICure study. Arch Dis Child Fetal Neonatal Ed. 2009;94(4):F283–9. doi:.https://doi.org/10.1136/adc.2008.152793
6 Schlapbach LJ , Adams M , Proietti E , Aebischer M , Grunt S , Borradori-Tolsa C , et al.; Swiss Neonatal Network & Follow-up Group. Outcome at two years of age in a Swiss national cohort of extremely preterm infants born between 2000 and 2008. BMC Pediatr. 2012;12(1):198. doi:.https://doi.org/10.1186/1471-2431-12-198
7 Wong HS , Santhakumaran S , Cowan FM , Modi N ; for Medicines for Neonates Investigator Group. Developmental Assessments in Preterm Children: A Metaanalysis. Pediatrics. 2016;138:2. doi:. https://doi.org/10.1542/peds.2016-0251
8 Breeman LD , Jaekel J , Baumann N , Bartmann P , Wolke D . Preterm Cognitive function into adulthood. Pediatrics. 2015;136(3):415–23. doi:.https://doi.org/10.1542/peds.2015-0608
9 van Noort-van der Spek IL , Franken MC , Weisglas-Kuperus N . Language functions in preterm-born children: a systematic review and meta-analysis. Pediatrics. 2012;129(4):745–54. doi:.https://doi.org/10.1542/peds.2011-1728
10 Bodeau-Livinec F , Zeitlin J , Blondel B , Arnaud C , Fresson J , Burguet A , et al.; Etude Epidemiologique sur les Petits Ages Gestationnels (EPIPAGE) group. Do very preterm twins and singletons differ in their neurodevelopment at 5 years of age? Arch Dis Child Fetal Neonatal Ed. 2013;98(6):F480–7. doi:.https://doi.org/10.1136/archdischild-2013-303737
11 Largo RH , Pfister D , Molinari L , Kundu S , Lipp A , Due G . Significance of prenatal, perinatal and postnatal factors in the development of AGA preterm infants at five to seven years. Dev Med Child Neurol. 1989;31(4):440–56. doi:.https://doi.org/10.1111/j.1469-8749.1989.tb04022.x
12Kaufman AKN. Kaufmann assessment battery for children. Minnesota: Circle Pines; 1983.
13 Rosenbaum P , Paneth N , Leviton A , Goldstein M , Bax M , Damiano D , et al. A report: the definition and classification of cerebral palsy April 2006. Dev Med Child Neurol Suppl. 2007;109:8–14.
14 McManus V , Guillem P , Surman G , Cans C . SCPE work, standardization and definition--an overview of the activities of SCPE: a collaboration of European CP registers. Zhongguo Dang Dai Er Ke Za Zhi. 2006;8(4):261–5.
15 Palisano RJ , Rosenbaum P , Bartlett D , Livingston MH . Content validity of the expanded and revised Gross Motor Function Classification System. Dev Med Child Neurol. 2008;50(10):744–50. doi:.https://doi.org/10.1111/j.1469-8749.2008.03089.x
16 Borenstein-Levin L , Synnes A , Grunau RE , Miller SP , Yoon EW , Shah PS ; Canadian Neonatal Network Investigators. Narcotics and sedative use in preterm neonates. J Pediatr. 2017;180:92–98.e1. doi:.https://doi.org/10.1016/j.jpeds.2016.08.031
17 Profit J , Kowalkowski MA , Zupancic JA , Pietz K , Richardson P , Draper D , et al. Baby-MONITOR: a composite indicator of NICU quality. Pediatrics. 2014;134(1):74–82. doi:.https://doi.org/10.1542/peds.2013-3552
18 Saldeño YP , Favareto V , Mirpuri J . Prolonged persistent patent ductus arteriosus: potential perdurable anomalies in premature infants. J Perinatol. 2012;32(12):953–8. doi:.https://doi.org/10.1038/jp.2012.31
19 Draper ES , Manktelow BN , Cuttini M , Maier RF , Fenton AC , Van Reempts P , et al.; EPICE Cohort. Variability in very preterm stillbirth and in-hospital mortality across Europe. Pediatrics. 2017;139(4):e20161990. doi:.https://doi.org/10.1542/peds.2016-1990
20 Larroque B , Ancel PY , Marret S , Marchand L , André M , Arnaud C , et al.; EPIPAGE Study group. Neurodevelopmental disabilities and special care of 5-year-old children born before 33 weeks of gestation (the EPIPAGE study): a longitudinal cohort study. Lancet. 2008;371(9615):813–20. doi:.https://doi.org/10.1016/S0140-6736(08)60380-3
21 Brydges CR , Landes JK , Reid CL , Campbell C , French N , Anderson M . Cognitive outcomes in children and adolescents born very preterm: a meta-analysis. Dev Med Child Neurol. 2018;60(5):452–68. doi:.https://doi.org/10.1111/dmcn.13685
22 Omizzolo C , Scratch SE , Stargatt R , Kidokoro H , Thompson DK , Lee KJ , et al. Neonatal brain abnormalities and memory and learning outcomes at 7 years in children born very preterm. Memory. 2014;22(6):605–15. doi:.https://doi.org/10.1080/09658211.2013.809765
23 Anderson PJ . Neuropsychological outcomes of children born very preterm. Semin Fetal Neonatal Med. 2014;19(2):90–6. doi:.https://doi.org/10.1016/j.siny.2013.11.012
24 Vincer MJ , Allen AC , Allen VM , Baskett TF , O’Connell CM . Trends in the prevalence of cerebral palsy among very preterm infants (<31 weeks’ gestational age). Paediatr Child Health. 2014;19(4):185–9. doi:.https://doi.org/10.1093/pch/19.4.185
25 Marret S , Marchand-Martin L , Picaud JC , Hascoët JM , Arnaud C , Rozé JC , et al.; for the EPIPAGE Study Group. Brain injury in very preterm children and neurosensory and cognitive disabilities during childhood: the EPIPAGE cohort study. PLoS One. 2013;8(5):e62683. doi:.https://doi.org/10.1371/journal.pone.0062683
26 Linsell L , Malouf R , Morris J , Kurinczuk JJ , Marlow N . Prognostic Factors for poor cognitive development in children born very preterm or with very low birth weight: a systematic review. JAMA Pediatr. 2015;169(12):1162–72. doi:.https://doi.org/10.1001/jamapediatrics.2015.2175
27 van Veen S , Aarnoudse-Moens CSH , Oosterlaan J , van Sonderen L , de Haan TR , van Kaam AH , et al. Very preterm born children at early school age: Healthcare therapies and educational provisions. Early Hum Dev. 2018;117:39–43. doi:.https://doi.org/10.1016/j.earlhumdev.2017.12.010
28 Spencer-Smith MM , Spittle AJ , Doyle LW , Lee KJ , Lorefice L , Suetin A , et al. Long-term benefits of home-based preventive care for preterm infants: a randomized trial. Pediatrics. 2012;130(6):1094–101. doi:.https://doi.org/10.1542/peds.2012-0426
29 Sackett DL . Evidence-based medicine. Semin Perinatol. 1997;21(1):3–5. doi:.https://doi.org/10.1016/S0146-0005(97)80013-4
Notes
Giancarlo Natalucci was supported by the Swiss National Science Foundation (grant: PZOOP3_161146).
Mark Adams receives a salary as network coordinator for the Swiss Neonatal Network and Follow-up Group.No other potential conflict of interest relevant to this article was reported.