Use of day and night urinary iodine excretion to estimate the prevalence of inadequate iodine intakes via the estimated average requirement cut-point method
DOI: https://doi.org/10.4414/smw.2019.20090
Elizabeth
Staldera, Max
Haldimanna, Annabelle
Blanca, Vincent
Dudlera, Belen
Ponteb, Menno
Pruijmc, Daniel
Ackermannd, Murielle
Bochude
aFederal Food Safety and Veterinary Office, Risk Assessment Division, Bern, Switzerland
bDepartment of Nephrology, Hôpitaux Universitaires de Genève (HUG), Geneva, Switzerland
cDepartment of Nephrology and Hypertension, Centre Hospitalier Universitaire Vaudois (CHUV), Lausanne, Switzerland
dDepartment for Nephrology and Hypertension, Inselspital, Bern University Hospital, University of Bern, Switzerland
eInstitute of Social and Preventive Medicine (IUMSP), University of Lausanne, Switzerland
Summary
The objectives were to determine urinary iodine concentration (UIC) in day and night samples collected over a 24-hour period and evaluate the usual dietary iodine intake distribution from this collection. We propose a method by which the prevalence of inadequacy can be calculated from a single 24-hour collection, reducing the burden on participants and the study costs.
The samples from 1128 participants were collected between 2009 and 2013 within the framework of the Swiss Kidney Project on Genes observational cohort study; 1024 samples were suitable for statistical evaluation of iodine analysis. Participants were over 18, resident in Switzerland and of European ancestry. Over 24 hours, urine was collected as night-time (bedtime until and including first morning urine) and day-time (the remainder) samples. Associations with variables, in particular to estimated glomerular filtration rate (eGFR), were investigated using mixed models.
The 24-hour median UICs were 73 and 96 µg/l for women (n = 542) and men (n = 482), respectively; 24-hour median intakes (derived from the corresponding excretion) were 127 and 156 µg/d, respectively. Day and night excretions were normalised to 24-hour excretion values and the usual intake distribution calculated by the US National Cancer Institute method. The Estimated Average Requirement cut-point method was used to calculate the prevalence of inadequacy, estimated at 14% for women and 4% for men; above the target of 2-3%.
We conclude that segregating 24-hour urine into day and night collections is sufficient to determine the prevalence of iodine inadequacy in the population and reduces the burden on participants by sparing a second 24-hour collection. No association between iodine intake and eGFR was found.
Introduction
Iodine is the heaviest, stable, naturally occurring halogen. It is also the least abundant, with 70% occurring in ocean sediments [1] and only low concentrations in soils. A key step in the iodine cycle is volatilisation from the oceanic “reservoir” into the atmosphere [2]. Deposition of iodine occurs mainly in coastal regions via sea spray and precipitation [2]. For regions whose water supply originates from spring and ground water, drinking water can be an important source of iodine for the population [3]. This is not the case for Switzerland [4], a land-locked country, known historically for its prevalence of iodine deficiency [5].
Of all foodstuffs, iodine is found in highest concentrations in seafood and seaweeds [6], with bread, eggs and dairy products also being important sources. The mean iodine concentration in fruits, vegetables, grains and meat is extremely low owing to the limited uptake of iodine by plants [2], although there are moves to increase the iodine level of crops in some countries [7]. The iodine content of dairy products results from several factors; food supplements (causing a seasonal variation [8], note the recommendation to lower maximum permitted iodine content of animal feed [9]), teat dipping and processing [10]; organic (lower) vs traditional methods [11–13]. Bread is the largest source of iodine in the Swiss diet [5], due to iodised salt added before the baking process. Overall, 87% of Swiss bakeries use iodised salt [14]. Indeed, iodised salt was used to bring iodine deficiency under control in Switzerland. Following a drive to lower the salt consumption of the Swiss population [15], measures were taken to stabilise the consumption of iodine by increasing the iodine concentration in table salt from 20 to 25 ppm [16]. Since table salt is estimated to make up only 11% of consumption (75% from processed foods [17]), it is encouraged that industrial products contain iodised salt. With the majority of iodine-containing foods being animal based, vegans in particular should ensure they have neither a deficient nor an excessive iodine intake [18]. A recent nationwide survey [19] suggested that 0.4% of the Swiss population follows a vegan diet, with a higher incidence among women (0.52%) than men (0.21%) [20]. Other, non-nutritive, sources of iodine are disinfectants and medication.
Iodine is classified as an essential micronutrient and is found corporeally almost entirely in the thyroid gland [21], in the thyroid hormones triiodothyronine (T3) and thyroxine (T4). An estimated 15–20 mg is present in the body in total [22]. Thyroid hormones are required for the growth and development of most organs, including the brain. A lack of maternal iodine during pregnancy can lead to irreversible cognitive impairment or even miscarriage, and a lack of iodine as a young child can lead to mental impairment and a lower than expected intelligence quotient [23]. Follow-on effects are a reduced mental capacity affecting home, school and work life. Iodothyronine deiodinase is a family of enzymes containing the amino acid selenocysteine. It plays an important role in the transformation of T4 into T3 and protection of the thyroid from damage by peroxide. Therefore adequacy of both selenium and iodine may be interrelated [24]. The selenium status of the Swiss population is currently adequate [25].
The WHO recommends a daily intake of iodine of 150 µg for anyone over the age of 12, and 200 µg for pregnant and lactating women [26]. Although urinary iodine concentration (UIC) is considered the most practical biochemical marker for iodine nutrition [26], it provides only a snapshot of iodine excretion at the time of measurement. Median values of 100–199 µg/l are considered to be adequate and to represent a population with no iodine deficiency. The populations of 54 countries are currently considered iodine deficient [27]. UIC above 300 µg/l is considered excessive [26] and the tolerable upper intake level is set at 1100 µg per day [28]. EFSA advise the same adequate intake value as the WHO [29]. For children and adults over the age of 14, the Institute of Medicine (US) Panel on Micronutrients specify a recommended dietary allowance of 150 µg/d and an estimated average requirement (EAR) of 95 µg/d, valid for both sexes [30]. The EAR cut-point method allows estimation of the prevalence of inadequate intakes calculated as the proportion of the population with intakes below the EAR [31]. The Swiss Federal Food Safety and Veterinary Office recommendations are in line with those of the WHO [32].
In a healthy adult, 92% of ingested iodine is filtered out by the kidneys and excreted in urine [33], making 24-hour urine collections the reference standard for iodine intake assessment, albeit often impractical to implement. It is also representative of the total daily intake, an advantage over the use of food frequency questionnaires. Excretion occurs 4–5 hours after ingestion and an equilibrium between intake and excretion is expected to be established, with most being excreted within a day [34]. The estimated glomerular filtration rate (eGFR) is used as a measure of kidney health and function. Als et al. have shown iodine excretion to be subject to a diurnal variation [35], suggesting that timing of spot urine samples should be taken into account with a morning fasting spot sample avoided [34, 36]. Although at first sight this seems in contrast to the study by Perrine et al., who found that the timing did not affect assessment of intake [37], in the latter study, samples were grouped together by time period rather than treated as individual spot samples.
The primary aim of the current study was to explore whether or not the prevalence of iodine inadequacy in the population can be calculated from a single 24-hour urine collection, if this collection is segregated into night-time and day-time periods. Secondly, the study aimed to identify potential associations between iodine intake/excretion and factors such as eGFR. The relevant data were collected within the framework of the population based Swiss Kidney Project on Genes in Hypertension (SKIPOGH).
Methods
SKIPOGH is a family-based cohort of the Swiss population in the regions of Bern, Geneva and the city of Lausanne in the Canton of Vaud. The primary aim of the project is to explore the role of genes in blood pressure regulation and kidney function; secondarily, it is a biomonitoring survey. In brief, the baseline examination took place between December 2009 and March 2013. Using different strategies, a random sample of adults from the three aforementioned regions of Switzerland were drawn. Four requirements had to be met: (i) age at least 18 years, (ii) European ancestry, (iii) at least one first degree family member also willing to participate, and (iv) provision of written, informed consent. Pregnant or breastfeeding women were not included. The general participation rate was 25.6% [38]. A more detailed description of the methods can be found elsewhere [39, 40].
The SKIPOGH study was conducted according to the guidelines laid down in the Declaration of Helsinki (2008) of the World Medical Association and all procedures involving human subjects were approved by the Ethics Committees of each participating university hospital: Human Research Ethics Committee, Lausanne University Hospital and University of Lausanne (Lausanne, Switzerland); the Ethics Committee for the Research on Human Beings, Geneva University Hospitals (Geneva, Switzerland), and the Ethics Committee of the Canton of Bern, (Bern, Switzerland); CER-VD: 92/07; CER-GE: 09-089; CER-BE: 091/09; amendment for urinary iodine: CER-VD: 303/12. Written informed consent was obtained from all subjects.
Participants attended hospital after an overnight fast (water and medication permitted). Body weight, to the nearest 100 g, was measured in kg (electronic scales, Seca, Germany) and height in cm, to the nearest 0.5 cm (height gauge, Seca, Germany). Body mass index (BMI) was calculated by dividing weight (kg) by height squared (m2). Fasting venous blood samples and a 24-hour urine sample were collected, from which electrolytes, kidney function and blood glucose were measured using standard clinical laboratory methods [41]. Creatinine was measured using IDMS-traceable methods [42] and eGFR was calculated according to the CKD-EPI creatinine equation developed by the Chronic Kidney Disease Epidemiology Collaboration [43].
Urine was collected separately for day and night, covering a 24-hour period. Each of the 1128 participants determined what constituted night-time (bedtime up to and including the first urine of the morning) and day-time (the remainder). The study adopted this choice, rather than a time limit, in order to explore the circadian rhythm of blood pressure [44]. Please note that in this paper we classify the time of collection as: night-time – collection from when the participant went to bed and including the first urine of the morning; day-time – collection during the remainder of the 24 hour period; not be confused with 24-hour UIE which is the total of the two; night-time:24-hour normalised – normalisation of the night time collection to 24-hours by a scaling factor calculated from reported sleeping and waking times, and day-time:24-hour normalised calculated from the corresponding waking hours of the participant.
Urine samples were judged for incompleteness by criteria applied in similar studies: creatinine <0.6 mmol/d and volume <1000 ml; creatinine <5.0 mmol/d [45]. Cases were also rejected if participants self-reported incompleteness of urine sample collection, if they were taking iodine-containing medication or if basic data were missing.
UICs were measured with an isotope dilution, inductively coupled plasma-mass spectrometry method as described elsewhere [46]. A urine quality control sample (NIST SRM 2670a, certified iodine content 88.2 [standard deviation 1.1] µg/l; National Institute of Standards and Technology, Gaithersburg, MD, USA) was included in every run. Blank solutions were routinely prepared and tested in order to monitor potential iodine cross-contamination from the urine samples. The mean limit of observed values was 88.4 (SD 0.73) µg/l (n = 129) for the certified reference material. Creatinine was measured with the Jaffe kinetic-compensated method. Calcium and sodium were measured by means of flame photometry (IL-943, Instrumentation Laboratory, Milano, Italy). Selenium was measured with ICP-MS as described elsewhere [47].
Statistical analysis
Systat 13.0 statistical software (Systat, Chicago, IL, USA) was used for data analysis and, with Excel, graphics generation. Continuous variables are described as either mean and standard deviation if data followed the normal distribution, or median, and 25th and 75th percentiles for non-normally distributed data. Sample acquirement is split evenly over the four seasons, therefore this was not taken into account as a weighting factor when calculating mean and median values [48, 49]. Categorical variables are described as numbers and percentages. Mann-Whitney tests, t-tests or chi-square tests were used as appropriate in order to compare groups. Pearson tests were carried out to ascertain correlations of continuous variables. A p value of less than 0.05 was considered to be significant in all tests (p <0.05).
Determination of associated factors
Twenty four-hour urinary iodine excretion (UIE) was used as a proxy for intake and the general linear model (GLM) procedure was run to identify the explanatory variables. After loss of data due to list-wise deletion of participants with missing data, general linear mixed effects models were pursued. Mixed models analysis allows missing data as long as it is missing at random and the inclusion of all data points of the dependent variable despite incomplete data points across the explanatory variables [50]. Initially, sex, season of urine sample, daily vegetable consumption, weekly meat and fish consumption, smoking status and canton of residence (categorical independent variables) were taken as fixed factors. Fixed covariates (continuous, observed variables) were set to be age, BMI, plasma selenium, eGFR and 24-hour urinary selenium, calcium and sodium excretions. Variables with highest p-values were eliminated in turn and Bayesian information criterion (BIC) and Akaike information criterion (AIC) values compared. The fits of the best models were evaluated graphically, by assessment of normality of the residuals and by plotting the standardised residuals against predicted iodine values; the model with the lowest BIC and AIC values was selected.
Risk of inadequacy
In order to estimate the prevalence of inadequacy of iodine intake in the Swiss population, the EAR cut-point method proposed by Beaton was used [51]. An intake equal to the EAR value (95 µg/d for iodine) will by definition satisfy the needs of 50% of people within the criteria of the group; thus the proportion below this value estimates the percentage of the population at risk of inadequacy. Three assumptions are made: (i) intakes and requirements are independent, (ii) the requirement distribution is symmetrical around the EAR and (iii) the variance of intakes is larger than the variance of requirements [52]. If these assumptions are satisfied, only the EAR and the distribution of usual intakes are required to determine inadequacy.
The usual intake distribution was estimated from the observed intake distribution by adjusting for and partially removing the intra-individual variance [52]. The National Cancer Institute (NCI), US, has developed a model to estimate the usual dietary intakes of foods and nutrients based on repeat daily intakes [53]. To this end, the NCI macros Mixtran and Distrib [54] were run in the statistical software package Statistical Analysis Systems version 9.4 (SAS Institute, Cary, NC, USA). In order to obtain the usual intake distributions via the NCI method, at least two intakes must be available for some of the individuals in the group [53]. Day-time and night-time UIE was normalised to a 24-hour excretion using a time scaling factor based on the duration of urine collection in minutes [37], (excretion/reported duration)*1440, so providing replicate intakes for each case to be used for the adjustment. Stratification by age was not necessary since the statistical analysis showed age not to be a significant variable.
The usual iodine intake distributions were estimated using the NCI method for males and females; both the full contingent and the subset of women of reproductive age, typically aged 15–49, Note: age of consent for this study is 18). Since age was not significant in the explanation of the model, only the results for the full contingent are reported in detail here.
Results
From an initial study size of 1128 participants, samples were rejected because of: incomplete iodine data (n = 79); incomplete volume data (n = 1); excessive intakes, UIE >590 µg/d, not resulting from food (n = 17, range 593–15946 µg/d); creatinine <0.6 mmol/d and volume <1000 ml (n = 3); and creatinine <5.0 mmol/d (n = 4) [45]. This left a sample size of 1024 available for statistical analysis.
The main characteristics of the study population (542 women, 482 men) aged 18–90 years old are described in table 1. The distribution of the 24-hour UIE data for all 1024 participants is unimodal and skewed, lognormal (A = 0.328, n = 1024, p >0.15). A difference between the 24-hour excretion of men vs women is apparent, with medians of 144 and 117 µg/d, respectively (U = 92126, nM = 482, nF = 542, p <0.001), as depicted in figure 1. The 1024 participants provided both a night-time and day-time urine sample. Observed night-time iodine excretion is lower than day-time (fig. 1), as expected because of a lower volume of urine production over the shorter night-time period. A weak correlation was seen between the day- and night-time samples, with correlation coefficients of 0.375 (p <0.01) and 0.316 (p <0.01) for women and men, respectively. The distribution of UIC can be seen in figure 2.
Table 1 Descriptive statistics of the sample population.
|
Variable
|
Women
|
Men
|
Total
|
| |
|
n
|
|
|
n
|
|
|
n
|
| Mean age (SD), years |
48 |
(17.0) |
542 |
47 |
(17.8) |
482 |
47 |
(17.4) |
1024 |
| Mean BMI (SD), kgm-2
|
24.2 |
(4.7) |
542 |
26.0 |
(4.2) |
482 |
25.0 |
(4.5) |
1023 |
| Median urine volume (*), ml |
Day |
1100 |
(759; 1520) |
542 |
1000 |
(700; 1500) |
482 |
1093 |
(710; 1500) |
1024 |
| Night |
487 |
(300; 700) |
542 |
449 |
(300; 639) |
482 |
465 |
(300; 679) |
1024 |
| 24-hour |
1627 |
(1200; 2200) |
542 |
1524 |
(1100; 2100) |
482 |
1582 |
(1119; 2148) |
1024 |
| Smoking status, n (%) |
Current |
111 |
(20) |
|
130 |
(27) |
|
242 |
(24) |
|
| Ex |
155 |
(29) |
|
161 |
(34) |
|
322 |
(31) |
|
| Never |
276 |
(51) |
|
179 |
(37) |
|
459 |
(49) |
|
| Canton, n (%) |
BE |
127 |
(23) |
|
115 |
(24) |
|
242 |
(24) |
|
| GE |
209 |
(39) |
|
203 |
(42) |
|
412 |
(40) |
|
| VD |
206 |
(38) |
|
163 |
(34) |
|
366 |
(36) |
|
| Season, n (%) |
Spring |
128 |
(25) |
|
101 |
(21) |
|
231 |
(23) |
|
| Summer |
126 |
(25) |
|
137 |
(28) |
|
262 |
(26) |
|
| Autumn |
115 |
(23) |
|
97 |
(20) |
|
213 |
(21) |
|
| Winter |
139 |
(27) |
|
109 |
(23) |
|
243 |
(24) |
|
| Mean eGFR (SD), ml/min/1.73m2
|
94.99 |
(17.0) |
539 |
98.08 |
(18.5) |
477 |
96.42 |
(17.8) |
1012 |
| Mean selenium plasma (SD), ng |
117.21 |
(20.4) |
486 |
115.1 |
(19.4) |
426 |
116.2 |
(20.0) |
908 |
| Median urinary selenium excretion (*), ng |
Day |
15.25 |
(11.89; 20.49) |
526 |
20.25 |
(15.42; 25.50) |
465 |
17.70 |
(13.04; 22.97) |
991 |
| Night |
8.72 |
(6.54; 11.14) |
490 |
10.80 |
(8.40; 13.86) |
444 |
9.69 |
(7.30; 12.69) |
934 |
| 24-hour |
23.05 |
(17.82; 30.12) |
541 |
30.60 |
(24.07; 37.57) |
480 |
26.83 |
(19.80; 34.07) |
1021 |
| Median urinary calcium excretion (*), mmol |
Day |
2.41 |
(1.19; 4.19) |
529 |
2.58 |
(1.26; 4.92) |
475 |
2.51 |
(1.22; 4.41) |
1004 |
| Night |
0.50 |
(0.21; 0.99) |
531 |
0.61 |
(0.27; 1.20 |
477 |
0.55 |
(0.24; 1.08) |
1008 |
| 24-hour |
3.15 |
(1.76; 5.11) |
533 |
3.34 |
(1.85; 6.00) |
477 |
3.24 |
(1.79; 5.38) |
1010 |
| Median urinary sodium excretion (*), mmol |
Day |
80.43 |
(57.28; 107.58) |
542 |
104.43 |
(75.43; 136.00) |
482 |
91.48 |
(63.93; 122.48) |
1024 |
| Night |
34.28 |
(23.53; 49.05) |
539 |
45.00 |
(29.45; 62.68) |
481 |
38.28 |
(25.30; 56.29) |
1020 |
| 24-hour |
116.54 |
(88.52; 151.29) |
542 |
154.96 |
(120.45; 195.86) |
482 |
134.49 |
(99.22; 174.68) |
1024 |
| Median urinary iodine concentration (*), µg/l |
Day |
70.8 |
(48.1; 105.5) |
542 |
91.2 |
(63.7; 134.7) |
482 |
79.4 |
(54.0; 120.2) |
1024 |
| Night |
84.7 |
(57.5; 134.2) |
542 |
112.9 |
(68.8; 164.6$9 |
482 |
97.6 |
(62.2; 150.8) |
1024 |
| 24-hour |
72.8 |
(53.0; 106.9) |
542 |
96.2 |
(67.9; 136.2) |
482 |
82.7 |
(58.1; 121.2) |
1024 |
| Median urinary iodine excretion (*), µg |
Day |
76.67 |
(57.20; 102.17) |
542 |
91.14 |
(69.96; 125.81) |
482 |
82.43 |
(6313; 113.09) |
1024 |
| Night |
38.63 |
(28.59; 54.17) |
542 |
48.69 |
(34.89; 66.00) |
482 |
43.55 |
(31.11; 59.53) |
1024 |
| 24-hour |
117.23 |
(91.98; 152.83) |
542 |
143.93 |
(112.78; 187.10) |
482 |
128.64 |
(100.25; 170.95 |
1024 |
| Median daily iodine intake (*), µg |
127.42
|
(99.98; 166.12) |
|
156.45
|
(122.59; 203.37) |
|
139.83
|
(108.97; 185.82) |
|
BE =Bern; eGFR = estimated glomerular filtration rate; GE = Geneva; SD = standard deviation; VD = Vaud
* denotes (25th percentile; 75th percentile) |
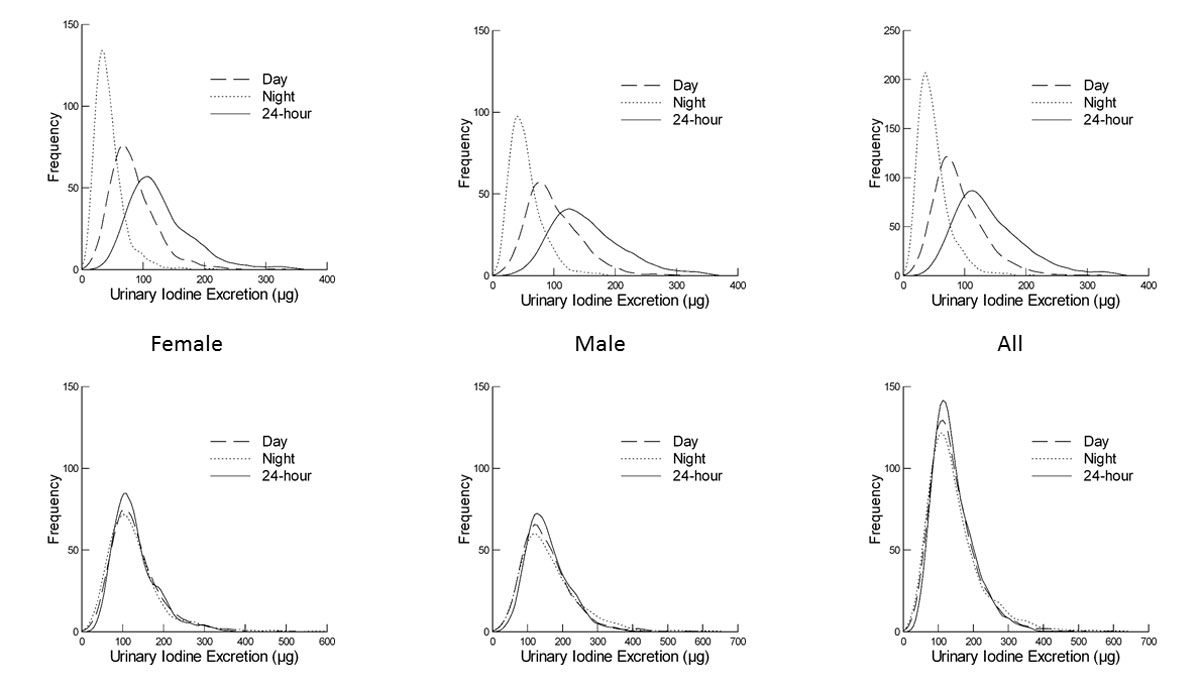
Figure 1 Comparison of measured urinary iodine excretion (UIE) vs day-time:24-hour and night-time:24-hour normalised UIE. Top row: measured day-time, night-time and 24-hour UIEs for the female (left), male (centre) and entire (right) study population. Bottom row: distributions of day-time:24-hour normalised, night-time:24-hour normalised excretions together with the measured 24-hour excretion for female, male and entire study population.
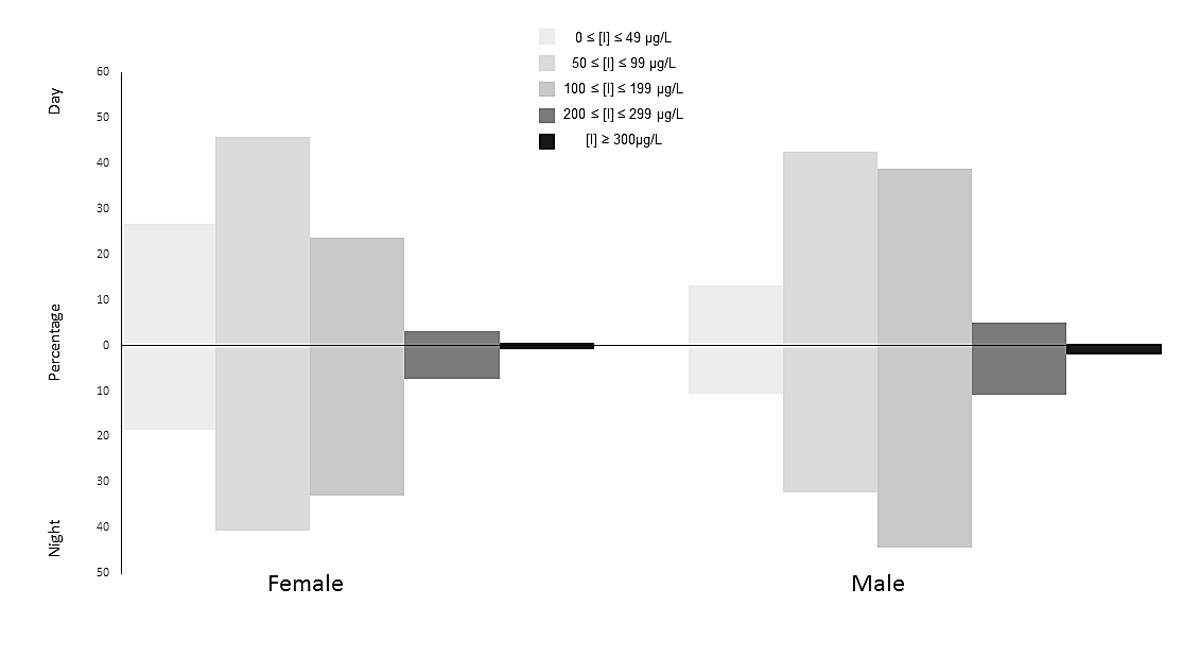
Figure 2 Distribution of urinary iodine concentrations (UICs) for day and night samples in the categories of the WHO criteria.
Factors associated with 24-hour UIE
Elimination of variables with the highest significance in turn did not lower the AIC and BIC values. The fit of the best model was evaluated graphically, by assessment of normality of the residuals and by plotting the standardised residuals against predicted iodine values. Estimates of the best model (chosen from lowest AIC and BIC) can be seen in table 2. Variables that were significantly, positively associated with iodine excretion are male sex, winter season and 24-hour urinary calcium, selenium and sodium excretions. Age, BMI, eGFR, smoking status and region did not appear to be associated. Of the foodstuffs, fish appeared to be the least associated.
Table 2 Parameter estimates of the best model (LMM, fixed effects) describing the variables that influence the urinary iodine excretion, (a proxy for intake, related by a factor of 0.92).
|
Effect
|
Estimate
|
Standard error
|
F-Ratio
|
p-Value
|
| Intercept |
46.445 |
28.911 |
|
0.109 |
| Sex |
|
|
6.629 |
0.010 |
| |
Female |
−9.451 |
3.67 |
|
0.010 |
| Male |
0 |
0 |
|
. |
| Age |
0.132 |
0.147 |
0.8 |
0.371 |
| BMI |
0.923 |
0.41 |
4.508 |
0.034 |
| Season of urine sample |
|
|
3.03 |
0.029 |
| |
Autumn |
−9.583 |
4.761 |
|
0.039 |
| Spring |
−3.084 |
4.71 |
|
0.392 |
| Summer |
−11.788 |
4.533 |
|
0.006 |
| Winter |
0 |
0 |
|
. |
| Daily vegetable portions |
|
|
2.231 |
0.064 |
| |
0 |
−10.123 |
16.97 |
|
0.551 |
| 1 |
−31.495 |
13.011 |
|
0.016 |
| 2 |
−29.956 |
12.425 |
|
0.016 |
| 3 |
−30.462 |
12.657 |
|
0.016 |
| 4 |
0 |
0 |
|
. |
| Weekly meat portions |
|
|
1.035 |
0.388 |
| |
A (0–3) |
0.425 |
5.425 |
|
0.938 |
| B (4) |
−0.37 |
5.419 |
|
0.946 |
| C (5) |
−7.471 |
5.563 |
|
0.180 |
| D (6) |
2.421 |
5.787 |
|
0.676 |
| E (7,8) |
0 |
0 |
|
. |
| Weekly fish portions |
|
|
0.55 |
0.699 |
| |
A (0) |
7.9 |
9.967 |
|
0.428 |
| B (1) |
3.98 |
7.346 |
|
0.588 |
| C (2) |
7.989 |
7.041 |
|
0.257 |
| D (3) |
8.178 |
7.475 |
|
0.274 |
| E (4+) |
0 |
0 |
|
. |
| Plasma selenium (ng) |
0.193 |
0.092 |
4.443 |
0.035 |
| Urinary selenium excretion (µg/d) |
0.719 |
0.127 |
32.149 |
<0.001 |
| Urinary calcium excretion (mmol/d) |
1.954 |
0.525 |
13.855 |
<0.001 |
| Urinary sodium excretion (mmol/d) |
0.347 |
0.033 |
111.658 |
<0.001 |
| Estimated GFR (CKD_EPI) |
0.054 |
0.144 |
0.143 |
0.706 |
| Smoking status |
|
|
1.243 |
0.289 |
| |
Current |
−4.378 |
4.219 |
|
0.300 |
| Ex |
−5.755 |
3.901 |
|
0.141 |
| Never |
0 |
0 |
|
. |
| Canton |
|
|
1.57 |
0.209 |
| |
Bern |
2.788 |
4.666 |
|
0.550 |
| Geneva |
−4.67 |
4.023 |
|
0.246 |
| Vaud |
0 |
0 |
|
. |
AIC = Akaike information criterion; BIC = Bayesian information criterion; GFR = glomerular filtration rate
Fit statistics: AIC 8537, BIC 8541 |
EAR Groups
The usual intake distributions shown in figure 3 were calculated using day-time 24-hour normalised values with night-time 24-hour normalised intakes as a repeated measure. As can be seen from the graphs, there is a difference between the distributions for females and males. The prevalence of inadequacy, in other words, the percentage of population below the EAR of 95µg, is estimated to be 14% for women (13% for women of reproductive age) and 4% for men.

Figure 3 Application of US National Cancer Institute method to estimate the usual iodine intake distribution for all women and all men in the study population. Cut-off lines are drawn to indicate the estimated average requirement (EAR; 95 µg/d) for both female and male and the top 5% of the intake distribution (268 and 237 µg/d for females and males, respectively); the tolerable upper intake level is 1100 µg/d.
Discussion
The WHO recommends a daily intake of 150 µg of iodine for adults and the median estimated iodine intake of 140 µg/d (127 and 157 µg/d for women and men, respectively) is below this level. It is also lower than the intake of 148 µg/d reported in 2014 in a study size of 1420 participants by Haldimann et al. [46]. König et al. reported intakes of 104 and 98 µg/d (calculated from spot UIC) in a sample of 22 women in Zurich, Switzerland, aged 52–77 years [55]. On the basis of the day and night UIC as large spot samples, the population of Switzerland would be classed under the WHO criteria as mildly iodine deficient (fig. 2), because the median concentrations (UICDAY = 79; UICNIGHT = 98) fall between 50 and 99 µg/l. The wide ranges of urine volumes, 100–410 0ml and 67–2800ml for day- and night-time, respectively) suggest that dilution effects should be considered when interpreting such data [56].
Inadequacy according to the EAR cut-point method
A more accurate description of iodine intake inadequacy in a population can be obtained by calculating the percentage of samples below the EAR threshold [57]. In this Swiss sample, the estimated prevalence of inadequate intake was 4% for men and 14% for women. This latter value is above the target range of 2–3% [28, 58] and an especial cause of concern since “during pregnancy, there are critical developmental windows in which iodine deficiency may lead to irreversible, adverse brain effects that cannot be overcome by later iodine sufficiency” [48]. Note that SKIPOGH samples were collected before the increase in iodine supplementation of dietary salt from 20–25 ppm, which took place on 1 January 2014. It will be of interest to explore the impact of this policy measure in future studies.
These results are independently validated by those of the Swiss Salt Survey [46], in which repeat 24-hour urine samples were collected and which returned an inadequacy prevalence of 14% for women and 2% for men, after adjustment, although it should be noted that the studies were not carried out on the same participants. We propose that, instead of a second 24-hour collection, segregation into day and night collections is sufficient to estimate the prevalence of iodine inadequacy by the EAR cut-point method. Iodine is excreted around 4–5 hours after ingestion [35, 59]; thus, by separating urine collection into day-time and night-time samples as determined by the participant, we are in effect separating the iodine ingested during the morning and early afternoon from that ingested during the late afternoon and evening. Essentially, this provides two measurements of dietary intake in a way that is both more cost effective and less time consuming for the participants. We found that correcting the day and night UIEs to 24-hour excretions leads to a reasonable approximation of the measured 24-hour excretion (fig. 1). Perrine et al. [37] have previously shown no consistent variation between excretions calculated from four spot samples taken at different times. However, in this SKIPOGH study, the timing of the samples was subject to the participants’ body clocks and not collected according to a chronological timetable.
Since people tend to vary what they eat both during the day and from day to day, the iodine content of food and thus intake of subsequent days can have a large variation, potentially larger than the variation between individuals of the sample population. In order to account for this, repeat samples for some of the population are required. Care should be taken if data are collected on consecutive days, as food choice on the first day can influence food choice of the following days [52]. However, this is of less concern for samples collected within 24 hours, since people rarely eat the same for breakfast, midday and evening meals. Nevertheless, carry-over effects cannot be ruled out.
Factors associated with 24-hour UIE
In contrast to the data (unpublished results) obtained from the Swiss Salt Survey (SSS) [46], associations between iodine intake and eGFR (p = 0.706), smoking status (p = 0.289), or region (p = 0.209) were not significant. The higher mean iodine for men than for women is expected since men have a higher salt consumption than women [60] owing to the tendency to a larger body weight (t = −20.139, nF = 538, nM = 481, p <0.001) and therefore higher overall food consumption. Urinary sodium excretion (proxy for salt intake) showed similar values to those of the SSS study [46] (mean 3.25 g/d and median of 3.09 g/d, vs meansss = 3.4 3g/d and mediansss = 3.66 g/d). Likewise, calcium excretion was similar, with the studies showing a mean = 0.17 vs meansss = 0.16 and median = 0.13 vs mediansss = 0.15 g/d. The significant positive association of 24-hour urinary calcium excretion with iodine excretion potentially reflects the contribution of dairy products to iodine intake. The positive association with the winter season can be explained by a difference in diet between the winter and summer months, as well as the documented seasonal variation of iodine in dairy products [61].
Urinary selenium excretion showed a positive significant association with iodine intake. A deficiency in selenium and resulting reduction of deiodinase activity would lead to a decrease in UIE [62]. An association caused by this should be visible only in the presence of severe selenium deficiency, which was not the case in this study. A positive association between selenium and iodine intake could arise from selenium levels in foodstuffs containing both, such as dairy products and bread (grains and seeds). Fish shows less association with iodine intake than meat and vegetables. This discrepancy can be explained by the nature of the food survey questionnaire. Both fruit and vegetables were recorded on the basis of a daily recall, whereas meat and fish were recorded as weekly consumption. A recorded higher weekly fish consumption does not necessarily imply that fish was consumed on the day of, or prior to, the urine sample. The relation of UIE with reported meat and vegetable consumption should be treated with circumspection, being more likely attributable to preparation methods (use of iodised salt, dairy products) rather than any inherent iodine content of the food.
Inclusion of the family group as a random effect did not bring any significant modification to the fit of the model. On closer inspection of the data, there are family clusters (a prerequisite of participation), but many do not live together. Since all of the participants must be over 18 to participate, one would expect children to neither live with their parents nor follow the same diet throughout the day.
No association between region and iodine intake was found; however, extrapolating this result to the whole of Switzerland would not be justified. Switzerland has three main language regions, with differing cultures, including nutritive cultures. The SKIPOGH study concentrates on western Switzerland; the cantons of Geneva and Vaud are both French language regions and the canton of Bern is on the border between the French- and German-speaking areas. The Italian region, and northern and eastern (German and Romansch language) regions were not sampled. Comparing to the previous SSS study, where region was significantly associated with iodine intake and the study encompassed all language regions, we notice that both Geneva and Vaud had very similar estimates of effects [46]. In the SSS study, Bern was not surveyed. It is therefore not surprising that the results of the SKIPOGH study showed no association with region.
Conclusions
Based on the day and night urine collected from this sample population between 2009 and 2013, the Swiss adult population is classified as mildly iodine deficient according to the WHO. No association between iodine intake and eGFR was found. A higher than desirable prevalence of inadequate iodine intake calculated according to the EAR cut-point method was shown for women. Drives to lower salt intake have been countered by an increase of the iodine content of iodised salt in recent years, with the intent to ensure a sufficient supply to the Swiss population. Further studies are necessary to monitor the effects of these two related issues. We propose that a separate collection of day-time and night-time urine, as determined by the habits and daily rhythm of the individual participant, is a more cost effective and efficient way of collecting 24-hour urine samples to estimate the prevalence of iodine inadequacy than repeated 24-hour collections.
Acknowledgements
We are grateful to the SKIPOGH-1 study participants, investigators (Michel Burnier, Olivier Devuyst, Pierre-Yves Martin, Fred Paccaud and Bruno Vogt) and MD fellows (Daniel Ackermann, Georg Ehret, Idris Guessous, Belen Ponte and Menno Pruijm). We thank the study nurses Marie-Odile Levy, Guler Gök-Sogüt, Ulla Schüpbach and Dominique Siminski for their involvement and help with SKIPOGH recruitment. We acknowledge Sebastien Lenglet, Aurélien Thomas, and Marc Augsburger of the Unit of Toxicology, CURML, CHUV-HUG, for the measurement of selenium in the SKIPOGH cohort. We also thank Sandrine Estoppey and Dusan Petrovic for their help in logistic and database management.
Author contributions
Study design and data collection: A.B., M.H., V.D., B.P., M.P., D.A., M.B. Data analysis and manuscript: E.S., M.H. Final manuscript approved by all authors.
References
1
Muramatsu
Y
,
Hans Wedepohl
K
. The distribution of iodine in the earth’s crust. Chem Geol. 1998;147(3–4):201–16. doi:.https://doi.org/10.1016/S0009-2541(98)00013-8
2
Fuge
R
,
Johnson
CC
. Iodine and human health, the role of environmental geochemistry and diet, a review. Appl Geochem. 2015;63(Supplement C):282–302. doi:.https://doi.org/10.1016/j.apgeochem.2015.09.013
3
Voutchkova
DD
,
Ernstsen
V
,
Kristiansen
SM
,
Hansen
B
. Iodine in major Danish aquifers. Environ Earth Sci. 2017;76(13):447. doi:.https://doi.org/10.1007/s12665-017-6775-6
4European Geoscience for Society. Geochemistry of European Bottled Water. Stuttgart, Germany: Borntraeger Science Publishers; 2010.
5Federal Commission for Nutrition. Iodine supply in Switzerland: Current Status and Recommendations. Expert report of the FCN. Zurich: Federal Office of Public Health 2013.
6
Haldimann
M
,
Alt
A
,
Blanc
A
,
Blondeau
K
. Iodine content of food groups. J Food Compos Anal. 2005;18(6):461–71. doi:.https://doi.org/10.1016/j.jfca.2004.06.003
7
Green
H
,
Broun
P
,
Cakmak
I
,
Condon
L
,
Fedoroff
N
,
Gonzalez-Valero
J
, et al.
Planting seeds for the future of food. J Sci Food Agric. 2016;96(5):1409–14. doi:.https://doi.org/10.1002/jsfa.7554
8
Walther
B
,
Wechsler
D
,
Schlegel
P
,
Haldimann
M
. Iodine in Swiss milk depending on production (conventional versus organic) and on processing (raw versus UHT) and the contribution of milk to the human iodine supply. J Trace Elem Med Biol. 2018;46:138–43. doi:.https://doi.org/10.1016/j.jtemb.2017.12.004
9EFSA Panel on Additives and Products or Substances used in Animal Feed (FEEDAP). Scientific Opinion on the safety and efficacy of iodine compounds (E2) as feed additives for all animal species: calcium iodate anhydrous, based on a dossier submitted by Calibre Europe SPRL/BVBA. Parma, Italy 2014 May 19.
10
Flachowsky
G
,
Franke
K
,
Meyer
U
,
Leiterer
M
,
Schöne
F
. Influencing factors on iodine content of cow milk. Eur J Nutr. 2014;53(2):351–65. doi:.https://doi.org/10.1007/s00394-013-0597-4
11
Bath
SC
,
Button
S
,
Rayman
MP
. Iodine concentration of organic and conventional milk: implications for iodine intake. Br J Nutr. 2012;107(7):935–40. doi:.https://doi.org/10.1017/S0007114511003059
12
Dahl
L
,
Opsahl
JA
,
Meltzer
HM
,
Julshamn
K
. Iodine concentration in Norwegian milk and dairy products. Br J Nutr. 2003;90(3):679–85. doi:.https://doi.org/10.1079/BJN2003921
13
Bath
SC
,
Rayman
MP
. Trace element concentration in organic and conventional milk: what are the nutritional implications of the recently reported differences?
Br J Nutr. 2016;116(1):3–6. doi:. Correction in: Br J Nuutr. 2016;116(11):1997. doi:https://doi.org/10.1017/S0007114516004049https://doi.org/10.1017/S0007114516001616
14Stalder U, Haldimann M. Brotmonitoring des BLV 2014: Salzgehalt in gewerblich hergestelltem Brot. Bern, Switzerland: Federal Food Safety and Veterinary Office 2015.
15Bundesamt für Gesundheit BAG. Salz Strategie 2013-2016: Strategiepapier zur Reduktion des Kochsalzkonsums [Salt Strategy 2013 - 2016: Strategy paper for reducing salt consumption]. 2013. Available at: https://extranet.who.int/nutrition/gina/sites/default/files/CHE%202013-2016%20Salz%20Strategie%202013-2016.pdf
16Bundesamt für Gesundheit BAG. Massnahmen zur Jodversorgung in der Schweiz. 2013
17Zülli S. Reduktion des Salzkonsums: Reduktion des Salzgehalts in verarbeiteten Lebensmitteln. Zollikofen, Schweiz: Schweizerische Hochschule für Landwirtschaft, Bundesamt für Gesundheit 2011.
18Lightowler HJ. Assessment of Iodine Intake and Iodine Status in Vegans. In: Preedy VR, Burrow GN, Watson R, editors. Comprehensive Handbook of Iodine. New York: Elsevier; 2009. p. 429 - 36.
19Switzerland - National Nutrition Survey menuCH 2014-2015. In: Institut universitaire de médecine sociale et préventive (IUMSP). Swiss Federal Food Safety and Veterinary Office (FSVO)- Available at: https://menuch.iumsp.ch/index.php/catalog/4
20Federal Commission for Nutrition (FCN). Vegan diets: Review of nutritional benefits and drawbacks. Bern: Federal Food Safety and Veterinary Office 2017.
21
Levander
OA
,
Whanger
PD
. Deliberations and evaluations of the approaches, endpoints and paradigms for selenium and iodine dietary recommendations. J Nutr. 1996;126(9, Suppl_9):2427S–34S. doi:.https://doi.org/10.1093/jn/126.suppl_9.2427S
22Iodine Deficiency in Europe. A continuing public health problem. Geneva: WHO, Unicef; 2007.
23
Bougma
K
,
Aboud
FE
,
Harding
KB
,
Marquis
GS
. Iodine and mental development of children 5 years old and under: a systematic review and meta-analysis. Nutrients. 2013;5(4):1384–416. doi:.https://doi.org/10.3390/nu5041384
24
Thomson
CD
,
McLachlan
SK
,
Grant
AM
,
Paterson
E
,
Lillico
AJ
. The effect of selenium on thyroid status in a population with marginal selenium and iodine status. Br J Nutr. 2005;94(6):962–8. doi:.https://doi.org/10.1079/BJN20051564
25
Burri
J
,
Haldimann
M
,
Dudler
V
. Selenium status of the Swiss population: assessment and change over a decade. J Trace Elem Med Biol. 2008;22(2):112–9. doi:.https://doi.org/10.1016/j.jtemb.2007.11.002
26World Health Organization. UNICEF, ICCIDD. Assessment of iodine deficiency disorders and monitoring their elimination: a guide for programme managers. Geneva: World Health Organization; 2007.
27World Health Organization. Micronutrient deficiencies: Iodine Deficiency Disorders. 2018 [cited 2018 Jan 24, 2018]; Available from: http://www.who.int/nutrition/topics/idd/en/.
28Guidelines on food fortification with micronutrients. Allen LH, de Benoist B, Dary O, Hurrell R, Organization WH, editors. Geneva: World Health Organization, Food and Agricultural Organization of the United Nations; 2006.
29EFSA (European Food Safety Authority). Dietary reference values for nutrients: Summary report. Parma, Italy: European Food Safety Authority; 2017.
30Iodine. Dietary Reference Intakes for Vitamin A, Vitamin K, Arsenic, Boron, Chromium, Copper, Iodine, Iron, Manganese, Molybdenum, Nickel, Silicon, Vanadium, and Zinc. Washington (DC): National Academies Press (US); 2001. p. 258-89.
31
Carriquiry
AL
. Assessing the prevalence of nutrient inadequacy. Public Health Nutr. 1999;2(1):23–34. doi:.https://doi.org/10.1017/S1368980099000038
32Lebensmittel und Ernährung. Empfehlungen zu Jod. Bern: Bundesamt für Lebensmittelsicherheit und Veterinärwesen (BLV); 2014.
33
Nath
SK
,
Moinier
B
,
Thuillier
F
,
Rongier
M
,
Desjeux
JF
. Urinary excretion of iodide and fluoride from supplemented food grade salt. Int J Vitam Nutr Res. 1992;62(1):66–72.
34
Rasmussen
LB
,
Ovesen
L
,
Christiansen
E
. Day-to-day and within-day variation in urinary iodine excretion. Eur J Clin Nutr. 1999;53(5):401–7. doi:.https://doi.org/10.1038/sj.ejcn.1600762
35
Als
C
,
Helbling
A
,
Peter
K
,
Haldimann
M
,
Zimmerli
B
,
Gerber
H
. Urinary iodine concentration follows a circadian rhythm: a study with 3023 spot urine samples in adults and children. J Clin Endocrinol Metab. 2000;85(4):1367–9. doi:.https://doi.org/10.1210/jc.85.4.1367
36
Soldin
OP
. Controversies in urinary iodine determinations. Clin Biochem. 2002;35(8):575–9. doi:.https://doi.org/10.1016/S0009-9120(02)00406-X
37
Perrine
CG
,
Cogswell
ME
,
Swanson
CA
,
Sullivan
KM
,
Chen
TC
,
Carriquiry
AL
, et al.
Comparison of population iodine estimates from 24-hour urine and timed-spot urine samples. Thyroid. 2014;24(4):748–57. doi:.https://doi.org/10.1089/thy.2013.0404
38
Ackermann
D
,
Pruijm
M
,
Ponte
B
,
Guessous
I
,
Ehret
G
,
Escher
G
, et al.
CYP17A1 Enzyme Activity Is Linked to Ambulatory Blood Pressure in a Family-Based Population Study. Am J Hypertens. 2016;29(4):484–93. doi:.https://doi.org/10.1093/ajh/hpv138
39
Ponte
B
,
Pruijm
M
,
Ackermann
D
,
Vuistiner
P
,
Guessous
I
,
Ehret
G
, et al.
Copeptin is associated with kidney length, renal function, and prevalence of simple cysts in a population-based study. J Am Soc Nephrol. 2015;26(6):1415–25. doi:.https://doi.org/10.1681/ASN.2014030260
40
Pruijm
M
,
Ponte
B
,
Ackermann
D
,
Paccaud
F
,
Guessous
I
,
Ehret
G
, et al.
Associations of Urinary Uromodulin with Clinical Characteristics and Markers of Tubular Function in the General Population. Clin J Am Soc Nephrol. 2016;11(1):70–80. doi:.https://doi.org/10.2215/CJN.04230415
41
Alwan
H
,
Pruijm
M
,
Ponte
B
,
Ackermann
D
,
Guessous
I
,
Ehret
G
, et al.
Epidemiology of masked and white-coat hypertension: the family-based SKIPOGH study. PLoS One. 2014;9(3):e92522. doi:.https://doi.org/10.1371/journal.pone.0092522
42
Forni Ogna
V
,
Ogna
A
,
Vuistiner
P
,
Pruijm
M
,
Ponte
B
,
Ackermann
D
, et al.; Swiss Survey on Salt Group. New anthropometry-based age- and sex-specific reference values for urinary 24-hour creatinine excretion based on the adult Swiss population. BMC Med. 2015;13(1):40. doi:.https://doi.org/10.1186/s12916-015-0275-x
43
Levey
AS
,
Stevens
LA
,
Schmid
CH
,
Zhang
YL
,
Castro
AF, 3rd
,
Feldman
HI
, et al.; CKD-EPI (Chronic Kidney Disease Epidemiology Collaboration). A new equation to estimate glomerular filtration rate. Ann Intern Med. 2009;150(9):604–12. doi:.https://doi.org/10.7326/0003-4819-150-9-200905050-00006
44
Alwan
H
,
Ehret
G
,
Ponte
B
,
Pruijm
M
,
Ackermann
D
,
Guessous
I
, et al.
Heritability of ambulatory and office blood pressure in the Swiss population. J Hypertens. 2015;33(10):2061–7. doi:.https://doi.org/10.1097/HJH.0000000000000681
45
Reinivuo
H
,
Valsta
LM
,
Laatikainen
T
,
Tuomilehto
J
,
Pietinen
P
. Sodium in the Finnish diet: II trends in dietary sodium intake and comparison between intake and 24-h excretion of sodium. Eur J Clin Nutr. 2006;60(10):1160–7. doi:.https://doi.org/10.1038/sj.ejcn.1602431
46
Haldimann
M
,
Bochud
M
,
Burnier
M
,
Paccaud
F
,
Dudler
V
. Prevalence of iodine inadequacy in Switzerland assessed by the estimated average requirement cut-point method in relation to the impact of iodized salt. Public Health Nutr. 2015;18(8):1333–42. doi:.https://doi.org/10.1017/S1368980014002018
47
Jafari
P
,
Thomas
A
,
Haselbach
D
,
Watfa
W
,
Pantet
O
,
Michetti
M
, et al.
Trace element intakes should be revisited in burn nutrition protocols: A cohort study. Clin Nutr. 2018;37(3):958–64. doi:.https://doi.org/10.1016/j.clnu.2017.03.028
48
Bath
SC
,
Combet
E
,
Scully
P
,
Zimmermann
MB
,
Hampshire-Jones
KH
,
Rayman
MP
. A multi-centre pilot study of iodine status in UK schoolchildren, aged 8-10 years. Eur J Nutr. 2016;55(6):2001–9. doi:.https://doi.org/10.1007/s00394-015-1014-y
49
Vejbjerg
P
,
Knudsen
N
,
Perrild
H
,
Laurberg
P
,
Andersen
S
,
Rasmussen
LB
, et al.
Estimation of iodine intake from various urinary iodine measurements in population studies. Thyroid. 2009;19(11):1281–6. doi:.https://doi.org/10.1089/thy.2009.0094
50Brown H. Applied Mixed Models in Medicine. 2nd ed. Chichester, England: John Wiley & Sons Ltd.; 2006.
51Beaton G. Criteria of an Adequate Diet. In: Shils R, Olsen J, Shike M, editors. Modern Nutrition in Health and Disease. Philadelphia, PA: Lea & Febiger; 1994.
52Using the Estimated Average Requirement for Nutrient Assessment of Groups. DRI Dietary Reference Intakes: Applications in Dietary Assessment. Washington (DC): National Academies Press (US); 2000.
53
Tooze
JA
,
Kipnis
V
,
Buckman
DW
,
Carroll
RJ
,
Freedman
LS
,
Guenther
PM
, et al.
A mixed-effects model approach for estimating the distribution of usual intake of nutrients: the NCI method. Stat Med. 2010;29(27):2857–68. doi:.https://doi.org/10.1002/sim.4063
54Usual Dietary Intakes NCI. SAS Macros for Analysis of a Single Dietary Component. 2015 [Apr 8, 2019]; Available from: https://epi.grants.cancer.gov/diet/usualintakes/macros_single.html.
55
König
F
,
Andersson
M
,
Hotz
K
,
Aeberli
I
,
Zimmermann
MB
. Ten repeat collections for urinary iodine from spot samples or 24-hour samples are needed to reliably estimate individual iodine status in women. J Nutr. 2011;141(11):2049–54. doi:.https://doi.org/10.3945/jn.111.144071
56
Johner
SA
,
Thamm
M
,
Schmitz
R
,
Remer
T
. Examination of iodine status in the German population: an example for methodological pitfalls of the current approach of iodine status assessment. Eur J Nutr. 2016;55(3):1275–82. doi:.https://doi.org/10.1007/s00394-015-0941-y
57
Zimmermann
MB
,
Andersson
M
. Assessment of iodine nutrition in populations: past, present, and future. Nutr Rev. 2012;70(10):553–70. doi:.https://doi.org/10.1111/j.1753-4887.2012.00528.x
58
Bruins
MJ
,
Mugambi
G
,
Verkaik-Kloosterman
J
,
Hoekstra
J
,
Kraemer
K
,
Osendarp
S
, et al.
Addressing the risk of inadequate and excessive micronutrient intakes: traditional versus new approaches to setting adequate and safe micronutrient levels in foods. Food Nutr Res. 2015;59(1):26020. doi:.https://doi.org/10.3402/fnr.v58.26020
59Andersen S, Karmisholt J, Laurberg P. Variations in Iodine Excretion in Healthy Individuals. In: Preedy VR, Burrow GN, Watson R, editors. Comprehensive Handbook of Iodine. New York: Elsevier; 2009. pp. 421–8.
60Burnier M, Aepli S, Arnold M, Bochud M, Conen D, Erne P, et al. Salz und Gesundheit. Bern, Switzerland: Schweizerische Herzstiftung 2014.
61
Walther
B
,
Wechsler
D
,
Schlegel
P
,
Haldimann
M
. Iodine in Swiss milk depending on production (conventional versus organic) and on processing (raw versus UHT) and the contribution of milk to the human iodine supply. J Trace Elem Med Biol. 2018;46:138–43. doi:.https://doi.org/10.1016/j.jtemb.2017.12.004
62Contempre B, Dumont JE. Iodine and Selenium Interaction in the Thyroid Hormone System. In: Köhrle J, editor. Mineralstoffe und Spurenelemente. Stuttgart: Wissenschaftliche Verlagsgesellschaft mbH; 1998. p. 45-51.