Controlled attenuation parameter for the assessment of liver steatosis in comparison with liver histology: a single-centre real life experience
DOI: https://doi.org/10.4414/smw.2019.20077
Stephan
Baumelera, Wolfram
Jochumb, Jörg
Neuweilerb, Irina
Bergamina, David
Semelaa
aDepartment of Gastroenterology/Hepatology, Cantonal Hospital St Gallen, Switzerland
bInstitute of Pathology, Cantonal Hospital St. Gallen, Switzerland
Summary
BACKGROUND AND AIMS
Accurate diagnosis and staging of non-alcoholic fatty liver disease are essential for the management of this disorder. Controlled attenuation parameter (CAP) has been suggested as a new noninvasive measurement made during transient elastography to assess liver steatosis. The aim of this study was to evaluate CAP as a diagnostic tool for identifying the presence and degree of hepatic steatosis in consecutive patients in an outpatient liver unit of a tertiary centre.
METHODS
Between March 2015 and August 2016, all patients who underwent liver biopsy underwent liver stiffness measurement with simultaneous CAP determination using the FibroScan® M or XL probe. Steatosis, inflammatory activity and fibrosis were assessed using the histological SAF scoring system. In addition, fibrosis was scored according to the METAVIR system, and body mass index (BMI) and the underlying liver disease were also recorded.
RESULTS
224 patients were included in the analysis; 146 (65.2%) were male. Steatosis grades were distributed as follows: S0 n = 85 (37.9%), S1 n = 82 (36.6%), S2 n = 33 (14.7%), S3 n = 24 (10.7%). Mean BMI was 26.8 kg/m2, for the S0 group 24.9 kg/m2, S1 26.5 kg/m2, S2 27.3 kg/m2 and S3 32.5 kg/m2. The CAP differed significantly between steatosis groups S0 to S3. The area under receiver operating characteristics curve for S0 vs S1–S3 was 0.78, for S0/1 vs S2/3 0.83 and for S0–2 vs S3 0.82. Calculated cut-off values were 258.5 dB/m for S0 vs S1–3, 282.5 dB/m for S0/1 vs S2/3 and 307.5 dB/m for S0–2 vs S3.
CONCLUSIONS
CAP values are strongly associated with the degree of steatosis irrespective of the underlying liver disease. Integrating CAP measurements in the standard work-up may identify patients with NAFLD.
Abbreviations
- AUROC
-
area under receiver operating characteristics curve
- BMI
-
body mass index
- CAP
-
controlled attenuated pressure
- EASL
-
European Association for Study of the Liver
- LSM
-
liver stiffness measurement
- NAFLD
-
non-alcoholic fatty liver disease
- NASH
-
non-alcoholic steatohepatitis
- NPV
-
negative predictive value
- PPV
-
positive predictive value
- SAF
-
steatosis activity fibrosis
- T2DM
-
type 2 diabetes mellitus
Introduction
Non-alcoholic fatty liver disease (NAFLD) has become the most common liver disease in industrialised countries with a prevalence of up to 35% worldwide and 25% in Europe [1–4]. NAFLD includes steatosis (isolated fat accumulation in hepatocytes) and steatohepatitis (steatosis with liver-cell injury/death and accumulation of inflammatory cells). Patients with NAFLD have a significantly increased risk of developing hepatic fibrosis or cirrhosis and therefore increased morbidity and mortality due to complications of liver cirrhosis or hepatocellular carcinoma. In addition, NAFLD has a strong association with metabolic syndrome and is also associated with an increased risk of cardiovascular disease [5]. Both cardiovascular morbidity and complications of cirrhosis are associated with a severe impairment of quality of life and represent an increasing clinical and economic burden [6–8]. Furthermore, NAFLD is also observed with increasing frequency concomitant to other liver diseases such as hepatitis B and C, autoimmune hepatitis, hemochromatosis, primary biliary cholangitis or alpha1-antitrypsin deficiency [9]. As a concomitant disease, NAFLD can accelerate the progression of the underlying disease and promote the development of hepatocellular carcinoma [10–12]. Therefore, early detection and treatment of NAFLD, both as separate disease and as co-factor with other liver diseases, is crucial.
Liver biopsy is the gold standard for both the diagnosis of NAFLD and the differentiation between isolated steatosis and non-alcoholic steatohepatitis (NASH). However, liver biopsy is an invasive procedure, involves a certain risk of complications, is costly and bears the risk of sampling errors [13, 14]. Therefore, a non-invasive diagnostic approach is preferred. The current guidelines from the European Association for Study of the Liver (EASL) mention ultrasonography, serum biomarkers and magnetic resonance spectroscopy (1H-MRS) as non-invasive tests for NAFLD [15]. However, ultrasonography and serum biomarker tests are relatively reliable in predicting steatosis, but not in its classification. In comparison, 1H-MRS is the optimal examination for grading the steatosis and avoids sampling errors [16, 17]. However, 1H-MRS is expensive and only available at selected centres.
Measurement of controlled attenuation parameter (CAP) is a novel tool for the non-invasive quantitative and qualitative assessment of liver steatosis. CAP is integrated in the elastography tool FibroScan®, which is widely used to assess liver fibrosis in chronic viral hepatitis [18, 19]. CAP measures ultrasonic attenuation (in dB/m) at a frequency of 3.5 MHz (on a go-and-return path). Values range from 100 to 400 dB/m [20–22]. To date, CAP has been studied in various patient cohorts, mainly in Europe and Asia and in patients with metabolic syndrome and hepatitis B [23–27].
The aim of this study was to evaluate CAP as a diagnostic tool for identifying the presence and the degree of hepatic steatosis in consecutive patients in an outpatient liver unit of a tertiary centre.
Patients and methods
Study population
This retrospective study was conducted at the Cantonal Hospital St Gallen, a tertiary referral centre in Switzerland. Consecutive patients who underwent liver biopsy between March 2015 and August 2016 were evaluated for inclusion in the study. Every patient considered for liver biopsy without a focal lesion and aged over 18 years was eligible for inclusion. The following clinical parameters were recorded: age, gender, body mass index (BMI) and liver diseases. Data analysis was in accordance with the ethical guidelines of the Helsinki Declaration 1975 and the study was approved by the Ethics Committee Ostschweiz (EKOS), St Gallen (Project ID 2018-02092).
Transient elastography and CAP measurement
Transient elastography and CAP measurements were performed with the FibroScan® Touch 502 device using M or XL probes (Echosens, Paris, France). Details on CAP measurements are described elsewhere [28, 29]. The result is the median of ≥10 valid measurements. The measurements were taken at a depth of between 25 and 65 mm, measured on the go-and-return path at 3.5 MHz. The measurements (and the biopsy) were made on the right lateral side (intercostal space) in the liver segment VI or VII. If CAP measurement and biopsy were performed on the same day, CAP measurement was always performed before biopsy. If CAP measurement and biopsy were not performed on the same day, the maximum allowed interval was 7 days. Only valid measurements were included, based on the device’s internal algorithm. Reliability was defined as (1) ≥10 valid measurements, (2) interquartile range / median (IQR/med) <30% in elastography and (3) success rate >60% [30]. The physicians performing the elastography (and biopsy) had knowledge of the available clinical information.
Liver biopsy and histology
The liver biopsy was always performed by two physicians together (SB, IB or DS). The biopsies were always taken under sonographic control from the right lateral side (segment VI or VII) at the same place as the elastography (if performed before). All biopsies were made with BioPince® Full Core Biopsy needles with a diameter of 18G and a cylinder length of 33 mm. Liver biopsy specimens were formalin-fixed and paraffin-embedded. Serial sections were stained with haematoxylin and eosin, and chromotrope aniline blue using standard methods. Sections were evaluated by two experienced liver pathologists (WJ and JN), who were blinded to CAP und elastography results. Liver steatosis was categorised as S0, S1, S2 or S3 based on the percentage of hepatocytes with large or medium-sized fat droplets, using the SAF (steatosis, activity, fibrosis) scoring system: S0 <5%; S1 5–33%, mild; S2 34–66%, moderate; S3 >66%, marked [31–32]. In addition, liver sections were evaluated for hepatocyte ballooning, lobular inflammation and fibrosis using the SAF scoring system. The degree of fibrosis was also scored using the METAVIR system [33].
Statistical analysis
Descriptive statistics are reported for all included patients, for patients stratified according to their steatosis category and for the subgroup with a diagnosis of NAFLD. For measurements on a continuous scale the mean and standard deviation and for nominal characteristics the number of observations and percentages were reported. Continuous measures were assumed to follow a normal distribution, except for the liver stiffness and steatosis grade (in %). Parametric test statistics were used to compare the null hypothesis of no differences between patient groups. For comparisons between two patient groups, a p-value based on a two-sided t-test was reported. In the case of more than two groups, the reported p-values were based on an F-test. The liver stiffness and steatosis grade (in %) were compared by a nonparametric Mann-Whitney U-test and a Kruskal-Wallis test. Characteristics on a nominal scale were compared by Fisher’s exact test.
The performance of the CAP parameter to predict the steatosis category was examined by the area under the curve (AUC) obtained from the receiver operating characteristics (ROC). A 95% confidence interval (CI) for the AUC of each patient group was provided and for the cut-off point, which is related to the maximum Youden index (defined as sensitivity + specificity − 1), the specificity, sensitivity, negative predictive value (NPV), positive predictive value (PPV), the accuracy and the positive as well as the negative likelihood ratio (LR). For all these measures a 95% CI was reported, if available. The ROC was carried out for groups with different steatosis categories: first the S0 patients were compared against all other and then higher steatosis grade categories were reassigned continually to the S0 category. In a second analysis all steatosis grade categories were compared group wise in a separate ROC. All analyses were made with R version 3.2.3 (2015-12-10) and for the ROC analyses the R-package pROC version 1.8 was used [34, 35].
The influence of possible confounders, which could have an impact on the association between CAP and steatosis, was established by a multiple linear regression model, which includes the CAP measurements as outcome. The included, possible confounding factors, were the patient’s age, sex, BMI, liver stiffness and the steatoses grade in percent and if a patient suffered from NASH or NAFLD. The reference category refers to female patients with no NASH.
Results
Patient characteristics
From March 2015 to August 2016 a total 290 patients were screened and 224 were included in the analysis (fig. 1). Thirty-nine patients were not included because of unreliable CAP measurements. In 7 patients fewer than 10 measurements were valid, in 11 the success rate was ≤60% and in 21 LSM IQR/med was ≥30%. In 27 cases the interval from CAP measurement to liver biopsy was more than 7 days. The majority (65%) of the 224 patients were male. Median age was 49 years (IQR 39–60). Median BMI was 25.6 kg/m2 (IQR 23.5–29.4, range 17.5–51.8 kg/m2). A total of 114 patients had a BMI ≥25 kg/m2. BMI values were not available for 21 patients. The following liver diseases were diagnosed: hepatitis C (n = 61), hepatitis B (n = 38), NAFLD/NASH (n = 52), ASH (n = 6); autoimmune hepatitis (n = 20), primary biliary cholangitis (n = 8), sarcoidosis n = 4, drug induced liver injury (n = 12), others (n = 25). Patient characteristics are summarised in table 1.
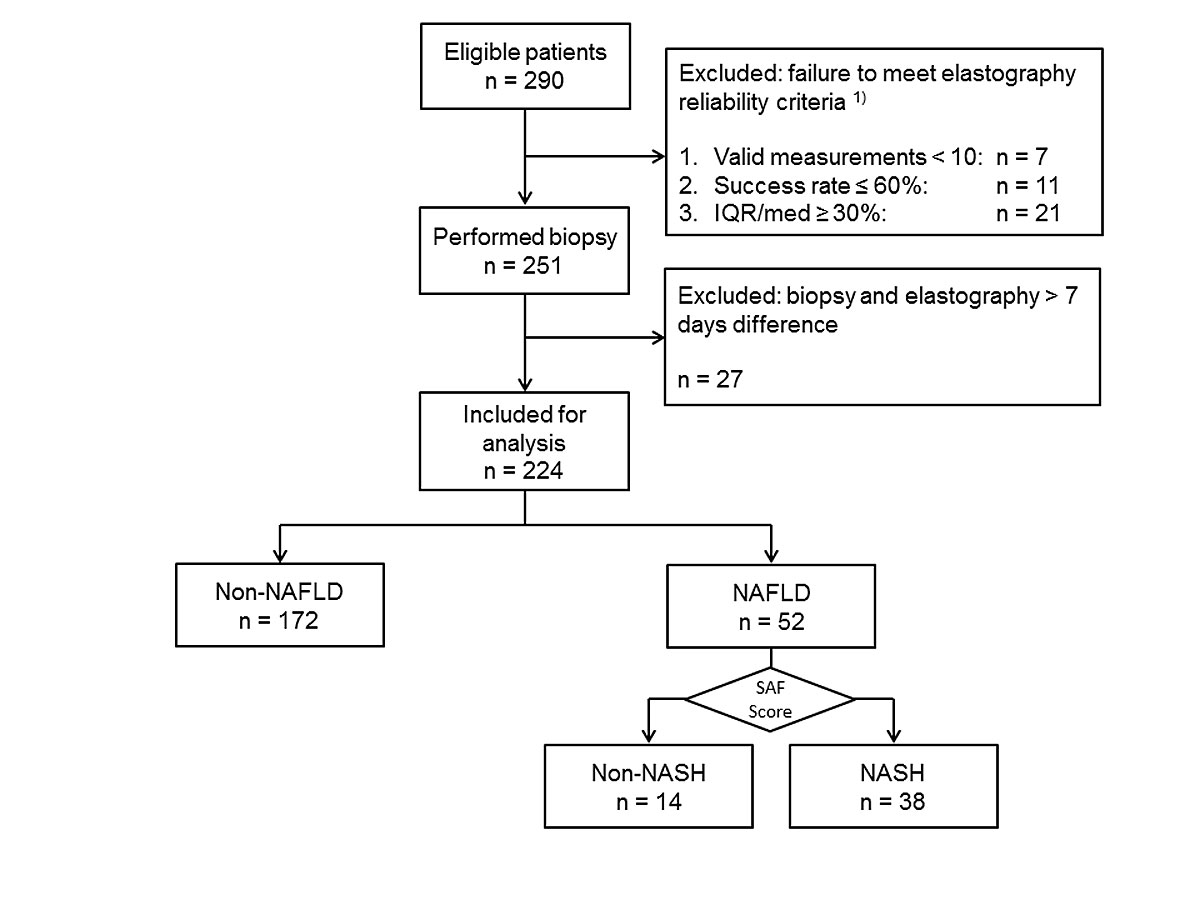
Figure 1 STARD flow diagram.
1) A total of 39 patients were excluded because of unreliable measurements. Among them 21 (54%) suffered from non-alcoholic fatty liver disease (NAFLD). IQR/med = interquartile range / median; NASH = non-alcoholic steatohepatitis
Table 1 Patient characteristics.
| |
Total
|
Steatosis score
|
p-value
|
|
S0
|
S1
|
S2
|
S3
|
| Patients, n (%) |
224 |
85 (37.9) |
82 (36.6) |
33 (14.7) |
24 (10.7) |
|
| Male, n (%) |
146 (65.2) |
49 (57.6) |
55 (67.1) |
25 (75.8) |
17 (70.8) |
0.239 |
| Age, median (IQR) |
49 (39–60) |
44 (36–56) |
53 (42–64) |
54 (46–61) |
42 (30–56) |
0.003 |
| BMI kg/m2median (IQR)*
|
25.6 (23.5–29.4) |
24.8 (22.6–27.5) |
25.6 (23.8–28.9) |
26.6 (23.7–30.1) |
31.7 (27.5–35.4) |
<0.0001 |
| Diagnosis, n (%) |
HBV hepatitis |
38 (17) |
18 (21) |
16 (20) |
3 (9) |
1 (4) |
|
| HCV hepatitis |
61 (27) |
25 (29) |
25 (30) |
9 (27) |
2 (8) |
| NAFLD/NASH |
52 (23) |
0 |
15 (18) |
18 (55) |
19 (79) |
| ASH |
6 (3) |
1 (1) |
3 (4) |
0 |
2 (8) |
| Autoimmune hepatitis |
20 (9) |
16 (19) |
3 (4) |
1 (3) |
0 |
| Drug-induced liver injury |
12 (5) |
4 (5) |
7 (9) |
1 (3) |
0 |
| Primary biliary cholangitis |
8 (4) |
5 (6) |
2 (2) |
1 (3) |
0 |
| Sarcoidosis |
4 (2) |
3 (4) |
1 (1) |
0 |
0 |
| Others |
23 (10) |
13 (15) |
10 (12) |
0 |
0 |
Fibrosis score
METAVIR, n (%)†
|
F0 |
45 (20.1) |
22 (25.9) |
11 (13.4) |
5 (15.2) |
7 (29.2) |
0.754 |
| F1 |
78 (34.8) |
28 (32.9) |
28 (34.1) |
13 (39.4) |
9 (37.5) |
| F2 |
48 (21.4) |
19 (22.4) |
19 (23.2) |
6 (18.2) |
4 (16.7) |
| F3 |
21 (9.4) |
7 (8.2) |
10 (12.2) |
3 (9.1) |
1 (4.2) |
| F4 |
31 (13.8) |
8 (9.4) |
14 (17.3) |
6 (18.2) |
3 (12.5) |
| Liver stiffness (kPa), median (IQR) |
7.8 (5.4–13.1) |
6.4 (5.0–12.2) |
8.8 (6.0–14.1) |
7.7 (6.2–11.6) |
8.2 (5.3–13.1) |
0.223 |
| CAP (dB/m), median (IQR) |
257 (219–307) |
227 (199–249) |
265 (228–295) |
307 (283–338) |
336 (319–358) |
<0.001 |
Histopathological findings
All biopsy samples were evaluated as representative. Steatosis was observed in 139/224 (62%) liver biopsies. Steatosis categories had the following distribution: S0 n = 85 (38%), S1 n = 82 (37%), S2 n = 33 (15%), and S3 n = 24 (11%).
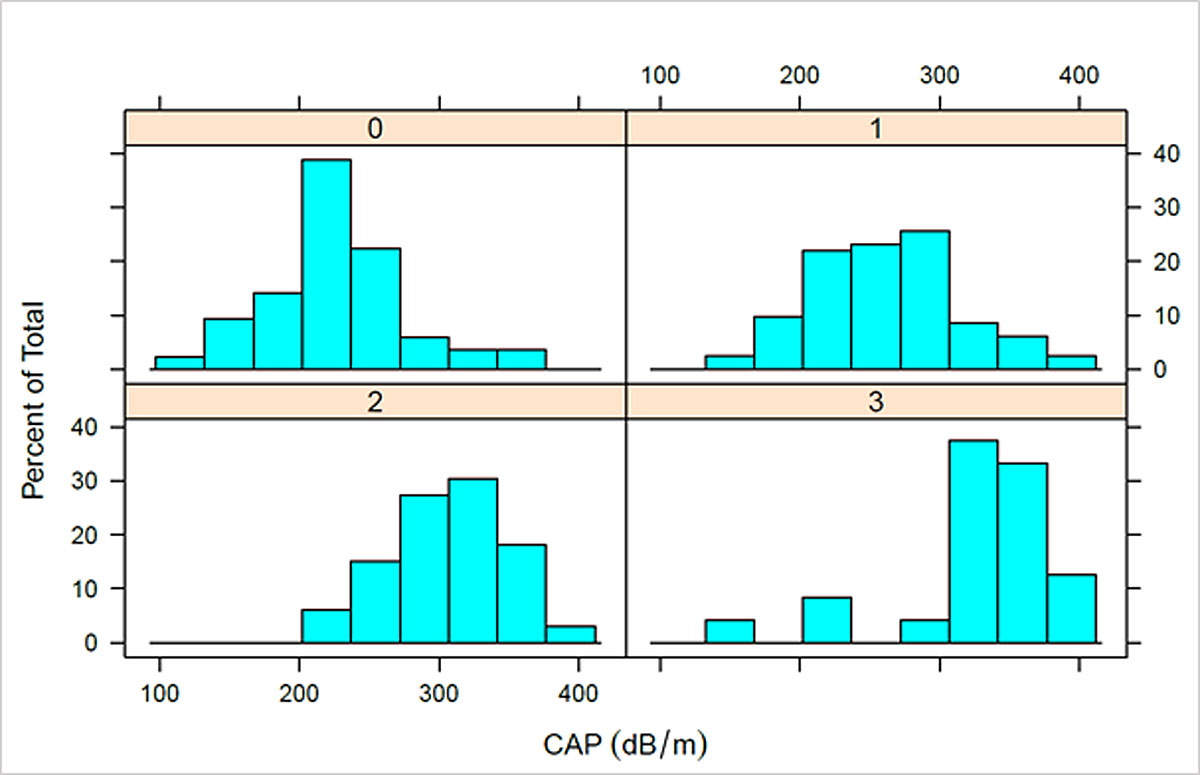
CAP measurements
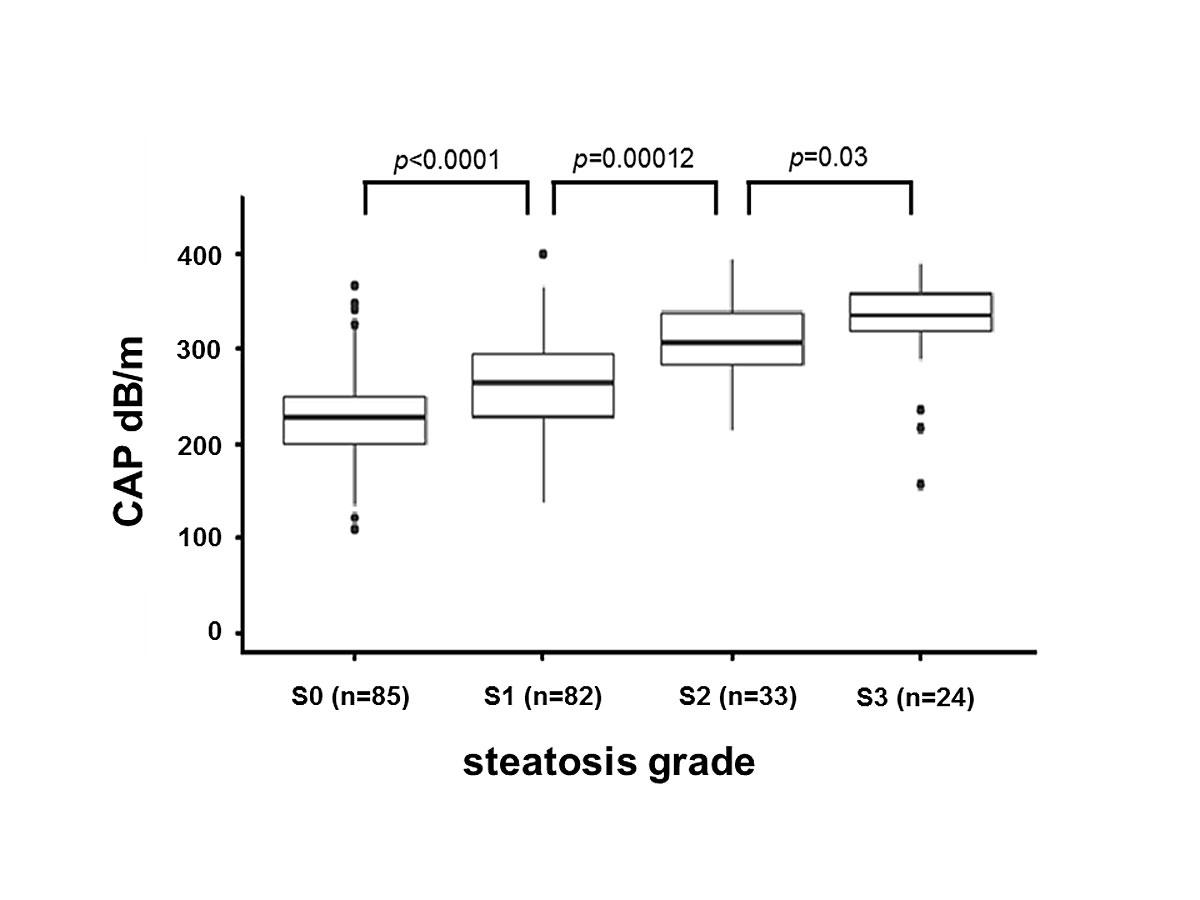
The range of CAP values was 109–400 dB/m (median 257, IQR 219–307). The mean number of measurements taken per patient was 13.3 (range 10–21) and the mean number of valid measurements per patient was 12.4 (range 10–20). For patients with S0, median CAP was 227 dB/m (IQR 199–249), for S1 265 dB/m (IQR 228–295), for S2 307 dB/m (IQR 283–338) and for S3 335 dB/m (IQR 319–358) (fig. 2). Patients with steatosis (S1–S3) had significantly higher CAP values than patients without steatosis (S0) (p <0.0001). Patients with no and low steatosis (S0, S1) had significantly lower CAP than patients with moderate or high steatosis (S2, S3) (p <0.0001). Patients with no to moderate steatosis (S0–S2) had significantly lower CAP than patients with high steatosis (S3) (p <0.0001). CAP values were also compared between steatosis categories, which revealed significant differences between the S0/S1 (p <0.0001), S1/S2 (p = 0.00012), and S2/S3 (p = 0.03) categories. The distributions of CAP values for each steatosis group are presented in supplementary figure S3 (appendix 1).
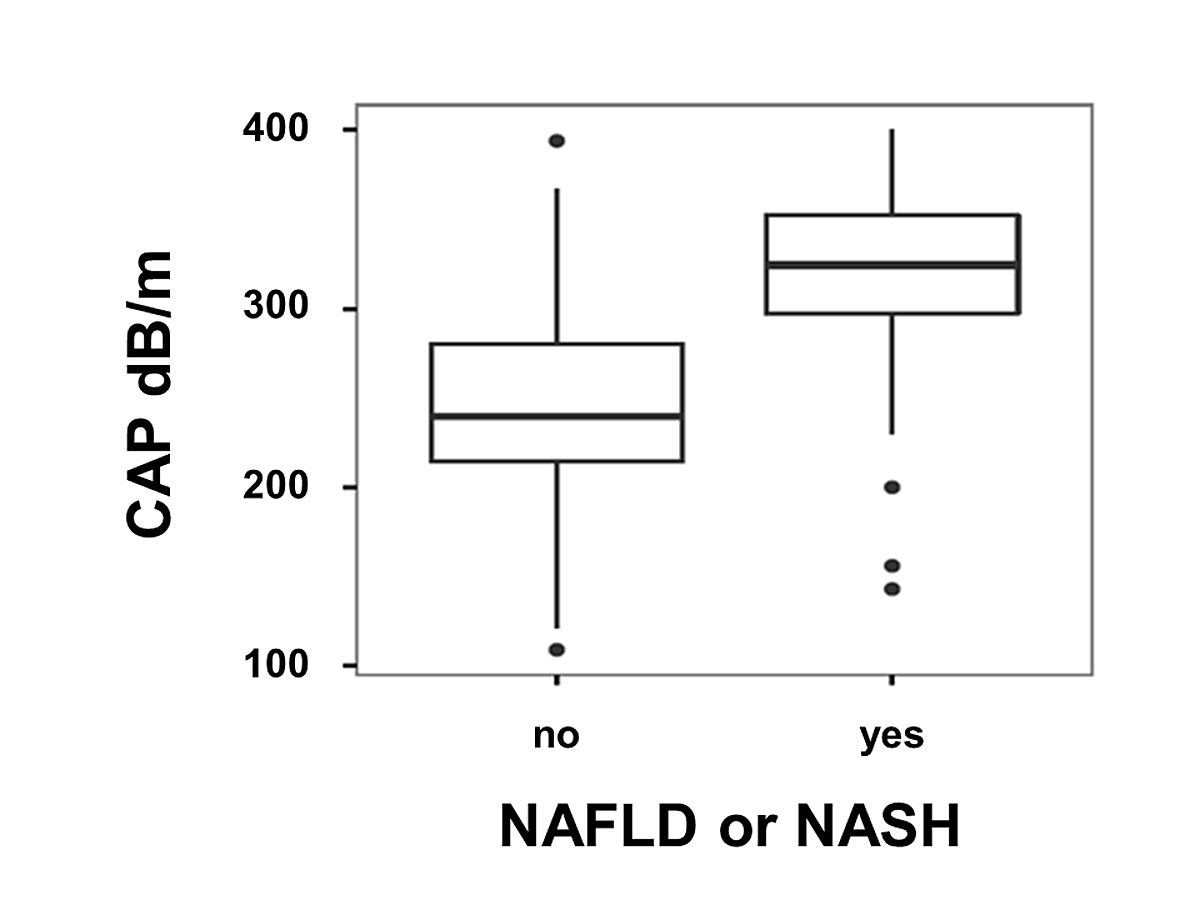
CAP values of patients with NAFLD (n = 52) were significantly higher than CAP values of patients with other liver diseases (n = 172): median CAP 324.5 dB/m (IQR 297–352.25) vs 239.5 dB/m (IQR 214.75–280); p <0.001 (fig. 3). Among the patients with NAFLD, CAP values were comparable between patients with isolated steatosis or steatohepatitis. CAP values for patients with NAFLD are summarised separately in table 2.
Table 2 Characteristics of patients with non-alcoholic fatty liver disease.
| |
Total
|
Steatosis
|
Steatohepatitis
|
p–value
|
| Patients, n (%) |
52 |
14 (27) |
38 (73) |
|
| Age (years), median (IQR) |
49 (39–62) |
48 (40–54) |
51 (39– 62) |
0.41 |
| Male, n (%) |
36 (69.2) |
9 (64.3) |
27 (71.1) |
0.738 |
| BMI (kg/m2), median (IQR) |
29.7 (25.9–32.9) |
30.7 (25.4–32.6) |
28.9 (26.1–32.9) |
0.82 |
| BMI ≥25kg/m2, n (%) |
42 (80.7) |
10 (71.4) |
32 (84.2) |
|
| SAF steatosis, n (%) |
1 |
11 (21) |
6 (43) |
5 (13) |
|
| 2 |
19 (37) |
4 (29) |
15 (39) |
| 3 |
22 (42) |
4 (29) |
18 (47) |
| SAF ballooning, n (%) |
0 |
5 (10) |
5 (36) |
0 |
|
| 1 |
30 (58) |
9 (64) |
21 (55) |
| 2 |
17 (32) |
0 |
17 (45) |
| SAF lobular inflammation, n (%) |
0 |
13 (25) |
13 (93) |
0 |
|
| 1 |
36 (69) |
1 (7) |
35 (92) |
| 2 |
3 (6) |
0 |
3 (8) |
| SAF fibrosis, n (%) |
0 |
12 (23) |
4 (29) |
8 (21) |
|
| 1 |
10 (19) |
4 (29) |
6 (16) |
| 2 |
13 (25) |
2 (14) |
11 (29) |
| 3 |
10 (19) |
1 (7) |
9 (24) |
| 4 |
7 (13) |
3 (21) |
4 (11) |
| Steatosis (%), median (IQR) |
50.0 (40.0–70.0) |
45.0 (30.0–57.5) |
50 (40.0–70.0) |
0.133 |
| Liver stiffness (kPa), median (IQR) |
7.8 (3.4–11.7) |
8.4 (5.5–10.3) |
7.7 (5.4–12.3) |
0.951 |
| CAP (dB/m), median (IQR) |
325 (297–353) |
310 (284–327) |
331 (305–358) |
0.441 |
The M or XL probe was chosen according to the device’s internal algorithm. The XL probe was used on 20% of the patients. For patients with NAFLD, the XL probe was used in 69%, for non-NAFLD patients in 14%; for BMI ≥25 kg/m2 the XL probe was used in 32% and for BMI
<25 kg/m2 in 7%.
Association between CAP and BMI
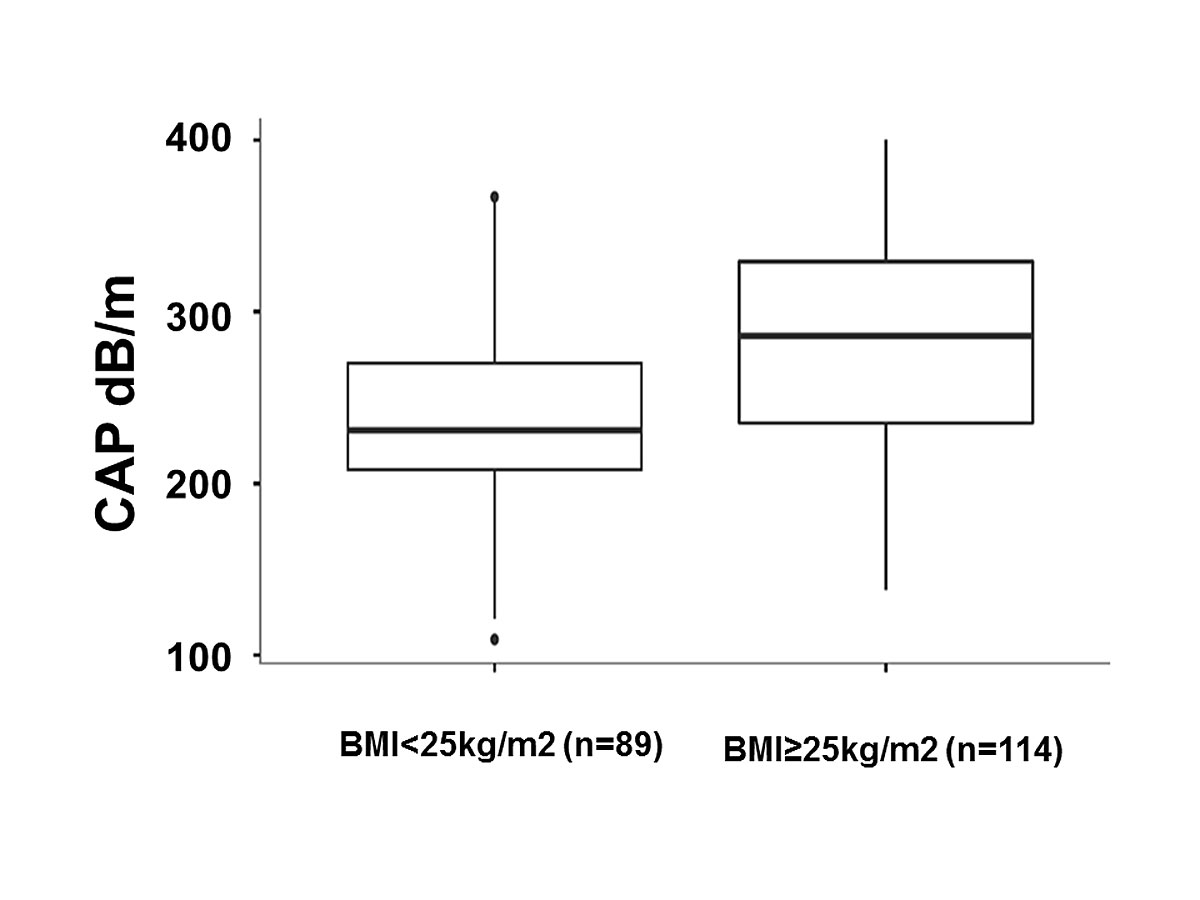
The mean CAP value of the group with BMI <25 kg/m2 (n = 89) was 229 dB/m (IQR 206–267) and 280 dB/m (IQR 232–321) for the group ≥25 kg/m2 (n = 114), p <0.0001 (fig. 4).
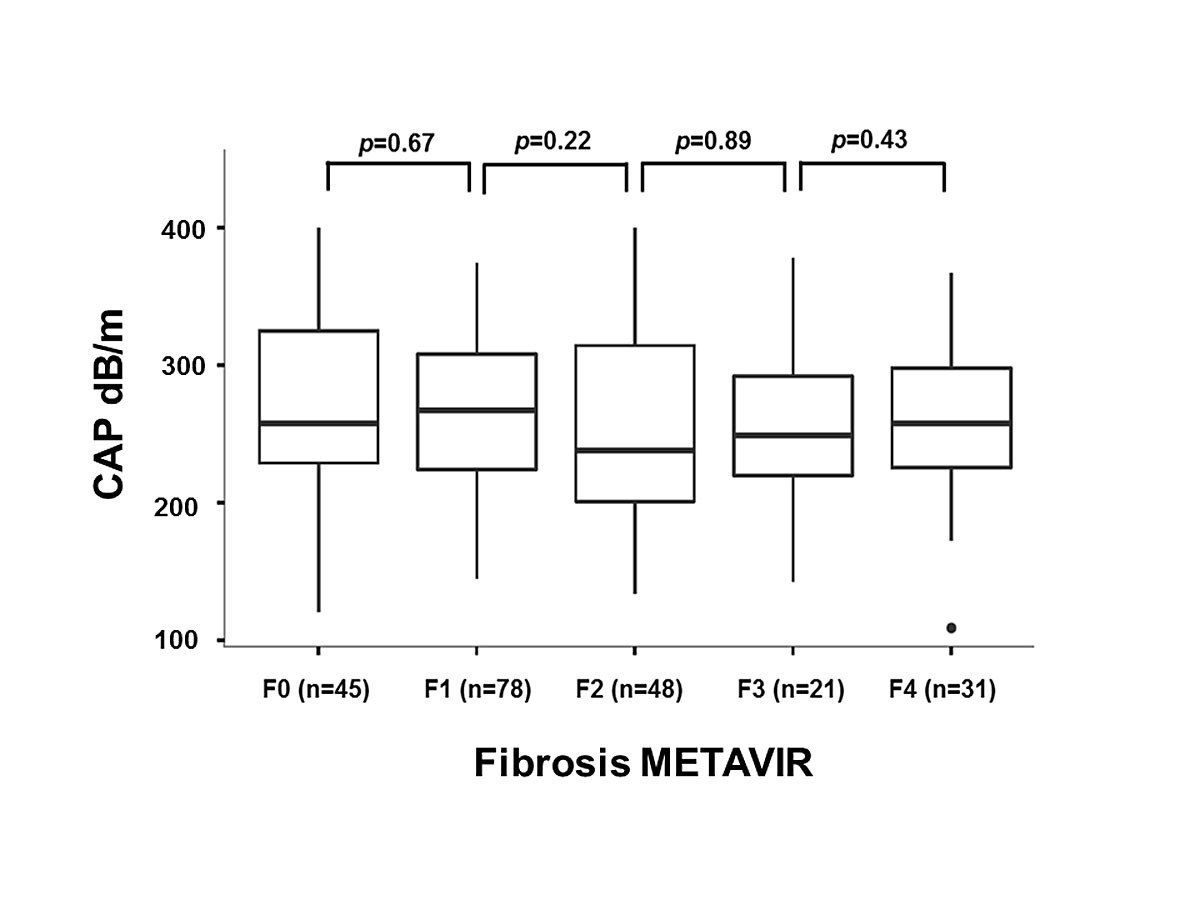
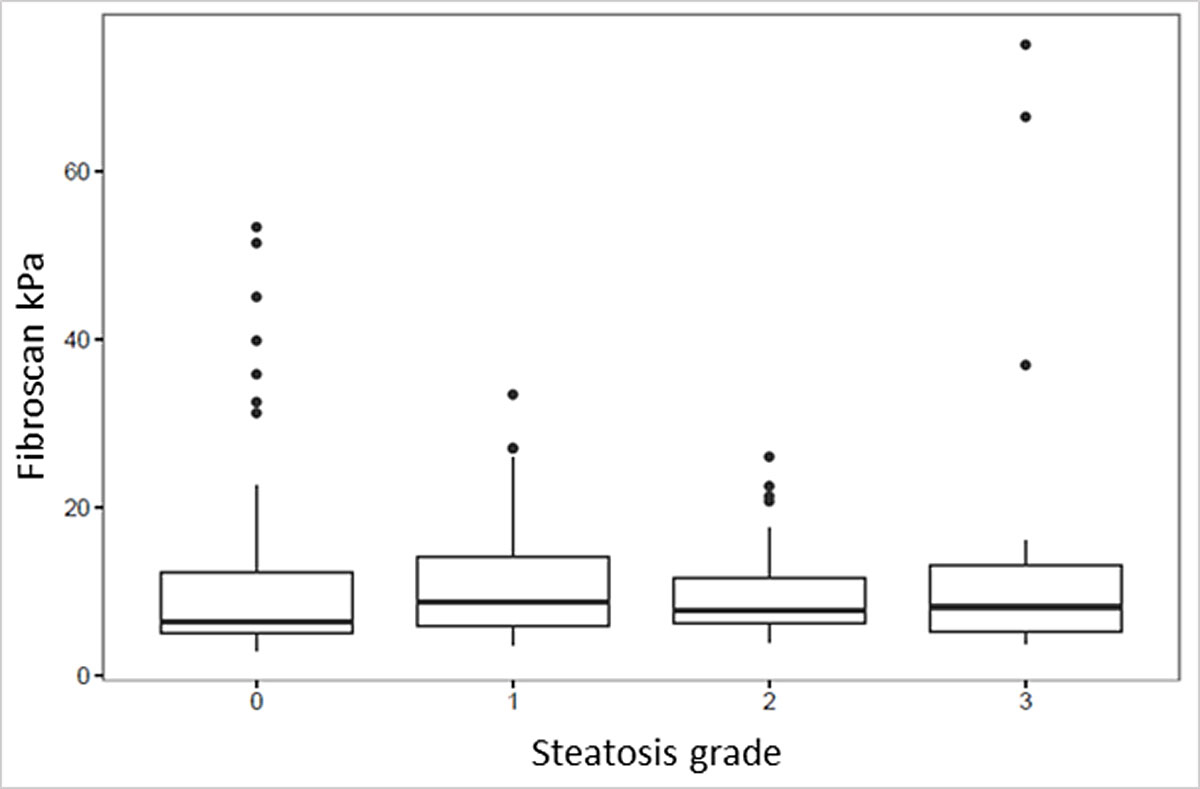
Association between CAP and fibrosis
A potential association between CAP and the degree of fibrosis was analysed. A comparison of the median CAP values in the fibrosis groups F0 to F4 showed no significant difference (fig. 5).
Association between CAP and type 2 diabetes mellitus
In total, 27 (12%) patients with type 2 diabetes mellitus (T2DM) were identified. Of these 27 patients, 13 (48%) had a diagnosis of NAFLD. Median CAP was 288 dB/m (range 143–400) in the T2DM group, and 253 dB/m (109-400) in the non-T2DM group (p = 0.032). Median CAP was 323 dB/m (range 143–400) in the subgroup with T2DM and NAFLD, and 264 dB/m (range 164–341) in the subgroup T2DM without NAFLD (p = 0.058).
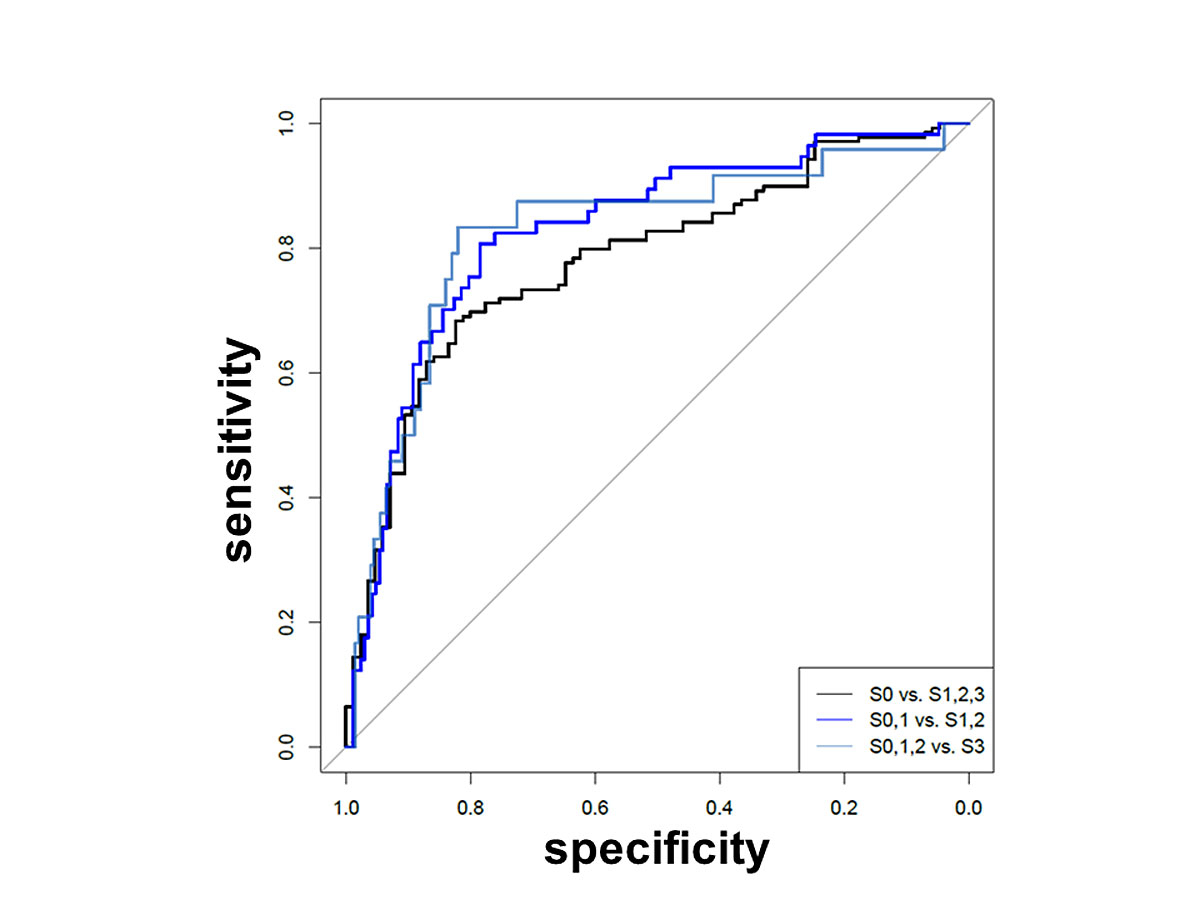
Diagnostic performance and cut-off values
Sensitivity, specificity, NPV, PPV, accuracy and positive or negative LR of CAP to detect liver steatosis are listed in table 3. The ROC analyses are shown in figure 6. For the prediction of steatosis based on CAP measurements (S0 vs S1/2/3), the AUC was 0.78 (95% CI 0.72–0.84); for the differentiation between no/low and moderate/high grade steatosis (S0/1 vs S2/3, fat >33%), the was AUC 0.83 (95% CI 0.76–0.89); to predict a high grade steatosis (S0/1/2 vs S3, fat >66%), the AUC was 0.82 (95% CI 0.72–0.92). Optimal cut-off values were calculated with the maximum Youden index. The cut-off value for S0 vs S1/2/3 was 258 dB/m (95% CI 245–277), for S0/1 vs S2/3 282.5 dB/m (278–307) and for S0/1/2 vs S3 307.5 dB/m.
Table 3 Performance of CAP on the basis of the area under receiver operating characteristics curves (AUROC).
| |
S0 vs S1,2,3
|
S0,1 vs S2,3
|
S0,1,2 vs S3
|
|
Value
|
95% CI
|
Value
|
95% CI
|
Value
|
95% CI
|
| AUC |
0.78 |
0.72–0.84 |
0.83 |
0.76–0.89 |
0.82 |
0.72–0.92 |
| Threshold |
258.50 |
244.5–276.5 |
282.5 |
277.5–306.5 |
307.50 |
286.0–323.5 |
| Specificity |
0.82 |
0.73–0.93 |
0.78 |
0.70–0.90 |
0.82 |
0.71–0.88 |
| Sensitivity |
0.68 |
0.56–0.78 |
0.81 |
0.67–0.91 |
0.83 |
0.67–0.96 |
| NPV |
0.61 |
0.55–0.69 |
0.92 |
0.88–0.96 |
0.98 |
0.96–0.99 |
| PPV |
0.86 |
0.81–0.93 |
0.55 |
0.48–0.72 |
0.36 |
0.27–0.47 |
| Accuracy |
0.73 |
0.68–0.80 |
0.78 |
0.73–0.86 |
0.82 |
0.73–0.88 |
| Positive LR |
3.79 |
– |
3.62 |
– |
4.63 |
– |
| Negative LR |
0.39 |
– |
0.25 |
– |
0.20 |
– |
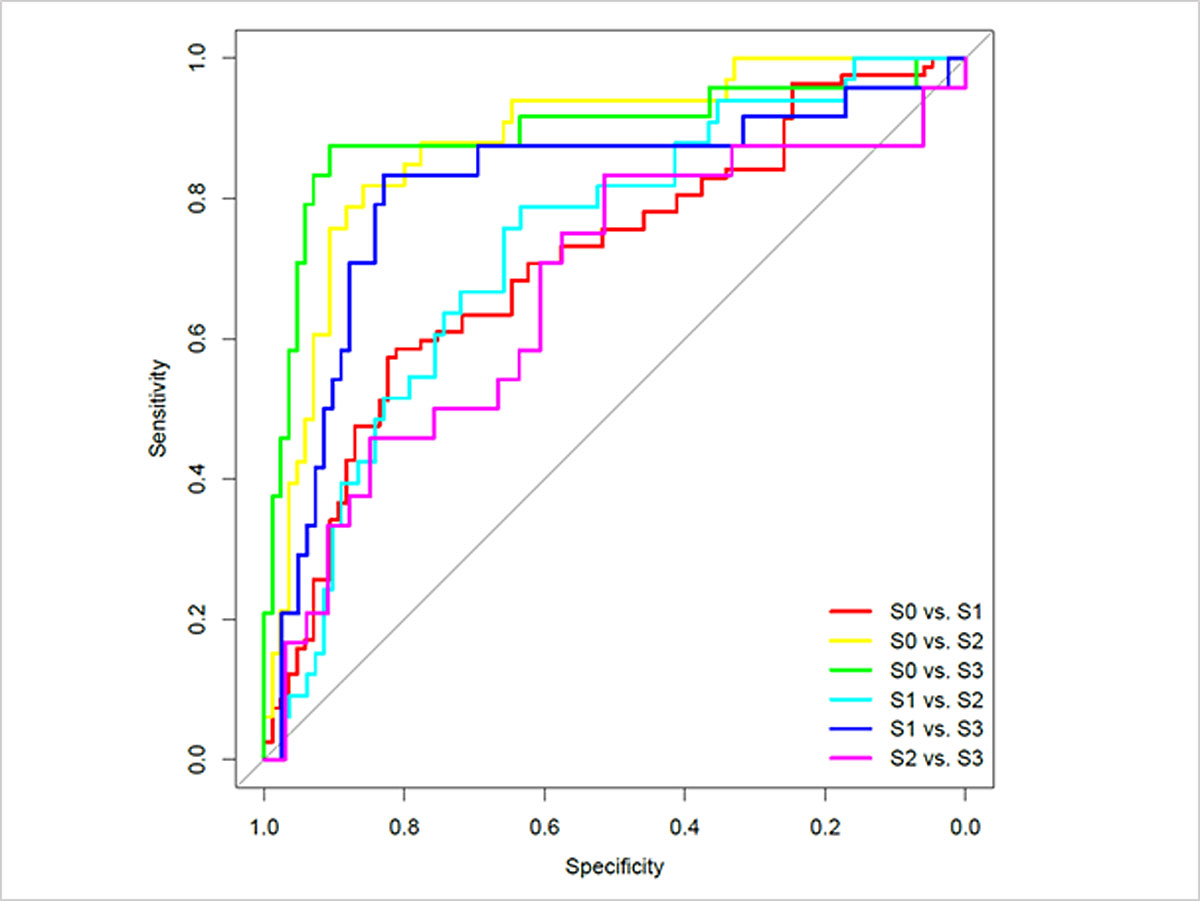
A similar analysis for each pair of individual steatosis categories is presented in table S1 and figure S1 (appendix 1).
Correlation of CAP with other clinical and histological parameters
Table 4 shows the coefficients of the factors included in the regression model together with a 95% CIs and a p-values. Multivariate analysis showed correlation with CAP value for BMI, sex, liver stiffness (kPa), presence of NAFLD and steatosis in percent. No association was found for the factor age.
Table 4 Multivariate analysis, regression model including the 203 patients with body mass index (BMI) data available.*
| Intercept |
159.1 (113.7, 204.7) |
p <0.001 |
| Age |
0.16 (–0.3, 0.61) |
p = 0.50 |
| Sex: male |
15.47 (1.4, 29.54) |
p = 0.03 |
| BMI (kg/m2) |
2.69 |
p <0.001 |
| Liver stiffness |
–0.95 (–1.62, –0.27) |
p = 0.01 |
| Steatosis in % |
0.96 (0.6, 1.32) |
p <0.001 |
| NAFLD |
21.26 (0.91, 41.61) |
p = 0.04 |
| Adjusted R2
|
0.42 |
| Residual standard error |
47.5 (degrees of freedom = 196) |
The comparison of liver stiffness measurements between the steatosis groups is summarised in table S2 and figure S2 (appendix 1).
Discussion
This study investigated the performance of CAP to identify liver steatosis in a “real life” scenario in consecutive patients at an outpatient liver unit of a tertiary centre. The study included more than 10 different liver diseases. However, the subgroup with hepatitis C was disproportionately large (63%), because liver biopsy was mandatory for the treatment with direct-acting antiviral drugs during trial recruitment. This study shows that CAP performs well not only in patients with metabolic syndrome or hepatitis B (as shown in several studies before), but also in patients with a broad spectrum of underlying liver diseases [23–27]. This is important for the future use of CAP as a screening tool for liver steatosis not only as an independent disease, but also as a concomitant condition with other liver diseases.
The AUC values of 0.78 (for the diagnosis of steatosis ≥5%), 0.83 (≥33%) and 0.82 (≥66%) are comparable to data from previous studies such as those of de Lédinghen et al. [26] (in patients with known NAFLD) or Chen et al. [25] and Ferraioli et al. [20] (in chronic viral hepatitis). Despite several existing studies with different populations, there is still no consensus on the cut-off values for CAP measurements. Compared to previous studies, the values proposed here are in the middle range, except for the value for S0 vs S1–3. This value, at 258.5 dB/m, was relatively high compared with other findings [20, 23, 25–27, 36, 37]. This may be due to the more heterogeneous patient population. However, even in this population of patients with a variety of liver diseases, the cut-off values were clearly separated from each other. Additional studies will have to establish whether theses cut-off values can be applied in patients with a broad spectrum of liver diseases.
From the comparisons between the BMI groups (≥25 kg/m2 vs <25 kg/m2) and the groups with confirmed NAFLD/NASH versus all other liver diseases, it can be assumed that patients with a high BMI and patients with a diagnosis of NAFLD/NASH present with higher CAP values. This is confirmed by the following results: 280 dB/m and 229 dB/m for the BMI ≥/< 25 kg/m2 subgroups; 324.5 dB/m and 239.5 dB/m for NAFLD/NASH versus other liver diseases groups. However, it is interesting to note that the CAP values in the groups for the comparison of NAFLD/NASH with others are significantly higher than the values for the comparison of BMI ≥/< 25 kg/m2, which is in line with the data presented by Karlas et al. [38]. Similarly, the presence of T2DM also results in increased CAP values (288 vs 253 dB/m) in comparison with non-T2DM patients. This finding could be useful for screening for NAFLD/NASH in populations at risk, such as patients with metabolic syndrome and obesity.
This study found no significant difference between CAP values of patients with steatohepatitis and those without an inflammatory component. The presence of steatohepatitis was quantified with the SAF score. Based on our findings, we assume that the inflammatory cells and ballooning have no relevant physical influence on the attenuation of the sonic wave. In this context it would be interesting to compare CAP values in a larger group of patients with pure steatosis (without ballooning, inflammation and fibrosis) with CAP values in NASH patients. However, it is unlikely that CAP will have the same prognostic impact as the components fibrosis and inflammation in NAFLD patients [39, 40]. Nevertheless, steatosis is a relevant co-factor in liver diseases such as chronic hepatitis C and even after sustained virological response steatosis remains a relevant risk factor for fibrosis progression [41–47]. Therefore the use of CAP has a role as an additional prognostic tool.
This study has several limitations. Because of incomplete data sets due to too long intervals between liver biopsy and laboratory tests, we decided not to evaluate the laboratory data. A correlation with certain laboratory values and certain indices (e.g., fatty liver index) would be interesting, since according to previous studies there is still some disagreement about the association of CAP with gamma-glutamyltransferase, alkaline phosphatase, aspartate or alanine transaminase, or bilirubin [24, 25, 27, 48].
A recurring problem is the use of the M or XL probe [49–52]. For this study we decided to use the algorithm suggested by FibroScan® Touch 502. However, this algorithm refers primarily to the elastography. It is therefore unclear whether it can be used in the same way for steatosis measurement or whether the XL probe should be used according to a separate algorithm such as BMI or thickness of the subcutaneous fat tissue.
Another methodological limitation is the introduction of a potential bias by the exclusion of patients who did not fulfil the reliability criteria. For this study, we chose the rather restrictive criteria of Castera et al. (≥10 valid measurements, IQR/med <30% in elastography and success rate >60%) [30]. This resulted in a total of 39 exclusions, in which NAFLD patients (n = 21, 54%) were overrepresented. This is a consequence of the more difficult and therefore more error-prone examination in obese patients.
In this study we could not use 1H-MRS because it is not available in our centre. It would be desirable to involve the 1H-MRS in future studies. Because the 1H-MRS seems to be an ideal (but expensive) method for the quantification of liver steatosis and in particular takes account of the partly inhomogeneous fat distribution in the liver [16].
In conclusion, this study shows, that CAP offers a quantitative measurement of hepatic steatosis with excellent accuracy when compared with histology. This is an important advantage as it qualifies CAP not only as a noninvasive screening tool, but also for assessing the course and severity of steatosis. In addition, CAP is readily available with the well-established elastography and cheaper than biopsy or MR spectroscopy [16, 53]. This makes CAP measurement to a potential standard tool for steatosis screening.
This study was presented orally in abstract form at: Jahreskongress Schweizerische Gesellschaft für Gastroenterologie 2017, Interlaken; and United European Gastroenterology (UEG) Week 2017, Barcelona.
Appendix 1 Supplementary data
Table S1 Performance of controlled attenuation parameter (CAP) using area under receiver operating characteristics curve (AUROC) for each steatosis category.
| |
AUC
|
Threshold
|
Specificity
|
Sensitivity
|
NPV
|
PPV
|
Accuracy
|
Positive LR
|
Negative LR
|
|
S0 vs S1
|
0.70 |
256.0 |
0.80 |
0.59 |
0.66 |
0.74 |
0.69 |
2.89 |
0.52 |
| 2.5% |
0.62 |
229.5 |
0.62 |
0.46 |
0.61 |
0.64 |
0.63 |
| 97.5% |
0.78 |
268.5 |
0.90 |
0.77 |
0.75 |
0.84 |
0.76 |
|
S0 vs S2
|
0.88 |
277.5 |
0.88 |
0.79 |
0.91 |
0.72 |
0.85 |
6.62 |
0.24 |
| 2.5% |
0.81 |
237.0 |
0.68 |
0.70 |
0.88 |
0.53 |
0.74 |
| 97.5% |
0.95 |
283.5 |
0.94 |
0.97 |
0.99 |
0.85 |
0.91 |
|
S0 vs S3
|
0.89 |
285.5 |
0.90 |
0.88 |
0.96 |
0.72 |
0390 |
9.19 |
0.14 |
| 2.5% |
0.80 |
281.5 |
0.86 |
0.75 |
0.92 |
0.62 |
0.85 |
| 97.5% |
0.99 |
314.5 |
0.98 |
1.00 |
1.00 |
0.91 |
0.96 |
|
S1 vs S2
|
0.73 |
282.5 |
0.66 |
0.76 |
0.87 |
0.47 |
0.69 |
2.22 |
0.37 |
| 2.5% |
0.63 |
240.0 |
0.44 |
0.48 |
0.80 |
0.40 |
0.58 |
| 97.5% |
0.83 |
322.0 |
0.89 |
0.94 |
0.96 |
0.68 |
0.81 |
|
S1 vs S3
|
0.81 |
306.5 |
0.83 |
0.83 |
0.94 |
0.59 |
0.83 |
4.88 |
0.20 |
| 2.5% |
0.70 |
287.5 |
0.72 |
0.67 |
0.90 |
0.47 |
0.75 |
| 97.5% |
0.93 |
322.5 |
0.91 |
0.96 |
0.99 |
0.74 |
0.91 |
|
S2 vs S3
|
0.67 |
307.5 |
0.52 |
0.83 |
0.81 |
0.56 |
0.65 |
1.72 |
0.32 |
| 2.5% |
0.52 |
303.0 |
0.42 |
0.33 |
0.65 |
0.50 |
0.58 |
| 97.5% |
0.82 |
354.5 |
0.97 |
0.96 |
0.95 |
0.89 |
0.81 |
Table S2 The p-values and 95% confidence intervals (CI) from Mann-Whitney U-tests comparing liver stiffness between steatosis grade groups.
| |
p-value
|
95% CI
|
| S0 vs S1–3 |
0.04 |
−2.2 to 0.0 |
| S0,1 vs S2,3 |
0.62 |
−1.5 to 0.9 |
| S0–2 vs S3 |
0.78 |
−2.2 to 1.5 |
| S0 vs S1 |
0.05 |
−2.6 to 0.0 |
| S1 vs S2 |
0.57 |
−1.1 to 2.2 |
| S2 vs S3 |
0.99 |
−2.9 to 2.2 |
Table S3 Regression models with and without body mass index (BMI) data.
| |
Estimate
|
2.5%
|
97.5%
|
p-value
|
|
Model (without BMI) including 224 patients
|
| Intercept |
221.66 |
196.46 |
246.85 |
<0.001 |
| Age |
0.24 |
−0.2 |
0.69 |
0.28 |
| Liver stiffness (kPa) |
−0.90 |
−1.57 |
−0.23 |
0.01 |
| Sex: male vs female |
14.9 |
1.28 |
28.51 |
0.03 |
| NAFLD: yes vs no |
23.65 |
3.25 |
44.06 |
0.02 |
| Steatosis (%) |
1.17 |
0.83 |
1.52 |
<0.001 |
| Adjusted R2
|
0.38 |
|
|
|
| Residual standard error |
48.4 (df = 218) |
|
|
|
Model without BMI but including only the 203 patients with BMI data available
|
| Intercept |
226.38 |
199.73 |
253.04 |
<0.001 |
| Age |
0.16 |
−0.31 |
0.62 |
0.50 |
| Liver stiffness (kPa) |
−0.84 |
−1.53 |
−0.15 |
0.02 |
| Sex: male vs. female |
12.87 |
−1.53 |
27.27 |
0.08 |
| NAFLD: yes vs no |
24.72 |
3.88 |
45.57 |
0.02 |
| Steatosis (%) |
1.16 |
0.8 |
1.51 |
<0.001 |
| Adjusted R2
|
0.39 |
|
|
|
| Residual standard error |
48.9 (df = 197) |
|
|
|
Model with BMI including the 203 patients with BMI data available
|
| Intercept |
159.21 |
113.71 |
204.7 |
<0.001 |
| Age |
0.16 |
−0.3 |
0.61 |
0.50 |
| Liver stiffness (kPa) |
−0.95 |
−1.62 |
−0.27 |
0.01 |
| Sex: male vs. female |
15.47 |
1.4 |
29.54 |
0.03 |
| NAFLD: yes vs no |
21.26 |
0.91 |
41.61 |
0.04 |
| Steatosis (%) |
0.96 |
0.6 |
1.32 |
<0.001 |
| BMI (mg/m2) |
2.69 |
1.19 |
4.18 |
<0.001 |
| Adjusted R2
|
0.42 |
|
|
|
| Residual standard error |
(47.5 (df = 196) |
|
|
Stephan Baumeler, MD, Division of Gastroenterology and Hepatology, Cantonal Hospital St Gallen, CH-9007 St Gallen, stephan.baumeler[at]kssg.ch
References
1
Angulo
P
. Nonalcoholic fatty liver disease. N Engl J Med. 2002;346(16):1221–31. doi:.https://doi.org/10.1056/NEJMra011775
2
Bellentani
S
. The epidemiology of non-alcoholic fatty liver disease. Liver Int. 2017;37(Suppl 1):81–4. doi:.https://doi.org/10.1111/liv.13299
3
Bedogni
G
,
Miglioli
L
,
Masutti
F
,
Castiglione
A
,
Crocè
LS
,
Tiribelli
C
, et al.
Incidence and natural course of fatty liver in the general population: the Dionysos study. Hepatology. 2007;46(5):1387–91. doi:.https://doi.org/10.1002/hep.21827
4
Diehl
AM
,
Day
C
. Nonalcoholic Steatohepatitis. N Engl J Med. 2018;378(8):781.
5
Targher
G
,
Day
CP
,
Bonora
E
. Risk of cardiovascular disease in patients with nonalcoholic fatty liver disease. N Engl J Med. 2010;363(14):1341–50. doi:.https://doi.org/10.1056/NEJMra0912063
6
Afendy
A
,
Kallman
JB
,
Stepanova
M
,
Younoszai
Z
,
Aquino
RD
,
Bianchi
G
, et al.
Predictors of health-related quality of life in patients with chronic liver disease. Aliment Pharmacol Ther. 2009;30(5):469–76. doi:.https://doi.org/10.1111/j.1365-2036.2009.04061.x
7
Younossi
ZM
,
Blissett
D
,
Blissett
R
,
Henry
L
,
Stepanova
M
,
Younossi
Y
, et al.
The economic and clinical burden of nonalcoholic fatty liver disease in the United States and Europe. Hepatology. 2016;64(5):1577–86. doi:.https://doi.org/10.1002/hep.28785
8
Younossi
ZM
,
Stepanova
M
,
Afendy
M
,
Fang
Y
,
Younossi
Y
,
Mir
H
, et al.
Changes in the prevalence of the most common causes of chronic liver diseases in the United States from 1988 to 2008. Clin Gastroenterol Hepatol. 2011;9(6):524–530.e1, quiz e60. doi:.https://doi.org/10.1016/j.cgh.2011.03.020
9
Brunt
EM
,
Ramrakhiani
S
,
Cordes
BG
,
Neuschwander-Tetri
BA
,
Janney
CG
,
Bacon
BR
, et al.
Concurrence of histologic features of steatohepatitis with other forms of chronic liver disease. Mod Pathol. 2003;16(1):49–56. doi:.https://doi.org/10.1097/01.MP.0000042420.21088.C7
10
Chan
AW
,
Wong
GL
,
Chan
HY
,
Tong
JH
,
Yu
YH
,
Choi
PC
, et al.
Concurrent fatty liver increases risk of hepatocellular carcinoma among patients with chronic hepatitis B. J Gastroenterol Hepatol. 2017;32(3):667–76. doi:.https://doi.org/10.1111/jgh.13536
11
Pekow
JR
,
Bhan
AK
,
Zheng
H
,
Chung
RT
. Hepatic steatosis is associated with increased frequency of hepatocellular carcinoma in patients with hepatitis C-related cirrhosis. Cancer. 2007;109(12):2490–6. doi:.https://doi.org/10.1002/cncr.22701
12
Persico
M
,
Iolascon
A
. Steatosis as a co-factor in chronic liver diseases. World J Gastroenterol. 2010;16(10):1171–6. doi:.https://doi.org/10.3748/wjg.v16.i10.1171
13
Ratziu
V
,
Charlotte
F
,
Heurtier
A
,
Gombert
S
,
Giral
P
,
Bruckert
E
, et al.; LIDO Study Group. Sampling variability of liver biopsy in nonalcoholic fatty liver disease. Gastroenterology. 2005;128(7):1898–906. doi:.https://doi.org/10.1053/j.gastro.2005.03.084
14
Merriman
RB
,
Ferrell
LD
,
Patti
MG
,
Weston
SR
,
Pabst
MS
,
Aouizerat
BE
, et al.
Correlation of paired liver biopsies in morbidly obese patients with suspected nonalcoholic fatty liver disease. Hepatology. 2006;44(4):874–80. doi:.https://doi.org/10.1002/hep.21346
15
European Association for the Study of the Liver (EASL), European Association for the Study of Diabetes (EASD), European Association for the Study of Obesity (EASO). EASL-EASD-EASO Clinical Practice Guidelines for the management of non-alcoholic fatty liver disease. J Hepatol. 2016;64(6):1388–402. doi:.https://doi.org/10.1016/j.jhep.2015.11.004
16
Imajo
K
,
Kessoku
T
,
Honda
Y
,
Tomeno
W
,
Ogawa
Y
,
Mawatari
H
, et al.
Magnetic Resonance Imaging More Accurately Classifies Steatosis and Fibrosis in Patients With Nonalcoholic Fatty Liver Disease Than Transient Elastography. Gastroenterology. 2016;150(3):626–637.e7. doi:.https://doi.org/10.1053/j.gastro.2015.11.048
17
Johnson
NA
,
Walton
DW
,
Sachinwalla
T
,
Thompson
CH
,
Smith
K
,
Ruell
PA
, et al.
Noninvasive assessment of hepatic lipid composition: Advancing understanding and management of fatty liver disorders. Hepatology. 2008;47(5):1513–23. doi:.https://doi.org/10.1002/hep.22220
18
Fransen van de Putte
D
,
Blom
R
,
van Soest
H
,
Mundt
M
,
Verveer
C
,
Arends
J
, et al.
Impact of Fibroscan on management of chronic viral hepatitis in clinical practice. Ann Hepatol. 2011;10(4):469–76.
19
Garg
H
,
Aggarwal
S
,
Shalimar
,
Yadav
R
,
Datta Gupta
S
,
Agarwal
L
, et al.
Utility of transient elastography (fibroscan) and impact of bariatric surgery on nonalcoholic fatty liver disease (NAFLD) in morbidly obese patients. Surg Obes Relat Dis. 2018;14(1):81–91. doi:.https://doi.org/10.1016/j.soard.2017.09.005
20
Ferraioli
G
,
Tinelli
C
,
De Silvestri
A
,
Lissandrin
R
,
Above
E
,
Dellafiore
C
, et al.
The clinical value of controlled attenuation parameter for the noninvasive assessment of liver steatosis. Liver Int. 2016;36(12):1860–6. doi:.https://doi.org/10.1111/liv.13207
21
de Lédinghen
V
,
Vergniol
J
,
Capdepont
M
,
Chermak
F
,
Hiriart
JB
,
Cassinotto
C
, et al.
Controlled attenuation parameter (CAP) for the diagnosis of steatosis: a prospective study of 5323 examinations. J Hepatol. 2014;60(5):1026–31. doi:.https://doi.org/10.1016/j.jhep.2013.12.018
22
Sasso
M
,
Miette
V
,
Sandrin
L
,
Beaugrand
M
. The controlled attenuation parameter (CAP): a novel tool for the non-invasive evaluation of steatosis using Fibroscan. Clin Res Hepatol Gastroenterol. 2012;36(1):13–20. doi:.https://doi.org/10.1016/j.clinre.2011.08.001
23
Cardoso
AC
,
Beaugrand
M
,
de Ledinghen
V
,
Douvin
C
,
Poupon
R
,
Trinchet
JC
, et al.
Diagnostic performance of controlled attenuation parameter for predicting steatosis grade in chronic hepatitis B. Ann Hepatol. 2015;14(6):826–36. doi:.https://doi.org/10.5604/16652681.1171762
24
Chan
WK
,
Nik Mustapha
NR
,
Mahadeva
S
. Controlled attenuation parameter for the detection and quantification of hepatic steatosis in nonalcoholic fatty liver disease. J Gastroenterol Hepatol. 2014;29(7):1470–6. doi:.https://doi.org/10.1111/jgh.12557
25
Chen
J
,
Wu
D
,
Wang
M
,
Chen
E
,
Bai
L
,
Liu
C
, et al.
Controlled attenuation parameter for the detection of hepatic steatosis in patients with chronic hepatitis B. Infect Dis (Lond). 2016;48(9):670–5. doi:.https://doi.org/10.3109/23744235.2016.1165860
26
de Lédinghen
V
,
Wong
GL
,
Vergniol
J
,
Chan
HL
,
Hiriart
JB
,
Chan
AW
, et al.
Controlled attenuation parameter for the diagnosis of steatosis in non-alcoholic fatty liver disease. J Gastroenterol Hepatol. 2016;31(4):848–55. doi:.https://doi.org/10.1111/jgh.13219
27
Shen
F
,
Zheng
RD
,
Mi
YQ
,
Wang
XY
,
Pan
Q
,
Chen
GY
, et al.
Controlled attenuation parameter for non-invasive assessment of hepatic steatosis in Chinese patients. World J Gastroenterol. 2014;20(16):4702–11. doi:.https://doi.org/10.3748/wjg.v20.i16.4702
28
Gaia
S
,
Carenzi
S
,
Barilli
AL
,
Bugianesi
E
,
Smedile
A
,
Brunello
F
, et al.
Reliability of transient elastography for the detection of fibrosis in non-alcoholic fatty liver disease and chronic viral hepatitis. J Hepatol. 2011;54(1):64–71. doi:.https://doi.org/10.1016/j.jhep.2010.06.022
29
Sasso
M
,
Beaugrand
M
,
de Ledinghen
V
,
Douvin
C
,
Marcellin
P
,
Poupon
R
, et al.
Controlled attenuation parameter (CAP): a novel VCTE™ guided ultrasonic attenuation measurement for the evaluation of hepatic steatosis: preliminary study and validation in a cohort of patients with chronic liver disease from various causes. Ultrasound Med Biol. 2010;36(11):1825–35. doi:.https://doi.org/10.1016/j.ultrasmedbio.2010.07.005
30
Castéra
L
,
Foucher
J
,
Bernard
PH
,
Carvalho
F
,
Allaix
D
,
Merrouche
W
, et al.
Pitfalls of liver stiffness measurement: a 5-year prospective study of 13,369 examinations. Hepatology. 2010;51(3):828–35. doi:.https://doi.org/10.1002/hep.23425
31
Bedossa
P
,
Poitou
C
,
Veyrie
N
,
Bouillot
JL
,
Basdevant
A
,
Paradis
V
, et al.
Histopathological algorithm and scoring system for evaluation of liver lesions in morbidly obese patients. Hepatology. 2012;56(5):1751–9. doi:.https://doi.org/10.1002/hep.25889
32
Bedossa
P
. Pathology of non-alcoholic fatty liver disease. Liver Int. 2017;37(Suppl 1):85–9. doi:.https://doi.org/10.1111/liv.13301
33
Bedossa
P
,
Poynard
T
; The METAVIR Cooperative Study Group. An algorithm for the grading of activity in chronic hepatitis C. Hepatology. 1996;24(2):289–93. doi:.https://doi.org/10.1002/hep.510240201
34
Robin
X
,
Turck
N
,
Hainard
A
,
Tiberti
N
,
Lisacek
F
,
Sanchez
JC
, et al.
pROC: an open-source package for R and S+ to analyze and compare ROC curves. BMC Bioinformatics. 2011;12(1):77. doi:.https://doi.org/10.1186/1471-2105-12-77
35TEAM RC. R: A Language and Environment for Statistical Computing. R Foundation for Statistical Computing. Vienna, Austria, 2017.
36
Sasso
M
,
Tengher-Barna
I
,
Ziol
M
,
Miette
V
,
Fournier
C
,
Sandrin
L
, et al.
Novel controlled attenuation parameter for noninvasive assessment of steatosis using Fibroscan(®): validation in chronic hepatitis C. J Viral Hepat. 2012;19(4):244–53. doi:.https://doi.org/10.1111/j.1365-2893.2011.01534.x
37
Chon
YE
,
Jung
KS
,
Kim
KJ
,
Joo
DJ
,
Kim
BK
,
Park
JY
, et al.
Normal controlled attenuation parameter values: a prospective study of healthy subjects undergoing health checkups and liver donors in Korea. Dig Dis Sci. 2015;60(1):234–42. doi:.https://doi.org/10.1007/s10620-014-3293-1
38
Karlas
T
,
Petroff
D
,
Sasso
M
,
Fan
JG
,
Mi
YQ
,
de Lédinghen
V
, et al.
Individual patient data meta-analysis of controlled attenuation parameter (CAP) technology for assessing steatosis. J Hepatol. 2017;66(5):1022–30. doi:.https://doi.org/10.1016/j.jhep.2016.12.022
39
Younossi
ZM
,
Stepanova
M
,
Rafiq
N
,
Makhlouf
H
,
Younoszai
Z
,
Agrawal
R
, et al.
Pathologic criteria for nonalcoholic steatohepatitis: interprotocol agreement and ability to predict liver-related mortality. Hepatology. 2011;53(6):1874–82. doi:.https://doi.org/10.1002/hep.24268
40
Argo
CK
,
Northup
PG
,
Al-Osaimi
AM
,
Caldwell
SH
. Systematic review of risk factors for fibrosis progression in non-alcoholic steatohepatitis. J Hepatol. 2009;51(2):371–9. doi:.https://doi.org/10.1016/j.jhep.2009.03.019
41
Negro
F
. Steatosis and insulin resistance in response to treatment of chronic hepatitis C. J Viral Hepat. 2012;19(Suppl 1):42–7. doi:.https://doi.org/10.1111/j.1365-2893.2011.01523.x
42
Negro
F
. Facts and fictions of HCV and comorbidities: steatosis, diabetes mellitus, and cardiovascular diseases. J Hepatol. 2014;61(1, Suppl):S69–78. doi:.https://doi.org/10.1016/j.jhep.2014.08.003
43
Leandro
G
,
Mangia
A
,
Hui
J
,
Fabris
P
,
Rubbia-Brandt
L
,
Colloredo
G
, et al.; HCV Meta-Analysis (on) Individual Patients’ Data Study Group. Relationship between steatosis, inflammation, and fibrosis in chronic hepatitis C: a meta-analysis of individual patient data. Gastroenterology. 2006;130(6):1636–42. doi:.https://doi.org/10.1053/j.gastro.2006.03.014
44
Adinolfi
LE
,
Rinaldi
L
,
Guerrera
B
,
Restivo
L
,
Marrone
A
,
Giordano
M
, et al.
NAFLD and NASH in HCV Infection: Prevalence and Significance in Hepatic and Extrahepatic Manifestations. Int J Mol Sci. 2016;17(6):803. doi:.https://doi.org/10.3390/ijms17060803
45
Mirandola
S
,
Osterreicher
CH
,
Marcolongo
M
,
Datz
C
,
Aigner
E
,
Schlabrakowski
A
, et al.
Microsomal triglyceride transfer protein polymorphism (-493G/T) is associated with hepatic steatosis in patients with chronic hepatitis C. Liver Int. 2009;29(4):557–65. doi:.https://doi.org/10.1111/j.1478-3231.2008.01892.x
46
Lonardo
A
,
Adinolfi
LE
,
Restivo
L
,
Ballestri
S
,
Romagnoli
D
,
Baldelli
E
, et al.
Pathogenesis and significance of hepatitis C virus steatosis: an update on survival strategy of a successful pathogen. World J Gastroenterol. 2014;20(23):7089–103. doi:.https://doi.org/10.3748/wjg.v20.i23.7089
47
Stevenson
HL
,
Utay
NS
. Hepatic steatosis in HCV-infected persons in the direct-acting antiviral era. Trop Dis Travel Med Vaccines. 2016;2(1):21. doi:.https://doi.org/10.1186/s40794-016-0038-5
48
Jung
KS
,
Kim
BK
,
Kim
SU
,
Chon
YE
,
Chun
KH
,
Kim
SB
, et al.
Factors affecting the accuracy of controlled attenuation parameter (CAP) in assessing hepatic steatosis in patients with chronic liver disease. PLoS One. 2014;9(6):e98689. doi:.https://doi.org/10.1371/journal.pone.0098689
49
Myers
RP
,
Pomier-Layrargues
G
,
Kirsch
R
,
Pollett
A
,
Duarte-Rojo
A
,
Wong
D
, et al.
Feasibility and diagnostic performance of the FibroScan XL probe for liver stiffness measurement in overweight and obese patients. Hepatology. 2012;55(1):199–208. doi:.https://doi.org/10.1002/hep.24624
50
Sasso
M
,
Audière
S
,
Kemgang
A
,
Gaouar
F
,
Corpechot
C
,
Chazouillères
O
, et al.
Liver Steatosis Assessed by Controlled Attenuation Parameter (CAP) Measured with the XL Probe of the FibroScan: A Pilot Study Assessing Diagnostic Accuracy. Ultrasound Med Biol. 2016;42(1):92–103. doi:.https://doi.org/10.1016/j.ultrasmedbio.2015.08.008
51
de Lédinghen
V
,
Hiriart
JB
,
Vergniol
J
,
Merrouche
W
,
Bedossa
P
,
Paradis
V
. Controlled Attenuation Parameter (CAP) with the XL Probe of the Fibroscan®: A Comparative Study with the M Probe and Liver Biopsy. Dig Dis Sci. 2017;62(9):2569–77. doi:.https://doi.org/10.1007/s10620-017-4638-3
52
Xiao
G
,
Zhu
S
,
Xiao
X
,
Yan
L
,
Yang
J
,
Wu
G
. Comparison of laboratory tests, ultrasound, or magnetic resonance elastography to detect fibrosis in patients with nonalcoholic fatty liver disease: A meta-analysis. Hepatology. 2017;66(5):1486–501. doi:.https://doi.org/10.1002/hep.29302
53
Park
CC
,
Nguyen
P
,
Hernandez
C
,
Bettencourt
R
,
Ramirez
K
,
Fortney
L
, et al.
Magnetic Resonance Elastography vs Transient Elastography in Detection of Fibrosis and Noninvasive Measurement of Steatosis in Patients With Biopsy-Proven Nonalcoholic Fatty Liver Disease. Gastroenterology. 2017;152(3):598–607.e2. doi:.https://doi.org/10.1053/j.gastro.2016.10.026