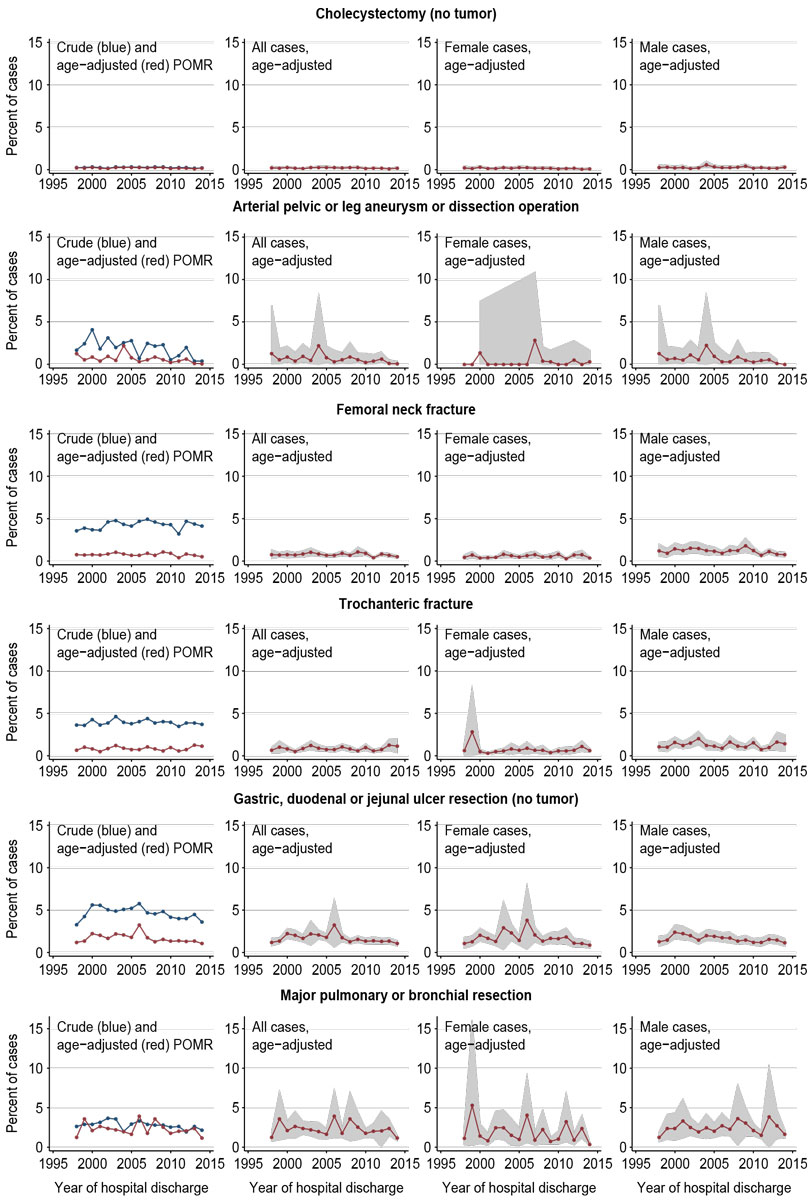
Figure 1 Decreasing POMR trends in low- to intermediate-risk IORs.
Note: POMR = perioperative mortality rate.
DOI: https://doi.org/10.4414/smw.2019.20034
Perioperative mortality rates (POMRs) are increasingly used as indicators of perioperative safety and quality at the regional and national levels of healthcare [1–4]. POMRs are usually reported as in-hospital or 30-day mortality rates, and are recommended by the World Health Organization [5] and the Lancet Commission on Global Surgery [6, 7] as core health indicators. POMRs that are based on routinely collected mortality data help to monitor system performance [1], to identify opportunities for improvement and to assess the overall effects of quality and safety interventions [8]. Studies have documented a substantial level of surgical in-hospital mortality (European average: 4%) [9]. This may be related, in part, to adverse events, which can affect up to 30% of surgical patients [10, 11]. More than 50% of such adverse events have been estimated to be preventable [12], which indicates room for quality improvement.
In Switzerland, the Federal Office of Public Health (FOPH) publishes national in-hospital mortality rates (CH-IQI) for a number of indicator conditions and procedures [13], whereas national data about complications and adverse events are limited [14]. Estimates of preventable patient harm and the strategies promoted to improve safety and quality in Switzerland [15] are often based on international literature [16, 17]. From a public health perspective, it is important to know the POMR trends for defined surgical populations, such as patients undergoing procedures belonging to the field of nationwide planned highly specialised medicine (HSM) [18]. Such trends are not a measure of overall perioperative quality, but they may help to identify defined surgical patient groups deviating from expected outcomes, to generate hypotheses about potentially modifiable risk factors and to set priorities for further investigations and the development of public health interventions at the national level.
Based on the general advances in perioperative care, an overall tendency of decreasing POMR trends should be expected. To our knowledge, national mortality trends for defined surgical populations based on the CH-IQI data have not been published to date. Therefore, we calculated and analysed such trends after age-standardisation of POMRs for different years for suitable surgical patient groups using the routine data published by the FOPH. By formally testing the hypothesis that long-term time trends of POMRs are generally decreasing, we investigated whether the trends of age-standardised POMRs for selected IORs were constant, increasing, or decreasing over the study period.
In line with Swiss federal law, the FOPH publishes freely accessible in-hospital mortality data on the internet for a number of medical indicator conditions and surgical indicator procedures (CH-IQI) [13]. We based this study on data that are freely accessible on the websites of the Swiss FOPH. We described time trends of POMRs after direct age standardisation using the European Standard Population [19]. In a second step, multivariable Poisson regression was used to formally analyse time trends of mortality rates while adjusting for age and sex distribution [20, 21].
Swiss hospitals are legally bound by the Federal Statistics Act of 1992 (BStatG) and the Federal Act on Health Insurance of 1996 (KVG) to report administrative and medical data (including in-hospital deaths, main diagnoses and main procedures) necessary for the publication of the medical statistics of hospitals (“Medizinische Statistik der Krankenhäuser”) by the Federal Statistical Office [22]. Mortality always defines a case as an “inpatient” hospital stay [22]. Data are transferred from hospitals to the Cantonal Statistical Offices, from there to the Federal Statistical Office and to the FOPH [13] (see appendix 1 for detailed description).
The FOPH publishes CH-IQIs for 49 selected indicator disease patterns and procedures. Depending on the clinical field, some CH-IQIs include information about case numbers, information about proportions (e.g., share of stroke patients treated in a stroke unit), special features (e.g., length of stay), or age- and sex-specific mortality [13]. In 2014, the CH-IQIs covered 46% of all inpatient cases and 63% of inpatient deaths [13]. CH-IQIs are published on a freely accessible website and present mortality as both indicator-specific mortality and as standardised mortality ratios (SMR) for individual hospitals [13, 23]. SMRs are calculated using indirect standardisation and age- and sex-adjustment as the ratio of observed deaths divided by the expected deaths for a given indicator, where the expected deaths is calculated as the number of indicator cases in the hospital multiplied by the nationwide age- and sex-adjusted mortality rate for the indicator (nationwide deaths divided by nationwide cases) [13]. SMRs can be compared for different indicators and hospitals using an internet tool [23]. The nationwide reference data are published separately as downloadable “.zip” files containing data in “.txt” format for each indicator [24, 25]. The 2013 data set contains data from 1998–2013 [24], and the 2014 data set contains data from 2004–2014 [25]. Data from 2004–2013 are overlapping in the two sets (for data checks, see below). The “.txt” file names contain the description and definition of the indicator according to the CH-IQI nomenclature [13, 24, 25]. For the purpose of the current analysis, these reference data sets were used. The observations in such data sets include information on calendar year, age group, sex, number of deaths per age group, number of cases (operations) per age group, and mortality rate (deaths/cases) per age group.
The study period was defined as the years 1998–2014 based on (1) the earliest availability of data, and (2) start of the research project in 2015/2016 (at this time, data were available until 2014). During the 17-year study period, new indicators were added by the FOPH, and the specifications for calculating the data are constantly revised [13, 26]. For the purposes of this analysis it was therefore important to choose indicators that (1) were present in both data sets used (see data sources 2013/2014, above), (2) contained data for all years of the study period, and (3) had their results calculated with the same specification version (V4 [26]).
In Switzerland, highly specialised medicine (HSM, including medical fields and interventions) is characterised by the following criteria: rarity, high potential for innovation, high personnel or technical costs, or complex treatment procedures [18]. In contrast to other fields of healthcare that are organised in Switzerland by the individual cantons, HSM is planned by the Swiss Conference of Cantonal Health Directors (GDK) on a nationwide level with the objective to concentrate such services in order to improve quality of care and to optimise efficiency [29]. Because of the relevance of HSM for this analysis of nationwide mortality data, HSM fields were reviewed in view of overlaps with the selected IORs [30, 31]. The only HSM field found to be relevant for this analysis was the field of complex highly specialised visceral surgery [30, 31]. In this field, procedure groups that overlapped with IORs fulfilling the inclusion criteria were pancreatic resections, oesophageal resections and low resection of the rectum. The latter constitutes a part of the IOR group “colorectal resections”, but cannot be separated within the FOPH data [31]. As complex and highly specialised visceral surgery had been assigned to HSM in 2013, the current analysis (1998–2014) may not capture trend-relevant effects of HSM-related interventions.
Based on these considerations, indicators were included if they met all of the following criteria: (1) were available in both the 2014 and 2013 FOPH data sets; (2) contained data for all years studied (1998–2014); (3) were calculated using the same specification version in all data sets (V4 [26]); (4) contained data about age- and sex-specific mortality; (5) contained data about a surgical operative procedure; (6) contained data about a non-cardiosurgical procedure; /7) contained data about an overall indicator of a surgical area or of a specific surgical operation subgroup if no overall indicator was available.
Indicators were excluded from the analysis if they met one or more exclusion criteria: (1) were not contained in the 2014 and 2013 FOPH data sets; (2) did not contain data for all years studied (1998–2014); (3) had not been calculated using the same specifications (V4 [26]) in all data sets; (4) contained no data about age- and sex-specific mortality; (5) contained no data about a surgical operative procedure (in contrast to nonsurgical procedures or conservative management); (6) contained data about a cardiosurgical (in contrast to non-cardiosurgical) procedure; (7) contained no data about an overall indicator of a surgical area (unless no overall indicator was available).
The inclusion and exclusion criteria were checked in an Excel spreadsheet using the indicator definitions in the .txt files for individual IORs.
All data used for this analysis are anonymised and open access. Their use for review, reanalysis and re-interpretation is not expected to pose ethical problems.
The “.zip” files containing the 2013 and 2014 datasets were downloaded from the FOPH website [24, 25]. From “.txt” files for each IOR, data were imported using the Stata command “import delimited” [32]. Data for 1998–2003 were imported from the 2013 set, and data for 2004–2014 from the 2014 set (for the FOPH data structure see above; for data checks of the overlapping data and exceptions see below). Notably, age groups with no cases (stratum population = 0) are omitted in the FOPH data sets [24, 25]. However, from the data collection process and the presentation on the FOPH website, it is clear that such observations are not “missing values” but are observations for which no cases have been reported according to the regular process (“omitted” rather than “missing” observations [33]). As the data analysis required complete age groups, missing groups were reconstructed (“rectangularised”) [34] to show zero counts for files with these missing age groups (for details, see appendix 1).
Direct standardisation produces a set of standardised rates by applying the age–sex specific rates from the study populations to a standard population [35]. In contrast to indirect standardisation, direct standardisation gives more accurate results in the case of small numbers of events in any of the age–sex groups of the population [35]. This method was chosen because the annual IOR populations compared in this analysis are independent populations, and the number of events (deaths) is relatively small (in the range of several percent). Directly standardised POMRs were calculated using the Stata command “distrate” [36, 37], which calculates the standardised rates and their 95% confidence intervals (CIs). To calculate the 95% CIs, we used the method proposed by Dobson, Kuulasmaa [38] and implemented in the “distrate” command [37]. For each IOR, we graphically show the overall crude and age-adjusted POMR and 95% boundaries [39, 40]. As a standard population, the 2013 European Standard Population (ESP) [19] was used after minimal adaptation to the FOPH groups (see appendix 1 for detailed description).
Poisson regression can be used to examine how incident rates [20] differ between groups of people or between different exposure levels by estimating the incident rate ratios adjusted for possible differences in age and sex distributions [20, 51]. Multivariable Poisson regression was used to formally assess how, for each IOR, POMR changed over calendar time [51]. “Total number of deaths” was used as the outcome variable, “year” as independent variable and “pop” (the total number of operations) as offset in the regression equation. Rather than assuming a linear relationship between calendar year and the log POMR over the entire study period of 17 years (1998–2014), we generated three consecutive time intervals based on tertiles of time [52]. The first interval comprised the years 1998–2003 (6 years), the second comprised the years 2004–2009 (6 years), and the third comprised the years 2010–2014 (5 years). In the first step, the first interval served as reference time period, with which the second and third intervals were compared. In a second analysis, we compared the early and the late period to the middle period. In a third step, sex-specific analyses of the age-adjusted effect of time on POMRs were performed. All steps of the Poisson regression were first completed for crude POMRs, and then for age- and sex-adjusted POMRs. We report the regression results as incident rate ratios (IRRs) with 95% confidence intervals (CIs) [51, 53, 54].
Presentation of the results was determined after initial post hoc exploration of the findings. Ranking was achieved by sorting the IORs using Stata by (1) the age-adjusted POMR time-trend direction (Poisson-regression [20, 51] results for IRR of time interval 3 compared with interval 2 – decreasing, unchanged, or increasing [21]) over the study period of 17 years, and (2) by incremental average directly age-adjusted [36, 37] POMR levels (risk levels) over the entire study period. The IRR of the late time interval 3 compared with time interval 2 was favoured as a ranking criterion over the IRR of time interval 2 compared to the early time interval 1, because the later time intervals appear more relevant for current developments in the perioperative setting.
For the included IORs, the .txt files for both the 2013 and 2014 data sets were visually checked. In addition, the data overlapping both data sets (for the years 2004–2013) were checked for consistency by subtracting the corresponding data sets from one another in Excel, and these were accepted if the result was 0. Inconsistencies and missing data in the 2014 data set were found for IOR “G.3.1. hysterectomy”. In view of this inconsistency, only the data from the 2013 data set were used for the analysis except the regularly included data for the year 2014.
The following software was used: Data import – TextEdit® version 1.12 (329) Copyright© 1995–2016 Apple Inc., Cupertino, CA, U.S.; Microsoft Excel® for Mac, version 16.15 (180709) Copyright© 2018 Microsoft Corp., Redmond, WA, U.S.; Adobe Acrobat Reader DC, Continuous Release, version 2018.011.20055, Copyright© 2003–2017 Solid Documents Limited, Nelson NZ; Preview Version 9.0 (909.18) Copyright© 2002–2016 Apple Inc. Data analysis: Stata/IC 14.2 for Mac, Copyright© 1985–2015 StataCorp LLC, College Station, TX, U.S. Manuscript preparation: Microsoft Word® for Mac, version 16.15 (180709) Copyright© 2018 Microsoft Corp. Literature references: EndNote™ X8.2, Clarivate Analytics, Philadelphia, PA, U.S.
Detailed results are given in figures 1–4 , and table 2 and table 3.
The FOPH CH-IQI comprised 347 indicators in 2014. Based on the inclusion and exclusion criteria, 325 indicators could not be included: 232 indicators contained no data about age-and sex-specific mortality; 14 indicators contained data about cardiosurgical procedures; 47 indicators contained data about nonsurgical procedures/conditions; 16 indicators contained data about a surgical subgroup (when an overall indicator was available); and 16 indicators did not contain data for all years studied (1998–2014). Thus, 22 indicators were included in the analysis (table 1).
Table 1 Indicator operations (IOR) used by the Federal Office of Public Health (FOPH) and selected for time trend analysis.
| Selected indicator operations | Original German FOPH indicator name | FOPH indicator code | Cases 1998–2014 | % (all) | Deaths 1998–2014 | Crude POMR (%) |
|---|---|---|---|---|---|---|
| Cholecystectomy (no tumour) | Cholezystektomie bei Gallensteinen und Cholezystitis, ohne Tumor, Mortalität | E.1.1.M | 183667 | 11.8 | 459 | 0.2 |
| Arterial pelvic or leg aneurysm or dissection operation | OP an Becken-/Beinarterien bei Aneurysma/Dissektion, Mortalität | F.3.7.M | 2845 | 0.2 | 48 | 1.7 |
| Femoral neck fracture | Schenkelhalsfraktur (Alter >19), Mortalität | I.3.1.M | 85313 | 5.5 | 3623 | 4.2 |
| Trochanteric fracture | Pertrochantäre Fraktur (Alter >19), Mortalität | I.3.8.M | 74016 | 4.7 | 2887 | 3.9 |
| Gastric, duodenal or jenjunal ulcer resection (no tumour) | HD Ulcus von Magen, Duodenum oder Jejunum, ohne Tumor, Mortalitä" | E.5.5.M | 39871 | 2.6 | 1850 | 4.6 |
| Major pulmonary or bronchial resection | Grössere Resektionen von Lunge oder Bronchien insgesamt, Mortalität | D.4.1.M | 32505 | 2.1 | 878 | 2.7 |
| TUR prostate | Prostata-TUR, Mortalität | H.4.1.M | 140853 | 9.0 | 287 | 0.2 |
| Hernia repair without intestinal operation | Herniotomie ohne OP am Darm, Mortalität | E.2.1.M | 340083 | 21.8 | 395 | 0.1 |
| Hysterectomy (benign disease) | Hysterektomie bei gutartigen Erkrankungen (Alter >14), Mortalität | G.3.1.M | 166522 | 10.7 | 86 | 0.1 |
| Extracranial vascular operation | Extrakranielle Gefäss-OP, Mortalität | F.1.1.M | 14324 | 0.9 | 88 | 0.6 |
| Nephrectomy | Vollständige Nephrektomie, Mortalität | H.1.1.M | 15778 | 1.0 | 221 | 1.4 |
| Amputation foot (no trauma) | Amputation im Fussbereich, kein Trauma, Mortalität | F.4.1.M | 25420 | 1.6 | 710 | 2.8 |
| Hernia repair with intestinal operation | Herniotomie mit OP am Darm, Mortalität | E.2.2.M | 4519 | 0.3 | 254 | 5.6 |
| Gastric carcinoma resection | Magenresektionen (ohne Ösophaguseingriff) bei Magenkarzinom, Mortalität | E.5.2.M | 5659 | 0.4 | 259 | 4.6 |
| Nonruptured abdominal aortic aneurysm (open operation) | Offene abdominale OP bei Aortenaneurysma nicht rupturiert, Mortalität | F.2.2.M | 5961 | 0.4 | 238 | 4.0 |
| Arterial pelvic or leg thromboembolic operation | OP an Becken-/Beinarterien bei arterieller Embolie/Thrombose, Mortalität | F.3.5.M | 6437 | 0.4 | 351 | 5.5 |
| Colorectal resection | Kolorektale Resektionen insgesamt, Mortalität | E.4.1.M | 147417 | 9.4 | 6771 | 4.6 |
| Pancreatic resection | Pankreasresektionen insgesamt (ohne Transplantation, Alter >19), Mortalität | E.7.1.M | 10071 | 0.6 | 622 | 6.2 |
| Complex oesophageal procedure | Komplexe Eingriffe am Ösophagus, Mortalität | E.6.1.M | 4455 | 0.3 | 310 | 7.0 |
| Hip endoprosthesis (first implant, no fracture) | Hüft-Endoprothese-Erstimplantation (nicht bei Frakturen), Mortalität | I.1.1.M | 238940 | 15.3 | 503 | 0.2 |
| Cystectomy | Entfernung der Harnblase (Zystektomie), Mortalität | H.3.5.M | 6416 | 0.4 | 198 | 3.1 |
| Amputation lower limb (no trauma) | Amputation untere Extremität, kein Trauma, Mortalität | F.4.2.M | 9940 | 0.6 | 1102 | 11.1 |
| Total 22 indicators | 1561012 | 100.0 | 22140 | 1.4 |
The analysis of the selected 22 IORs included 1,561,012 operations (cases) and 22,140 in-hospital deaths, with an overall crude POMR of 1.42% over the study period 1998–2014. For 2014, all 22 IORs together represented 110,300 operations and 1506 deaths. Because a total of 63,938 people died in Switzerland in 2014, according to the Federal Statistical Office [55], the deaths reflected by these IORs represented 2.4% of the overall mortality in Switzerland in 2014. IOR groups were categorised according to the direction of POMR trends and to risk levels (mean age-adjusted POMR 1998–2014). The results of the direct age-adjustment and analysis of POMR time trends are presented in table 2 and table 3, and graphically visualised in figures 1–4 . The HSM-relevant [18, 31] IORs pancreatic resection, oesophageal resection, and low resection of the rectum (part of the IOR group colorectal resections) fell into the IOR result group that had an unchanged time trend.
Table 2 Summary results of POMR trends.
| Groups categorised by trend direction and risk | Risk (mean age-adjusted POMR 1998–2014, (%)) | Cases | % of cases | Deaths | % of deaths | Crude POMR (%) |
|---|---|---|---|---|---|---|
| 1. Decreasing POMR trends in low to intermediate risk IOR | 0.2–2.2 | 418217 | 26.8 | 9745 | 44.0 | 2.3 |
| 2. Unchanged POMR trends in low risk IOR | 0.1–0.9 | 702980 | 45.0 | 1787 | 8.1 | 0.3 |
| 3. Unchanged POMR trends in intermediate risk IOR | 1.7–3.8 | 184519 | 11.8 | 8805 | 39.8 | 4.8 |
| 4. Increasing POMR trends in low to high risk IOR | 0.1–5.2 | 255296 | 16.4 | 1803 | 8.1 | 0.7 |
| Unchanged or increasing | 0.1–5.2 | 1143186 | 73.2 | 12395 | 56.0 | 1.1 |
| All groups (1–4) | 0.1–5.2 | 1561012 | 100.0 | 22140 | 100.0 | 1.4 |
POMR = perioperative mortality rate; IOR = indicator operation
Table 3 Decreasing, unchanged, and increasing POMR time trends 1998–2014 for 22 indicator operations with various perioperative risk.
| Indicator operation (IOR) | Cases | Deaths | POMR crude (%) | POMR age-adj (%) | Adjustment | IRR 1 | IRR 2 | 95% CI | p-value | IRR 3.1 | 95% CI | p-value | IRR 3.2 | 95% CI | p-value | IRR F/M | 95% CI | p-value |
|---|---|---|---|---|---|---|---|---|---|---|---|---|---|---|---|---|---|---|
| 1. Decreasing POMR trends in low to intermediate risk IOR | ||||||||||||||||||
| Cholecystectomy (no tumour) | 183,667 | 459 | 0.2 | 0.2 | Crude | 1 | 1.18 | 0.95–1.48 | 0.134 | 0.84 | 0.66–1.07 | 0.159 | 0.709 | 0.568–0.885 | 0.002 | |||
| Age / Sex | 1 | 1.11 | 0.89–1.39 | 0.337 | 0.75 | 0.58–0.95 | 0.018 | 0.669 | 0.536–0.835 | 0.000 | 0.58 | 0.48–0.69 | 0.000 | |||||
| Arterial pelvic or leg aneurysm or dissection operation | 2845 | 48 | 1.7 | 0.6 | Crude | 1 | 0.84 | 0.43–1.62 | 0.595 | 0.35 | 0.17–0.76 | 0.007 | 0.425 | 0.209–0.863 | 0.018 | |||
| Age / Sex | 1 | 0.75 | 0.39–1.47 | 0.409 | 0.34 | 0.16–0.72 | 0.005 | 0.445 | 0.219–0.906 | 0.026 | 0.99 | 0.44–2.25 | 0.987 | |||||
| Femoral neck fracture | 85,313 | 3623 | 4.2 | 0.8 | Crude | 1 | 1.10 | 1.01–1.19 | 0.024 | 1.01 | 0.93–1.10 | 0.818 | 0.920 | 0.851–0.993 | 0.033 | |||
| Age / Sex | 1 | 1.05 | 0.97–1.14 | 0.264 | 0.94 | 0.87–1.02 | 0.159 | 0.900 | 0.833–0.972 | 0.007 | 0.50 | 0.47–0.54 | 0.000 | |||||
| Trochanteric fracture | 74,016 | 2887 | 3.9 | 0.9 | Crude | 1 | 1.01 | 0.92–1.11 | 0.835 | 0.95 | 0.87–1.04 | 0.266 | 0.940 | 0.863–1.025 | 0.159 | |||
| Age / Sex | 1 | 0.96 | 0.88–1.06 | 0.447 | 0.88 | 0.80–0.96 | 0.005 | 0.910 | 0.835–0.992 | 0.032 | 0.42 | 0.39–0.46 | 0.000 | |||||
| Gastric, duodenal or jejunal ulcer resection (no tumour) | 39,871 | 1850 | 4.6 | 1.7 | Crude | 1 | 1.04 | 0.93–1.16 | 0.495 | 0.84 | 0.75–0.94 | 0.003 | 0.808 | 0.722–0.904 | 0.000 | |||
| Age / Sex | 1 | 1.03 | 0.92–1.15 | 0.619 | 0.78 | 0.69–0.87 | 0.000 | 0.755 | 0.674–0.845 | 0.000 | 0.91 | 0.83–1.00 | 0.048 | |||||
| Major pulmonary or bronchial resection | 32,505 | 878 | 2.7 | 2.2 | Crude | 1 | 0.88 | 0.74–1.04 | 0.126 | 0.74 | 0.63–0.88 | 0.000 | 0.845 | 0.724–0.986 | 0.032 | |||
| Age / Sex | 1 | 0.88 | 0.74–1.04 | 0.136 | 0.73 | 0.62–0.86 | 0.000 | 0.830 | 0.711–0.968 | 0.018 | 0.59 | 0.51–0.69 | 0.000 | |||||
| 2. Unchanged POMR trends in low risk IOR | ||||||||||||||||||
| TUR prostate | 140,853 | 287 | 0.2 | 0.1 | Crude | 1 | 0.97 | 0.74–1.29 | 0.853 | 0.91 | 0.67–1.22 | 0.517 | 0.931 | 0.705–1.231 | 0.617 | |||
| Age / Sex | 1 | 0.98 | 0.74–1.29 | 0.871 | 0.89 | 0.66–1.20 | 0.447 | 0.912 | 0.690–1.206 | 0.519 | 11.08 | 2.74–44.79 | 0.001 | |||||
| Hernia repair without intestinal operation | 340,083 | 395 | 0.1 | 0.1 | Crude | 1 | 0.97 | 0.76–1.24 | 0.799 | 0.97 | 0.76–1.24 | 0.809 | 1.001 | 0.792–1.265 | 0.993 | |||
| Age / Sex | 1 | 0.93 | 0.73–1.19 | 0.563 | 0.90 | 0.70–1.16 | 0.408 | 0.967 | 0.766–1.222 | 0.781 | 1.86 | 1.51–2.29 | 0.000 | |||||
| Hysterectomy (benign disease) | 166,522 | 86 | 0.1 | 0.1 | Crude | 1 | 0.79 | 0.49–1.28 | 0.342 | 0.58 | 0.33–1.02 | 0.057 | 0.735 | 0.415–1.301 | 0.291 | |||
| Age / Sex | 1 | 0.74 | 0.46–1.20 | 0.221 | 0.54 | 0.31–0.94 | 0.030 | 0.729 | 0.411–1.293 | 0.280 | 0.11 | 0.01–0.80 | 0.029 | |||||
| Extracranial vascular operation | 14,324 | 88 | 0.6 | 0.6 | Crude | 1 | 0.90 | 0.54–1.47 | 0.663 | 0.73 | 0.42–1.24 | 0.244 | 0.810 | 0.485–1.354 | 0.422 | |||
| Age / Sex | 1 | 0.88 | 0.53–1.46 | 0.625 | 0.67 | 0.39–1.16 | 0.155 | 0.761 | 0.455–1.273 | 0.299 | 1.06 | 0.68–1.66 | 0.791 | |||||
| Nephrectomy | 15,778 | 221 | 1.4 | 0.8 | Crude | 1 | 0.95 | 0.69–1.31 | 0.754 | 0.99 | 0.71–1.38 | 0.940 | 1.039 | 0.755–1.430 | 0.814 | |||
| Age / Sex | 1 | 0.91 | 0.66–1.25 | 0.561 | 0.85 | 0.61–1.19 | 0.354 | 0.938 | 0.681–1.293 | 0.696 | 0.73 | 0.55–0.96 | 0.024 | |||||
| Amputation foot (no trauma) | 25,420 | 710 | 2.8 | 0.9 | Crude | 1 | 0.89 | 0.74–1.07 | 0.214 | 1.00 | 0.83–1.20 | 0.965 | 1.121 | 0.943–1.333 | 0.195 | |||
| Age / Sex | 1 | 0.85 | 0.70–1.02 | 0.081 | 0.90 | 0.75–1.08 | 0.260 | 1.063 | 0.893–1.264 | 0.492 | 0.67 | 0.57–0.79 | 0.000 | |||||
| 3. Unchanged POMR trends in intermediate risk IOR | ||||||||||||||||||
| Hernia repair with intestinal operation | 4519 | 254 | 5.6 | 1.7 | Crude | 1 | 1.22 | 0.86–1.74 | 0.266 | 1.18 | 0.83–1.66 | 0.359 | 0.962 | 0.733–1.263 | 0.780 | |||
| Age / Sex | 1 | 1.19 | 0.84–1.70 | 0.324 | 1.25 | 0.89–1.77 | 0.202 | 1.049 | 0.798–1.377 | 0.733 | 0.83 | 0.64–1.06 | 0.140 | |||||
| Gastric carcinoma resection | 5659 | 259 | 4.6 | 1.8 | Crude | 1 | 1.14 | 0.86–1.51 | 0.370 | 0.85 | 0.61–1.17 | 0.310 | 0.743 | 0.544–1.015 | 0.062 | |||
| Age / Sex | 1 | 1.17 | 0.88–1.55 | 0.283 | 0.86 | 0.62–1.19 | 0.370 | 0.739 | 0.541–1.009 | 0.057 | 0.60 | 0.46–0.78 | 0.000 | |||||
| Unruptured abdominal aortic aneurysm (open operation) | 5961 | 238 | 4.0 | 1.9 | Crude | 1 | 0.87 | 0.63–1.19 | 0.388 | 0.96 | 0.69–1.33 | 0.785 | 1.099 | 0.816–1.481 | 0.536 | |||
| Age / Sex | 1 | 0.83 | 0.60–1.14 | 0.245 | 0.90 | 0.65–1.26 | 0.551 | 1.093 | 0.810–1.474 | 0.560 | 1.23 | 0.88–1.72 | 0.232 | |||||
| Arterial pelvic or leg thromboembolic operation | 6437 | 351 | 5.5 | 2.1 | Crude | 1 | 1.08 | 0.80–1.46 | 0.626 | 1.09 | 0.81–1.45 | 0.576 | 1.007 | 0.797–1.273 | 0.954 | |||
| Age / Sex | 1 | 1.10 | 0.81–1.49 | 0.536 | 1.06 | 0.79–1.41 | 0.715 | 0.959 | 0.758–1.213 | 0.724 | 1.01 | 0.81–1.27 | 0.904 | |||||
| Colorectal resection | 147,417 | 6771 | 4.6 | 2.2 | Crude | 1 | 1.13 | 1.06–1.20 | 0.000 | 1.17 | 1.10–1.25 | 0.000 | 1.041 | 0.985–1.100 | 0.154 | |||
| Age / Sex | 1 | 1.12 | 1.06–1.19 | 0.000 | 1.15 | 1.08–1.23 | 0.000 | 1.027 | 0.972–1.085 | 0.336 | 0.75 | 0.72–0.79 | 0.000 | |||||
| Pancreatic resection | 10,071 | 622 | 6.2 | 3.4 | Crude | 1 | 1.09 | 0.89–1.35 | 0.406 | 1.19 | 0.97–1.46 | 0.099 | 1.088 | 0.910–1.301 | 0.352 | |||
| Age / Sex | 1 | 1.02 | 0.83–1.27 | 0.823 | 1.08 | 0.87–1.32 | 0.490 | 1.050 | 0.878–1.256 | 0.591 | 0.74 | 0.63–0.87 | 0.000 | |||||
| Complex oesophageal procedure | 4455 | 310 | 7.0 | 3.8 | Crude | 1 | 1.05 | 0.80–1.37 | 0.747 | 0.88 | 0.67–1.16 | 0.367 | 0.841 | 0.642–1.102 | 0.209 | |||
| Age / Sex | 1 | 0.97 | 0.74–1.27 | 0.825 | 0.80 | 0.60–1.06 | 0.120 | 0.826 | 0.630–1.082 | 0.165 | 0.99 | 0.77–1.28 | 0.941 | |||||
| 4. Increasing POMR trends in low to high risk IOR | ||||||||||||||||||
| Hip endoprosthesis (first implant, no fracture) | 238,940 | 503 | 0.2 | 0.1 | Crude | 1 | 0.58 | 0.46–0.72 | 0.000 | 0.76 | 0.62–0.94 | 0.010 | 1.317 | 1.061–1.635 | 0.013 | |||
| Age / Sex | 1 | 0.57 | 0.46–0.72 | 0.000 | 0.72 | 0.59–0.89 | 0.002 | 1.261 | 1.016–1.566 | 0.036 | 0.73 | 0.61–0.87 | 0.000 | |||||
| Cystectomy | 6416 | 198 | 3.1 | 1.3 | Crude | 1 | 1.00 | 0.67–1.50 | 0.990 | 1.80 | 1.25–2.61 | 0.002 | 1.798 | 1.302–2.484 | 0.000 | |||
| Age / Sex | 1 | 0.93 | 0.62–1.39 | 0.714 | 1.58 | 1.09–2.29 | 0.017 | 1.701 | 1.231–2.352 | 0.001 | 0.98 | 0.72–1.35 | 0.924 | |||||
| Amputation lower limb (no trauma) | 9940 | 1102 | 11.1 | 5.2 | Crude | 1 | 1.01 | 0.88–1.17 | 0.851 | 1.24 | 1.07–1.44 | 0.004 | 1.223 | 1.056–1.417 | 0.007 | |||
| Age / Sex | 1 | 1.05 | 0.91–1.21 | 0.517 | 1.28 | 1.10–1.48 | 0.001 | 1.218 | 1.051–1.410 | 0.009 | 0.91 | 0.80–1.03 | 0.146 | |||||
| Total | 1,561,012 | 22,140 | 1.4 | |||||||||||||||
POMR = perioperative mortality rate; IOR = indicator operation; age-adj = age-adjusted; IRR = incident-rate ratio; IRR 1 = reference for comparing three consecutive time intervals and is therefore 1 for first period; IRR 2 = IRR for comparison time intervals 2/1; IRR 3.1 = IRR for comparing time intervals 3/1; IRR 3.2 = IRR for comparing time intervals 3/2; 95% CI = 95% confidence interval; IRR F/M = IRR for testing impact of female (versus male) sex on POMR; p = two-tailed p-value.
Figure 1 Decreasing POMR trends in low- to intermediate-risk IORs.
Note: POMR = perioperative mortality rate.
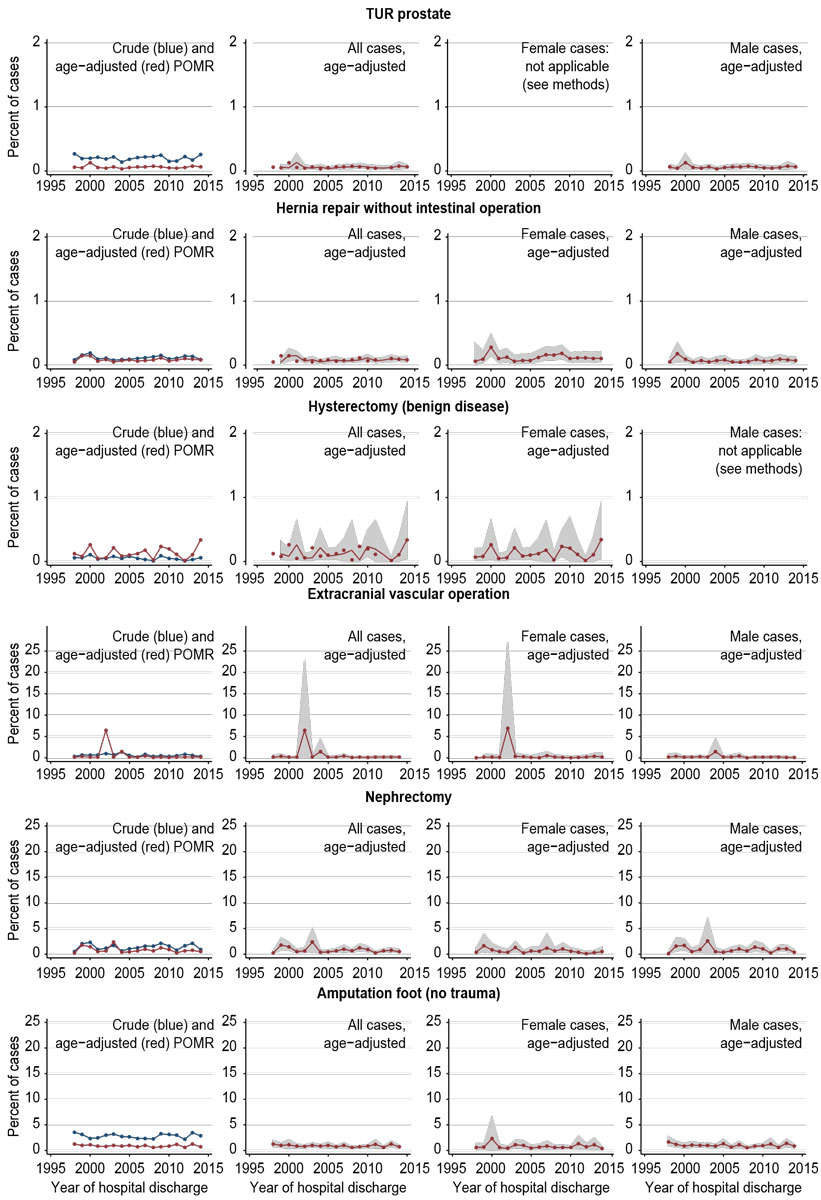
Figure 2 Unchanged POMR trends in low-risk IORs.
Note: POMR = perioperative mortality rate. Sex-specific analyses were not completed for sex-specific operations (hysterectomy, TUR prostate; see methods section). Note that different percentage scales are used for the upper three and the lower three IORs.
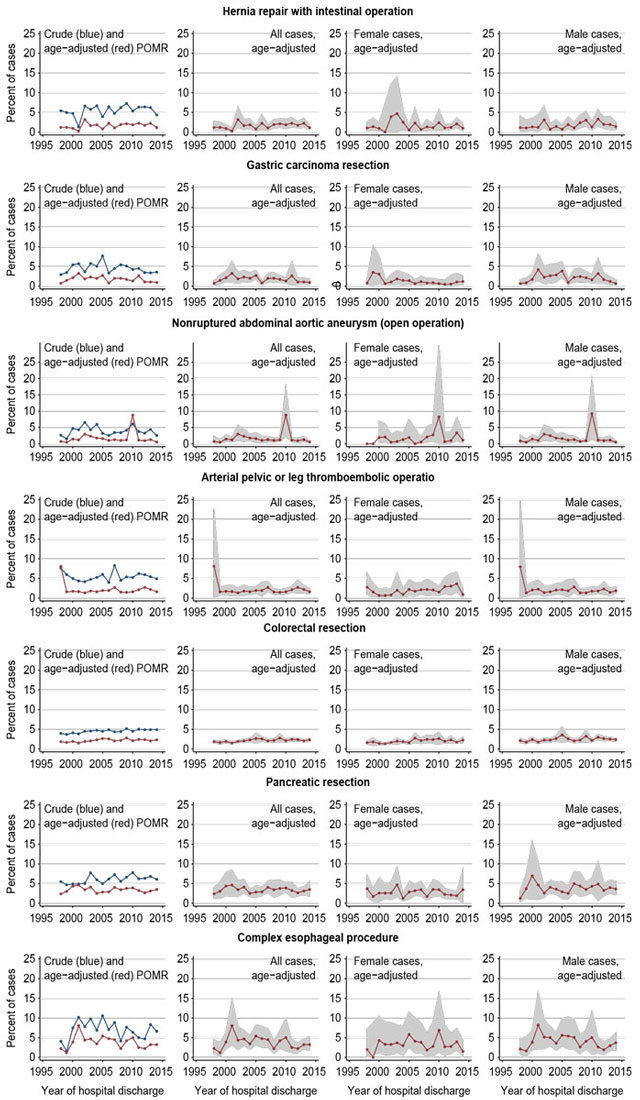
Figure 3 Unchanged POMR trends in intermediate-risk IORs.
Note: POMR = perioperative mortality rate.
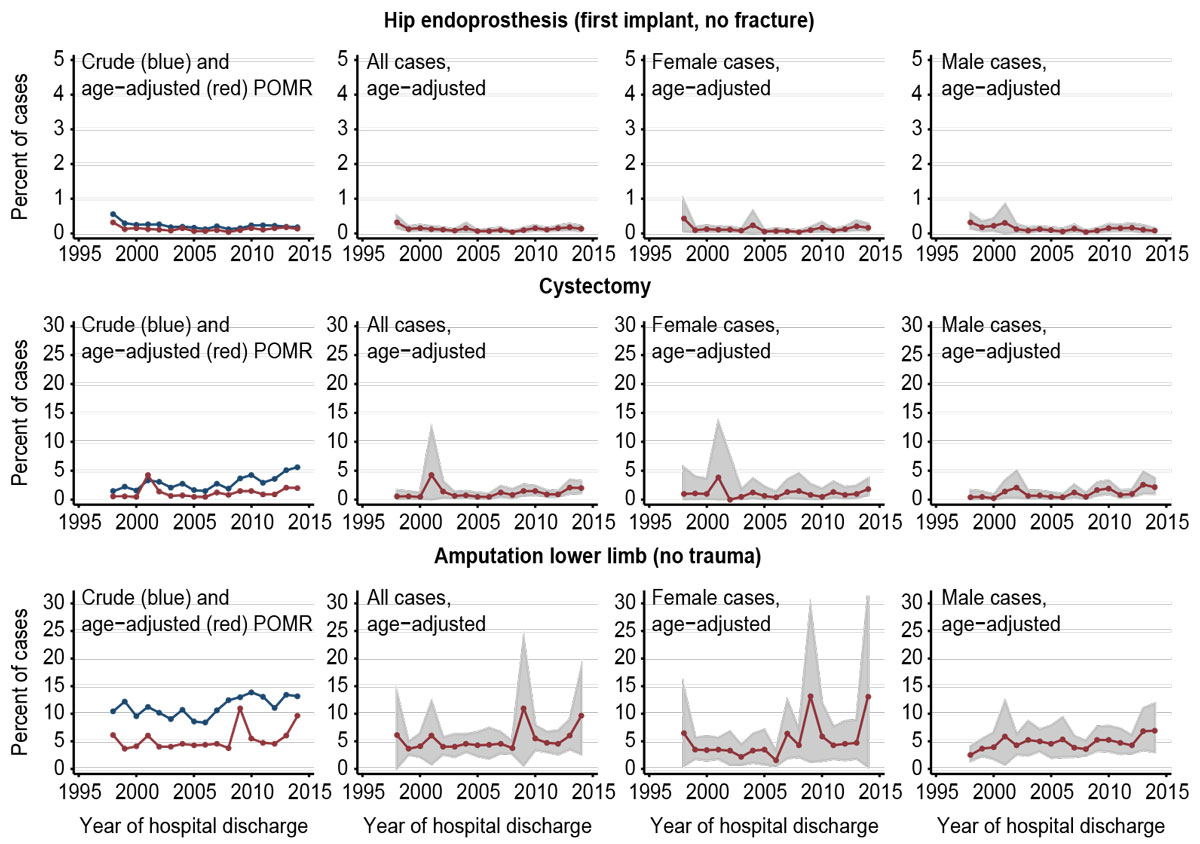
Figure 4 Increasing POMR trends in low- to high-risk IORs.
Note: POMR = perioperative mortality rate. Note also that different percentage scales are used for the first IOR and the second and third IOR.
Sex-specific IORs (hysterectomy, TUR prostate) included 307,375 operations (19.7% of all operations). Of the remaining 20 IORs, including 1,253,637 operations (80.3% of all operations), 11 IORs including 858,657 operations (68.5% of remaining operations) had significantly lower POMRs in females; 8 IORs including 54,897 operations (4.4% of remaining operations) had no sex difference. POMRs were significantly higher for females in the IOR of hernia repair without intestinal operation which included 340,083 operations (27.1% of remaining operations; IRR 1.86, 95% CI 1.51–2.29).
We present the time trends of age-standardised perioperative in-hospital mortality rates (POMRs) for selected noncardiac surgical indicator operations (IORs) published by the Swiss FOPH for the years 1998–2014 for 22 noncardiac surgical IORs, representing 1,561,012 individual operations and 22,140 in-hospital deaths, and corresponding to an overall crude POMR of 1.42%. We found that the long-term POMR time trends are not generally decreasing in Switzerland. In contrast, for a substantial number of IORs the POMRs did not change, and a few POMRs even increased. Female sex was associated with a lower POMR in most IORs. The methods used represent a way of calculating and presenting POMR trends that could be adopted for routine use.
The strengths of our study are the completeness of the national data sets for IORs, the availability of data for all years of the study period for selected IORs, and the better comparability of yearly populations after direct age standardisation. However, a number of limitations need to be considered [56]. First, operations, not patients, represent the individual observations in the publicly available FOPH data, and hence the denominator for the POMR. Because one patient could have represented several cases in some IORs, a case-based POMR may theoretically underestimate a patient-based POMR. Second, the results may be affected by bias – selection bias may have been introduced by selecting IORs according to the inclusion and exclusion criteria. In particular, IORs for which reporting began after 1998 were not included. Within the individual IOR data, bias may have been introduced during the reporting process. Third, IOR data may have been significantly influenced by varying coding practices in hospitals, for example after the introduction of diagnosis-related group (DRG)-based quality reporting and reimbursement in Switzerland on January 1, 2012 (SwissDRG) [57]. Indeed, several international studies have documented faulty, missing or incorrect coding of diagnoses and procedures after introduction of DRG [58–60], restructuring of procedure codes [61], and changes in comorbidity coding [62]. After the introduction of SwissDRG in 2012, readmission within 18 days leads to coding of the readmission as one hospital stay or case together with the initial hospitalisation [63]. Whereas DRG-related comorbidity coding is unlikely to have impacted our results significantly (comorbidity data were not part of the analysed data sets), the changed readmission coding might have influenced our results: If a patient died in hospital after readmission, this may have escaped coding as POM before introduction of SwissDRG, but should have been captured afterwards. This coding rule may have led to higher in-hospital POMRs in the last of the three time intervals we defined. However, this potential impact is not related to the type of IOR and might affect all POMR trends, not only increasing POMR trends. Notably, a recent study reported no relationship between SwissDRG introduction and intensive care unit mortality in Switzerland [64]. The data sets analysed in our analysis, however, did not allow us to further investigate these issues. Fourth, the data and results may have been affected by changes in the organisation and delivery of healthcare. In Switzerland, the mandatory reporting of quality indicators is limited to inpatients. A recent project to extend such reporting to the ambulatory setting has not yet been fully implemented [65, 66], and procedures may have been shifted from the inpatient to the ambulatory setting in Switzerland during the study period, in line with international trends (e.g., TUR prostate [67], hysterectomy [68], hip arthroplasty [69], colectomy [70], cholecystectomy [71]). Furthermore, in-hospital mortality (used for FOPH IOR [13]) may overestimate [72] or underestimate [73] 30-day mortality [72, 74]. Postoperative patient transfers to secondary institutions may have affected the data and reporting [75]. Fifth, owing to the limitations of the FOPH data used in this analysis, we could not assess if trends differed for emergency interventions compared to non-emergency interventions.
The results of this analysis should be interpreted cautiously in light of the study objectives and limitations, and pre-existing evidence [75].The study objective was to analyse POMR time trends for selected IORs at the national level from a public health perspective on monitoring the overall performance of the healthcare system [1]. A comprehensive exploration of the specific conditions and causes of individual IOR trends is beyond the objectives of this study and of the presented monitoring approach, and should be addressed by more detailed investigations [7]. Indeed, the POMR has limited value at the level of individual hospitals, where the case mix may vary [76], but is increasingly used as a quality indicator for monitoring the overall performance of surgical healthcare at the regional or national level [1, 3, 4, 8] and has been recommended by the WHO [5] and the Lancet Commission on Global Surgery [6, 7] as a core healthcare indicator.
What could be the utility of using POMR trends as a surveillance instrument for monitoring the overall performance of surgical care at the national level? Some of our results deviate from evidence that has been reported in the international literature, highlighting the importance of individually monitoring the performance of healthcare systems, because organisational, population-based and other factors may differ between countries. In contrast to our findings, decreasing POMR trends for high-risk procedures have been reported in the US, which may be related to the inclusion of different IORs or to other factors [77]. For cystectomy, in-hospital mortality was unchanged from 2001–2008 in the US [78], and 30-day and 90-day mortality decreased between 1998 and 2010 in England [79]. According to an Australian single-centre study, the 30-day, 6-month and 1-year mortality after major lower limb amputation decreased dramatically between 2000–2002 and 2010–2012, which was attributed, in part, to organisational changes [80]. A study from the US then reported declining in-hospital mortality from 1998–2008 after total hip arthroplasties despite increasing trends in in-hospital major complications, but because the length of hospital stay also decreased significantly during the same period, the authors point out that some of the postoperative deaths may have occurred after the transfer of the patients to other facilities [75]. In addition to these international findings, lower hospital volume was associated with higher mortality after oesophageal, gastric, pancreatic and rectal cancer resections in a Swiss study (1999–2012) [81]. This study also documented an increasing concentration of these procedures in centres with higher volumes, but the overall POMR trends for these procedures are not evident from this study [81].
The external validity [56] of our findings is crucial for their potential transfer to practice. The results for individual IORs are based on mandatory data collection for all Swiss hospitals and represent a national census rather than a sample for the respective indicator. Importantly, routine quality reporting of surgical outcomes has been found to have a beneficial effect on quality outcomes per se [82, 83], and to be effective for measuring the impact of quality improvement strategies on mortality [84]. Allowing for the limitations of the routine data collection processes and the specific indicator definitions, POMR trends for individual FOPH IORs appear to be valid for use as indicators for perioperative care at the national level in Switzerland. The presented approach of calculating and presenting POMR trends based on direct standardisation and trend analysis using Poisson regression is methodically straightforward and could be done regularly to complement the reports of the FOPH.
For 73% of the included cases of selected noncardiac surgical indicator operations, in-hospital POMR trends in Switzerland were unchanged or increasing from 1998–2014. Potential confounding factors include changes in the coding practices and in the organisation of healthcare delivery. Unexpected POMR trends should be further investigated to identify potentially preventable factors amenable to national quality improvement strategies or to detect practice variations related to the reporting and coding process. The presented methodology may be used to monitor POMRs at the national level in Switzerland.
Swiss hospitals collect data yearly according to variables defined by the medical statistics of hospitals [22]. Hospitals can check data plausibility using software provided by the Federal Statistical Office [13]. Mortality always defines a case as an “inpatient” hospital stay [22]. Hospitals send the data to the Cantonal Statistical Offices, which organise and supervise data collection, check data quality, validate the data sets, and transfer them to the Federal Statistical Office. The Federal Statistical Office, responsible for the data collection at the federal level, publishes the medical statistics of hospitals [22] and transfers the necessary data required to establish the CH-IQIs to the FOPH [13].
To reconstruct all omitted age group observations, including sex-specific layers, a full set of age group observations for one year was first inserted as a “dummy” year at the end of the data list after sorting the “year” variable. The “dummy” observations contained 2050 as a “year” value to avoid confusion with real values in the data set, as well as a complete range of age groups (1–20) with two sex-specific layers (1=male, 2=female), resulting in 40 observations for “2050”. The observations of “year=2050” generated corresponding complete values (1–40) for “agegr” and “sex”, which were used temporarily as templates for all possible interactions between “year” and “agegr”, allowing the Stata command “fillin” [34] to generate a rectangular data structure and fill in omitted observations and their values as “missing”. The “fillin”-generated missing values were then replaced by zeros, and the 40 “dummy observations” were deleted.
As a standard population, the 2013 European Standard Population (ESP) was used (including the recommendation not to disaggregate the standard population by sex [19]). The FOPH publishes age-group-specific data for the following 20 5-year strata: age group 1 = 0–4 yrs, 2 = 5–9 yrs; 3 = 10–14 yrs; 4 = 15–19 yrs; 5 = 20–24 yrs, etc., until 18 = 85–89 yrs; 19 = 90–94 yrs; and 20 = 95+ yrs. These age groups deviate minimally from the ESP, where the youngest group is divided into two groups 0–<1 and 1–4 [19]. For this project (adults), the ESP-based standard population was adapted to the FOPH groups, combining the first two into one group (1–4 years), with a strata-specific combined population of 1000+4000=5000 [19]. A Stata file was created accordingly, containing variables with the adapted age group and population size variables.
Directly standardised POMRs were calculated using the Stata command “distrate” [36, 37]. The “distrate” command calculates the standardised rates and 95% confidence intervals (95% CIs) for standardised rates and is used, for example, in cancer registries [37]. “distrate” offers several options for calculating 95% CIs that are based on different assumptions about the underlying data distribution [37]. We used the method proposed by Dobson et al. [38] based on the χ2 distribution for the calculation of 95% CIs.
The authors would like to acknowledge the valuable contributions of the following individuals and institutions: Theres Schneider, Manfred Langenegger, FOPH; Matthias Fügi, GDK; Paul op’t Roodt, Hirslanden Clinic; David Schwappach, Patientensicherheit Schweiz; Kristen Jafflin, University of Basel; Claudine Burton-Jeangros, University of Geneva; Beate Sick, University of Zurich; Sebastian Heinz, Statworx; American Journal Experts (www.aje.com; editing and formatting).
Funding was entirely provided by the authors and their institutions.
The authors have no competing interest regarding the study contents.
1 Ariyaratnam R , Palmqvist CL , Hider P , Laing GL , Stupart D , Wilson L , et al. Toward a standard approach to measurement and reporting of perioperative mortality rate as a global indicator for surgery. Surgery. 2015;158(1):17–26. doi:.https://doi.org/10.1016/j.surg.2015.03.024
2 Watters DA , Guest GD , Tangi V , Shrime MG , Meara JG . Global surgery system strengthening: it is all about the right metrics. Anesth Analg. 2018;126(4):1329–39. doi:.https://doi.org/10.1213/ANE.0000000000002771
3 Palmqvist CL , Ariyaratnam R , Watters DA , Laing GL , Stupart D , Hider P , et al. Monitoring and evaluating surgical care: defining perioperative mortality rate and standardising data collection. Lancet. 2015;385(Suppl 2):S27. doi:.https://doi.org/10.1016/S0140-6736(15)60822-4
4 Watters DA , Hollands MJ , Gruen RL , Maoate K , Perndt H , McDougall RJ , et al. Perioperative mortality rate (POMR): a global indicator of access to safe surgery and anaesthesia. World J Surg. 2015;39(4):856–64. doi:.https://doi.org/10.1007/s00268-014-2638-4
5World Health Organization. Global reference list of 100 core health indicators. Geneva: World Health Organisation; 2018 [cited 2018 September 15]. Available from: http://www.who.int/healthinfo/indicators/2018/en/.
6The lancet commission on global surgery. 2018 [cited 2018 Aug 28]. Available from: http://www.lancetglobalsurgery.org/
7 Meara JG , Leather AJM , Hagander L , Alkire BC , Alonso N , Ameh EA , et al. Global Surgery 2030: evidence and solutions for achieving health, welfare, and economic development. Lancet. 2015;386(9993):569–624. doi:.https://doi.org/10.1016/S0140-6736(15)60160-X
8 Watters DA , Babidge WJ , Kiermeier A , McCulloch GA , Maddern GJ . Perioperative mortality rates in Australian public hospitals: the influence of age, gender and urgency. World J Surg. 2016;40(11):2591–7. doi:.https://doi.org/10.1007/s00268-016-3587-x
9 Pearse RM , Moreno RP , Bauer P , Pelosi P , Metnitz P , Spies C , et al.; European Surgical Outcomes Study (EuSOS) group for the Trials groups of the European Society of Intensive Care Medicine and the European Society of Anaesthesiology. Mortality after surgery in Europe: a 7 day cohort study. Lancet. 2012;380(9847):1059–65. doi:.https://doi.org/10.1016/S0140-6736(12)61148-9
10 Ghaferi AA , Birkmeyer JD , Dimick JB . Variation in hospital mortality associated with inpatient surgery. N Engl J Med. 2009;361(14):1368–75. doi:.https://doi.org/10.1056/NEJMsa0903048
11 Wang Y , Eldridge N , Metersky ML , Verzier NR , Meehan TP , Pandolfi MM , et al. National trends in patient safety for four common conditions, 2005-2011. N Engl J Med. 2014;370(4):341–51. doi:.https://doi.org/10.1056/NEJMsa1300991
12 Wacker J , Staender S . The role of the anesthesiologist in perioperative patient safety. Curr Opin Anaesthesiol. 2014;27(6):649–56. doi:.https://doi.org/10.1097/ACO.0000000000000124
13BAG. Qualitätsindikatoren der Schweizer Akutspitäler - Indicateurs de qualité des hôpitaux suisses de soins aigus - Indicatori di qualità degli ospedali per cure acute svizzeri 2014. 2016 [cited 2018 Jan 17]. Available from: http://www.bag-anw.admin.ch/2016_taglab/2016_spitalstatistik/data/download/qip14_publikation.pdf?v=1475584057
14ANQ - Nationaler Verein für Qualitätsentwicklung in Spitälern und Kliniken. ANQ Messergebnisse Akutsomatik 2017 [cited 2019 Sept 18]. Available from: https://www.anq.ch/de/fachbereiche/akutsomatik/messergebnisse-akutsomatik/
15Schweiz P. Operation Sichere Chirurgie: gelungen? 2015 [cited 2018 September 15]. Available from: https://www.patientensicherheit.ch/fileadmin/user_upload/1_Projekte_und_Programme/progress_sichere_chirurgie/progress_SC_alle/Operation_Sichere_Chirurgie_Kobler.pdf
16Kohn LT, Corrigan JM, Donaldson MS. To err is human: building a safer health system. Washington, D.C.: National Academy Press; 2000.
17 Classen DC , Resar R , Griffin F , Federico F , Frankel T , Kimmel N , et al. ‘Global trigger tool’ shows that adverse events in hospitals may be ten times greater than previously measured. Health Aff (Millwood). 2011;30(4):581–9. doi:.https://doi.org/10.1377/hlthaff.2011.0190
18Jüni P, Hossmann S, Rat J, Limacher A, Rutjes AWS. Inter-cantonal agreement on highly specialised medicine (IVHSM): rarity as the criterion for the centralization of highly specialised medicine. Bern: Institute of Social and Preventive Medicine, University of Bern; 2014 [cited 2018 May 11]. Available from: https://www.google.com/url?sa=t&rct=j&q=&esrc=s&source=web&cd=1&ved=0ahUKEwiG8Na_nP7aAhXOAewKHWbuA9MQFgg2MAA&url=https%3A%2F%2Fwww.gdk-cds.ch%2Ffileadmin%2Fdocs%2Fpublic%2Fgdk%2Fthemen%2Fhsm%2Forgane%2Fhsm_finalreport_final_gesamt_inkl_annexe_1-7.pdf&usg=AOvVaw32EHWfqxdIlxCouJL_BlUG.
19Eurostat. Revision of the european standard population. Luxembourg: Publications Office of the European Union; 2013 [cited 2016 June 12]. Available from: http://ec.europa.eu/eurostat/en/web/products-manuals-and-guidelines/-/KS-RA-13-028.
20Kirkwood BR, Sterne JAC. Poisson regression. In: Essential Medical Statistics. Oxford, UK: Blackwell Science Ltd; 2003. p. 249-62.
21 Ely JW , Dawson JD , Lemke JH , Rosenberg J . An introduction to time-trend analysis. Infect Control Hosp Epidemiol. 1997;18(4):267–74. doi:.https://doi.org/10.2307/30141214
22Bundesamt für Statistik. Medizinische Statistik der Krankenhäuser - Detailkonzept 1997. Neuchâtel: Bundesamt für Statistik, Sektion Gesundheit; 2005 [cited 2018 June 19]. Available from: https://www.bfs.admin.ch/bfs/de/home/statistiken/gesundheit/erhebungen/ms.assetdetail.230430.html.
23Bundesamt für Gesundheit (BAG). Qualitätsindikatoren der Schweizer Akutspitäler. [cited 2018 Jun 19]. Available from: https://www.bag.admin.ch/bag/de/home/service/zahlen-fakten/zahlen-fakten-zu-spitaelern/qualitaetsindikatoren-der-schweizer-akutspitaeler/qualitaetsindikatoren-abfrage.html
24Bundesamt für Gesundheit BAG. SDuS. Referenzdaten für die Risikoadjustierung - CH-IQI Version 4.0 (ZIP, de fr it). Qualitätsindikatoren der Schweizer Akutspitäler 2013. 2015 [cited 2018 Jan 17]. Available from: https://www.bag.admin.ch/bag/de/home/zahlen-und-statistiken/zahlen-fakten-zu-spitaelern/qualitaetsindikatoren-der-schweizer-akutspitaeler/qualitaetsindikatoren-chiqi-spezifikationen/_jcr_content/par/externalcontent.external.exturl.zip/aHR0cDovL3d3dy5iYWctYW53LmFkbWluLmNoLzIwMTZfdGFnbG/FiLzIwMTZfc3BpdGFsc3RhdGlzdGlrL2RhdGEvZG93bmxvYWQv/cWlwMTNfcmVmZGF0YTQwLnppcD92PTE0OTY3NDc3NTM=.zip.
25Bundesamt für Gesundheit BAG. SDuS. Referenzdaten für die Risikoadjustierung - CH-IQI Version 4.0 (ZIP, de fr it). Qualitätsindikatoren der Schweizer Akutspitäler 2014. 2014 [cited 2018 Jan 16]. Available from: https://www.bag.admin.ch/bag/de/home/zahlen-und-statistiken/zahlen-fakten-zu-spitaelern/qualitaetsindikatoren-der-schweizer-akutspitaeler/qualitaetsindikatoren-chiqi-spezifikationen/_jcr_content/par/externalcontent.external.exturl.zip/aHR0cDovL3d3dy5iYWctYW53LmFkbWluLmNoLzIwMTZfdGFnbG/FiLzIwMTZfc3BpdGFsc3RhdGlzdGlrL2RhdGEvZG93bmxvYWQv/cWlwMTRfcmVmZGF0YTQwLnppcD92PTE0OTY3NDc3NTQ=.zip.
26BAG. CH-IQI - Swiss Inpatient Quality Indicators. Spezifikationen Version 4.0. 2016 [cited 2018 Jan 18]. Available from: http://www.bag-anw.admin.ch/2016_taglab/2016_spitalstatistik/data/download/qip14_spezifikationen_40.pdf?v=1475584057
27 Smilowitz NR , Gupta N , Ramakrishna H , Guo Y , Berger JS , Bangalore S . Perioperative major adverse cardiovascular and cerebrovascular events associated with noncardiac surgery. JAMA Cardiol. 2017;2(2):181–7. doi:.https://doi.org/10.1001/jamacardio.2016.4792
28 Massarweh NN , Kougias P , Wilson MA . Complications and failure to rescue after inpatient noncardiac surgery in the veterans affairs health system. JAMA Surg. 2016;151(12):1157–65. doi:.https://doi.org/10.1001/jamasurg.2016.2920
29Bundesamt für Gesundheit BAG. Positive Bilanz bei der Planung der hochspezialisierten Medizin. Bern: Bundesamt für Gesundheit BAG; 2016 [cited 2018 May 11]. Available from: https://www.gdk-cds.ch/fileadmin/docs/public/gdk/themen/hsm/bericht_des_br_ueber_die_hochspezialisierte_medizin_d.pdf.
30Fügi M. Personal communication: Assignment of “HSM” fields, publication of decisions (in “Bundesblatt”). Bern: Swiss Conference of Cantonal Health Directors (GDK); April 12, 2018.
31GDK / CDS. Schweizerische Konferenz der kantonalen Gesundheitsdirektorinnen und -direktoren. Hochspezialisierte Medizin. 2018 [cited 2018 May 11]. Available from: https://www.gdk-cds.ch/index.php?id=822&L=1%20AND%201%3D1%EF%BF%BD.
32StataCorp. Stata reference manual release 14. College Station, TX: Stata Press; 2015 [cited 2017 June 20]. Available from: http://www.stata.com/manuals/r/index2.html.
33Cox NJ, Wang L, Buis M. Re: st: RE: RE: generating blank observations. College Station, TX: StataCorp LLC; 2017 [cited 2017 June 25]. Available from. https://www.stata.com/statalist/archive/2006-11/msg00241.html#.
34 Cox NJ . Stata tip 17: filling in the gaps. Stata J. 2005;5(1):135–6. doi:.https://doi.org/10.1177/1536867X0500500117
35Kirkwood BR, Sterne JAC. Standardization. In: Essential medical statistics. Oxford: Blackwell Science Ltd.; 2003. p. 263-71.
36Coviello E, Consonni D, Buzzoni C, Mensi C. Distrate - Directly standardized rates with improved confidence intervals. In: StataCorp. Stata reference manual release 14. College Station, TX: Stata Press; 2015. p. 522-41, [cited 2017 June 20]. Available from: http://www.stata.com/manuals/r/index2.html.
37 Consonni D , Coviello E , Buzzoni C , Mensi C . A command to calculate age-standardized rates with efficient interval estimation. Stata J. 2012;12(4):688–701. doi:.https://doi.org/10.1177/1536867X1201200408
38 Dobson AJ , Kuulasmaa K , Eberle E , Scherer J . Confidence intervals for weighted sums of Poisson parameters. Stat Med. 1991;10(3):457–62. doi:.https://doi.org/10.1002/sim.4780100317
39Cox NJRE. overlay bar and line graphs in STATA. 2011 [cited 2018 July 12]. Available from: https://www.stata.com/statalist/archive/2011-05/msg00918.html
40Mitchell MN. A Visual Guide to Stata Graphics. College Station, Texas: Stata Press; 2012.
41 Selvaggi G , Bellringer J . Gender reassignment surgery: an overview. Nat Rev Urol. 2011;8(5):274–82. doi:.https://doi.org/10.1038/nrurol.2011.46
42 Brown JA , Wilson TM . Benign prostatic hyperplasia requiring transurethral resection of the prostate in a 60-year-old male-to-female transsexual. Br J Urol. 1997;80(6):956–7. doi:.https://doi.org/10.1046/j.1464-410X.1997.00342.x
43 Kristensen SD , Knuuti J , Saraste A , Anker S , Bøtker HE , Hert SD , et al., Authors/Task Force Members. 2014 ESC/ESA Guidelines on non-cardiac surgery: cardiovascular assessment and management: The Joint Task Force on non-cardiac surgery: cardiovascular assessment and management of the European Society of Cardiology (ESC) and the European Society of Anaesthesiology (ESA). Eur Heart J. 2014;35(35):2383–431. doi:.https://doi.org/10.1093/eurheartj/ehu282
44 Fleisher LA , Fleischmann KE , Auerbach AD , Barnason SA , Beckman JA , Bozkurt B , et al. 2014 ACC/AHA guideline on perioperative cardiovascular evaluation and management of patients undergoing noncardiac surgery: executive summary: a report of the American College of Cardiology/American Heart Association Task Force on Practice Guidelines. Circulation. 2014;130(24):2215–45. doi:.https://doi.org/10.1161/CIR.0000000000000105
45 Kolh P , De Hert S , De Rango P . The concept of risk assessment and being unfit for surgery. Eur J Vasc Endovasc Surg. 2016;51(6):857–66. doi:.https://doi.org/10.1016/j.ejvs.2016.02.004
46 Boyd O , Jackson N . How is risk defined in high-risk surgical patient management? Crit Care. 2005;9(4):390–6. doi:.https://doi.org/10.1186/cc3057
47 van Zaane B , van Klei WA , Buhre WF , Bauer P , Boerma EC , Hoeft A , et al.; European Surgical Outcomes Study (EuSOS) group for the Trials groups of the European Society of Intensive Care Medicine and the European Society of Anaesthesiology. Nonelective surgery at night and in-hospital mortality: Prospective observational data from the European Surgical Outcomes Study. Eur J Anaesthesiol. 2015;32(7):477–85. doi:.https://doi.org/10.1097/EJA.0000000000000256
48 Nimptsch U , Krautz C , Weber GF , Mansky T , Grützmann R . Nationwide in-hospital mortality following pancreatic surgery in Germany is higher than anticipated. Ann Surg. 2016;264(6):1082–90. doi:.https://doi.org/10.1097/SLA.0000000000001693
49 Raymond DP , Seder CW , Wright CD , Magee MJ , Kosinski AS , Cassivi SD , et al. Predictors of major morbidity or mortality after resection for esophageal cancer: a society of thoracic surgeons general thoracic surgery database risk adjustment model. Ann Thorac Surg. 2016;102(1):207–14. doi:.https://doi.org/10.1016/j.athoracsur.2016.04.055
50 Haynes AB , Weiser TG , Berry WR , Lipsitz SR , Breizat AH , Dellinger EP , et al.; Safe Surgery Saves Lives Study Group. A surgical safety checklist to reduce morbidity and mortality in a global population. N Engl J Med. 2009;360(5):491–9. doi:.https://doi.org/10.1056/NEJMsa0810119
51StataCorp. Poisson — Poisson regression. In: StataCorp. Stata reference manual release 14. College Station, TX: Stata Press; 2015. p. 1880-9; [cited 2017 June 20]. Available from: http://www.stata.com/manuals/r/index2.html.
52StataCorp. Pctile — Create variable containing percentiles. In: StataCorp. Stata reference manual release 14. College Station, TX: Stata Press; 2015. p. 513-24; [cited 2017 June 20]. Available from: http://www.stata.com/manuals/r/index2.html.
53Reif J. REGSAVE: Stata module to save regression results to a Stata-formatted dataset. Boston, MA: Boston College Department of Economics; 2016; [cited 2017 June 29]. Available from: https://ideas.repec.org/c/boc/bocode/s456964.html#.
54Reif J. Storing, analyzing, and presenting Stata output. 5 ed. Boston, MA: Stata Users Group; 2010; [cited 2017 June 29]. Available from: http://fmwww.bc.edu/repec/bost10/Reif.pdf.
55Federal Statistical Office (FSO). Junker C. Cause of death statistic - Death and its main causes in Switzerland, 2014 [cited 2017 June 29]. Available from: https://www.bfs.admin.ch/bfs/de/home/statistiken/gesundheit.assetdetail.2022364.html.
56 Vandenbroucke JP , von Elm E , Altman DG , Gøtzsche PC , Mulrow CD , Pocock SJ , et al.; STROBE Initiative. Strengthening the Reporting of Observational Studies in Epidemiology (STROBE): explanation and elaboration. PLoS Med. 2007;4(10):e297. doi:.https://doi.org/10.1371/journal.pmed.0040297
57 Thommen D , Weissenberger N , Schuetz P , Mueller B , Reemts C , Holler T , et al. Head-to-head comparison of length of stay, patients’ outcome and satisfaction in Switzerland before and after SwissDRG-Implementation in 2012 in 2012: an observational study in two tertiary university centers. Swiss Med Wkly. 2014;144:w13972. doi:.https://doi.org/10.4414/smw.2014.13972
58 Lass P , Lilholt J , Thomsen L , Lundbye-Christensen S , Enevoldsen H , Simonsen OH . Kvaliteten af diagnose- og procedurekodning i Ortopaedkirurgi Nordjylland [The quality of diagnosis and procedure coding in Orthopaedic surgery Northern Jutland]. Ugeskr Laeger. 2006;168(48):4212–5. Article in Danish.
59 Nymark T , Thomsen K , Röck ND . [Diagnosis and procedure coding in relation to the DRG system]. Ugeskr Laeger. 2003;165(3):207–9.
60 Klaus B , Ritter A , Grosse Hülsewiesche H , Beyrle B , Euler HU , Fender H , et al. Untersuchung zur Qualität der Kodierungen von Diagnosen und Prozeduren unter DRG-Bedingungen [Study of the quality of codification of diagnoses and procedures under DRG conditions]. Gesundheitswesen. 2005;67(1):9–19. Article in German. doi:.https://doi.org/10.1055/s-2004-813833
61 Franz D , Kaufmann M , Siebert CH , Windolf J , Roeder N . Unfallchirurgie und Orthopädie im G-DRG-System 2007 [Orthopedic and trauma surgery in the German DRG System 2007]. Unfallchirurg. 2007;110(3):270–80. Article in German. doi:.https://doi.org/10.1007/s00113-007-1239-1
62 Nimptsch U . Disease-specific trends of comorbidity coding and implications for risk adjustment in hospital administrative data. Health Serv Res. 2016;51(3):981–1001. doi:.https://doi.org/10.1111/1475-6773.12398
63 Wasserfallen JB , Zufferey J . Financial impact of introducing the Swiss-DRG reimbursement system on potentially avoidable readmissions at a university hospital. Swiss Med Wkly. 2015;145:w14097. doi:.https://doi.org/10.4414/smw.2015.14097
64 Chok L , Bachli EB , Steiger P , Bettex D , Cottini SR , Keller E , et al. Effect of diagnosis related groups implementation on the intensive care unit of a Swiss tertiary hospital: a cohort study. BMC Health Serv Res. 2018;18(1):84. doi:.https://doi.org/10.1186/s12913-018-2869-4
65Bundesamt für Statistik BfS. Gesundheitsversorgungsstatistik – Ambulante Statistiken im Projekt MARS (Modules Ambulatoires des Relevés sur la Santé). 2017 [cited 2018 Dec 11]. Available from: https://www.bfs.admin.ch/bfsstatic/dam/assets/3602241/master
66Bundesamt für Statistik (BfS). Statistiken der ambulanten Gesundheitsversorgung (MARS). [cited 2018 Dec 11]. Available from: https://www.bfs.admin.ch/bfs/de/home/grundlagen/projekte/statistiken-ambulante-gesundheitsversorgung-mars.html
67 Sammon JD , Pucheril D , Abdollah F , Varda B , Sood A , Bhojani N , et al. Preventable mortality after common urological surgery: failing to rescue? BJU Int. 2015;115(4):666–74. doi:.https://doi.org/10.1111/bju.12833
68 Moawad G , Liu E , Song C , Fu AZ . Movement to outpatient hysterectomy for benign indications in the United States, 2008-2014. PLoS One. 2017;12(11):e0188812. doi:.https://doi.org/10.1371/journal.pone.0188812
69 Aynardi M , Post Z , Ong A , Orozco F , Sukin DC . Outpatient surgery as a means of cost reduction in total hip arthroplasty: a case-control study. HSS J. 2014;10(3):252–5. doi:.https://doi.org/10.1007/s11420-014-9401-0
70 Gignoux B , Gosgnach M , Lanz T , Vulliez A , Blanchet MC , Frering V , et al. Short-term outcomes of ambulatory colectomy for 157 consecutive patients. Ann Surg. 2018. [Epub ahead of print.] doi:.https://doi.org/10.1097/SLA.0000000000002800
71 Leeder PC , Matthews T , Krzeminska K , Dehn TC . Routine day-case laparoscopic cholecystectomy. Br J Surg. 2004;91(3):312–6. doi:.https://doi.org/10.1002/bjs.4409
72 Talsma AK , Lingsma HF , Steyerberg EW , Wijnhoven BP , Van Lanschot JJ . The 30-day versus in-hospital and 90-day mortality after esophagectomy as indicators for quality of care. Ann Surg. 2014;260(2):267–73. doi:.https://doi.org/10.1097/SLA.0000000000000482
73 Rydenfelt K , Engerström L , Walther S , Sjöberg F , Strömberg U , Samuelsson C . In-hospital vs. 30-day mortality in the critically ill - a 2-year Swedish intensive care cohort analysis. Acta Anaesthesiol Scand. 2015;59(7):846–58. doi:.https://doi.org/10.1111/aas.12554
74 Damhuis RA , Wijnhoven BP , Plaisier PW , Kirkels WJ , Kranse R , van Lanschot JJ . Comparison of 30-day, 90-day and in-hospital postoperative mortality for eight different cancer types. Br J Surg. 2012;99(8):1149–54. doi:.https://doi.org/10.1002/bjs.8813
75 Kirksey M , Chiu YL , Ma Y , Della Valle AG , Poultsides L , Gerner P , et al. Trends in in-hospital major morbidity and mortality after total joint arthroplasty: United States 1998-2008. Anesth Analg. 2012;115(2):321–7. doi:.https://doi.org/10.1213/ANE.0b013e31825b6824
76 Hogan H , Zipfel R , Neuburger J , Hutchings A , Darzi A , Black N . Avoidability of hospital deaths and association with hospital-wide mortality ratios: retrospective case record review and regression analysis. BMJ. 2015;351:h3239. doi:.https://doi.org/10.1136/bmj.h3239
77 Finks JF , Osborne NH , Birkmeyer JD . Trends in hospital volume and operative mortality for high-risk surgery. N Engl J Med. 2011;364(22):2128–37. doi:.https://doi.org/10.1056/NEJMsa1010705
78 Kim SP , Boorjian SA , Shah ND , Karnes RJ , Weight CJ , Moriarty JP , et al. Contemporary trends of in-hospital complications and mortality for radical cystectomy. BJU Int. 2012;110(8):1163–8. doi:.https://doi.org/10.1111/j.1464-410X.2012.10990.x
79 Hounsome LS , Verne J , McGrath JS , Gillatt DA . Trends in operative caseload and mortality rates after radical cystectomy for bladder cancer in England for 1998-2010. Eur Urol. 2015;67(6):1056–62. doi:.https://doi.org/10.1016/j.eururo.2014.12.002
80 Kelly DA , Pedersen S , Tosenovsky P , Sieunarine K . Major lower limb amputation: outcomes are improving. Ann Vasc Surg. 2017;45:29–34. doi:.https://doi.org/10.1016/j.avsg.2017.05.039
81 Güller U , Warschkow R , Ackermann CJ , Schmied B , Cerny T , Ess S . Lower hospital volume is associated with higher mortality after oesophageal, gastric, pancreatic and rectal cancer resection. Swiss Med Wkly. 2017;147:w14473. doi:.https://doi.org/10.4414/smw.2017.14473
82Maggard-Gibbons M. Use of report cards and outcome measurements to improve safety of surgical care: American College of Surgeons National Quality Improvements Program (NEW). In: Shekelle PG, Wachter RM, Pronovost PJ, editorsMaking health care safer II: an updated critical analysis of the evidence for patient safety practices Comparative effectiveness review no 211. Rockville, MD: Agency for Healthcare Research and Quality; 2013. p. 140-57; [cited 2018 September 15]. Available from. http://www.ahrq.gov/research/findings/evidence-based-reports/ptsafetyuptp.html.
83 Shekelle PG , Pronovost PJ , Wachter RM , McDonald KM , Schoelles K , Dy SM , et al. The top patient safety strategies that can be encouraged for adoption now. Ann Intern Med. 2013;158(5 Pt 2):365–8. doi:.https://doi.org/10.7326/0003-4819-158-5-201303051-00001
84 Yuen WC , Wong K , Cheung YS , Lai PB . Reduction of operative mortality after implementation of surgical outcomes monitoring and improvement programme by Hong Kong Hospital Authority. Hong Kong Med J. 2018;24(2):137–44. doi:.https://doi.org/10.12809/hkmj177118
Funding was entirely provided by the authors and their institutions.
The authors have no competing interest regarding the study contents.