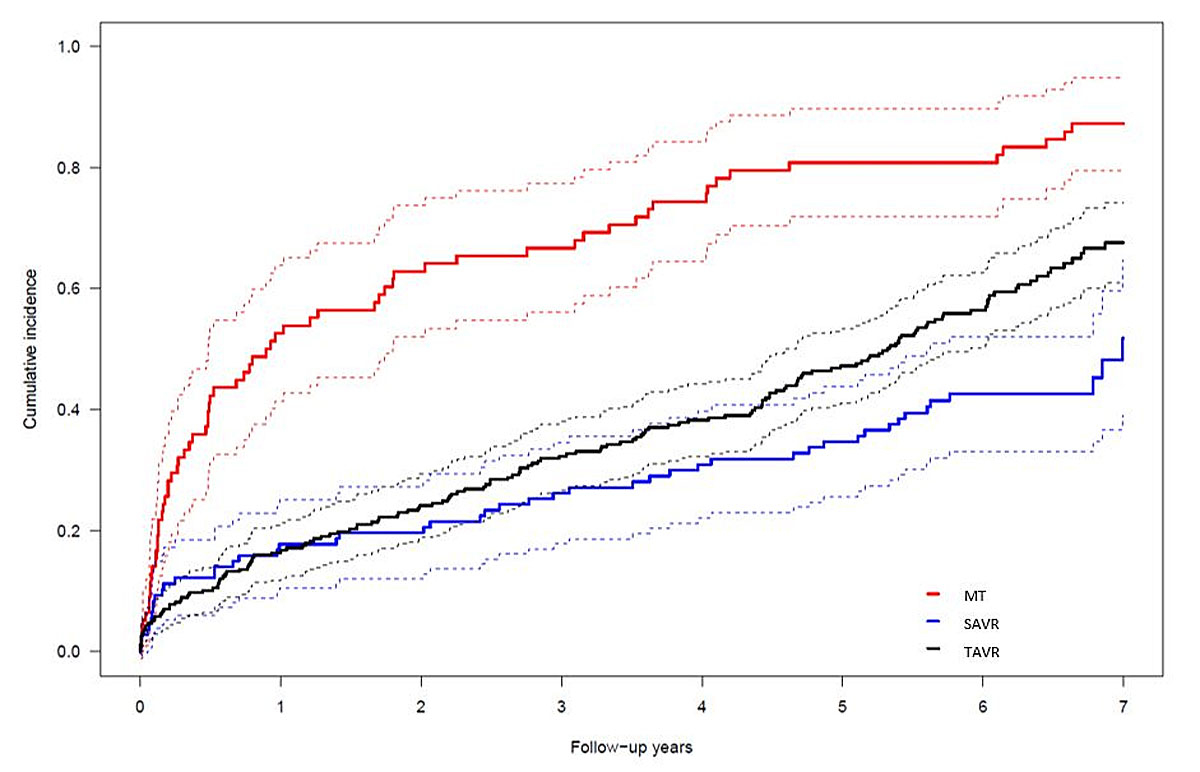
Figure 1 Cumulative incidence curves of all-cause death. The competing risk model shows patients allocated to MT (red), TAVR (black), and SAVR (blue). SAVR vs MT: p <0.0001; TAVI vs MT: p <0.0001. Confidence intervals are depicted as dashed lines.
DOI: https://doi.org/10.4414/smw.2019.20013
As the most commonly acquired valvular heart disease with a prevalence of up to 4.6% in patients older than 75 years, aortic stenosis (AS) carries a high short-term mortality once patients become symptomatic [1]. Surgical aortic valve replacement (SAVR) could significantly reduce mortality in patients with symptomatic severe AS who are more than 60 years of age. However, for patients deemed to be a high surgical risk, transcatheter aortic valve replacement (TAVR) has been proven to be the preferred valuable therapeutic option with a significant growth since its introduction in 2002. Randomised controlled trials show an absolute reduction of mortality of more than 20% in inoperable patients at five years (TAVR versus medical treatment (MT)), as well as comparable five-year mortality rates for TAVR compared with SAVR [2, 3]. Extended follow-up comparing the three treatment strategies is scarce yet important in view of the uncertainty regarding the long-term durability of bioprostheses. The aim of this study was to assess long-term clinical outcomes of patients at increased risk with symptomatic, severe AS allocated to MT, SAVR, and TAVR through extended follow-up over five years. Preliminary results have been previously published as a conference abstract [4].
Consecutive patients aged ≥80 years with severe symptomatic AS (echocardiographic mean gradient >40 mm Hg or calculated aortic valve area <1 cm2) and the presence of a logistic EuroSCORE of >15% included in a prospective single centre registry between July 2007 and September 2010 underwent follow-up between March and August 2016. Criteria for inclusion and definitions have been reported previously [5]. Of note, patients <80 years of age were eligible in the case of a previous history of cardiac surgery, chronic obstructive pulmonary disease (forced expiratory volume during one second <1.0), severe pulmonary hypertension (≥60 mmHg), porcelain aorta, history of radiation therapy to the mediastinum, or frailty (BMI <18 kg/m2).
All subjects provided written informed consent and the study was approved by the local ethics committee. Reasons for treatment allocation were based upon anatomical and technical considerations, estimated periprocedural risk, and patient preference as well as a consensus decision within the local heart team. A considerable proportion of patients allocated to MT (48.7%) were only at intermediate surgical risk but refused to undergo SAVR or TAVR, despite the recommendation of the heart team. The selection process (multimodal assessment during a short hospitalisation) included left and right heart catheterisation, aortography, transthoracic and transoesophageal echocardiography, and CT angiography of the chest, abdomen, and pelvis. Subspecialty assessment was requested for comorbidities such as malignancies, chronic pulmonary disease, renal failure, liver cirrhosis, and bleeding diathesis. All eligible cases were discussed within the local heart team and a consensus decision was then presented and discussed with the patient. MT consisted of treatment of cardiac and non-cardiac comorbidities according to best clinical practice. Balloon aortic valvuloplasty was not offered as part of the MT strategy, nor as a bridge to SAVR in patients with congestive heart failure. SAVR and TAVR were performed according to contemporary standards. TAVR included the use of either the Edwards Sapien valve or the Medtronic CoreValve Revalving system through a transfemoral, transapical, or trans-subclavian approach using standard techniques. We assessed clinical outcomes as time to first event using Cox regression, accompanied by log-rank tests to calculate corresponding two-sided p-values. We performed a sensitivity analysis by including the logistic EuroSCORE as an additional covariate to derive adjusted hazard ratios. Moreover, we analysed all-cause mortality using a competing risk model, with MI and major stroke as competing events. Patients were considered to be simultaneously at risk for all three mutually exclusive events and were no longer at risk for the other events if one of the events occurred [6]. We tested for equality across groups using the subdistribution hazard for each cause of failure [7]. Analyses were performed using Stata release 14.2 and R version 3.3.2. We used the Stata stcox function to assess the clinical outcomes and the sts test function to evaluate equality of survivor functions [8]. For the competing risk model, we used the cuminc function included in the R package cmprsk [9]. In patients with a repeat intervention, follow-up data after the repeat procedure were not included in any further analysis. All suspected events were adjudicated by an unblinded clinical event committee consisting of cardiac surgeons and interventional cardiologists.
A total of 442 patients (median age 83 years; 52% female) were allocated to MT (n = 78), SAVR (n = 107), or TAVR (n = 257) after evaluation by the heart team, reflecting a gradient of surgical risk as assessed by logistic EuroSCORE (MT: 27.9 ± 14.5%, TAVR: 24.7 ± 24.9%, SAVR: 12.5 ± 8.2%; p <0.001). Baseline clinical and imaging characteristics are outlined in table 1. The delay between the evaluation visit and the treatment (SAVR or TAVR) averaged 37 ± 46 days (median 27 days) and was mainly due to a delay of the final patient decision. Of note, ten patients died during the time period between initial evaluation and definitive treatment. Nonetheless, 11 of the 78 MT patients (14%) were reassessed and crossed over to TAVR (n = 9) or SAVR (n = 2) after a median of two years (range 25–1159 days). Of note, seven patients of the MT group changed their mind and agreed to undergo TAVR (n = 6) or SAVR (n = 1). Procedural data and outcomes have been reported previously [5]. In summary, rates of major adverse cerebro-cardiovascular events were lower in the SAVR or TAVR cohort as compared with MT patients (SAVR vs. MT: HR 0.31, 95% CI 0.21–0.46; TAVR vs. MT: HR 0.34, 95% CI 0.25–0.46), with no significant difference between SAVR and TAVR (HR 0.88, 95% CI 0.62–1.25) after a median duration of follow-up of 3.9 years. Although SAVR (HR 0.39, 95% CI 0.24–0.61), TAVR (HR 0.37, 95% CI 0.26–0.52), and female sex (HR 0.72, 95% CI 0.53–0.99) were associated with improved survival, body mass index ≤20 kg/m2 (HR 1.60, 95% CI 1.04–2.47), diabetes (HR 1.48, 95% CI 1.03–2.12), peripheral vascular disease (HR 2.01, 95% CI 1.44–2.81), atrial fibrillation (HR 1.74, 95% CI 1.28–2.37), and pulmonary hypertension (HR 1.43, 95% CI 1.03–2.00) were previously identified as independent predictors of mortality [10]. Regarding the current analysis, completeness of follow-up was 99.1%. Echocardiographic data are illustrated in table 2. At or beyond five years, the difference (mean ± standard deviation) in left ventricular ejection fraction (LVEF, %) was still statistically significant (SAVR 58 ± 12, TAVR 56 ± 13, MT 44 ± 13; p <0.001). However, almost all patients of the MT cohort and almost half of the TAVR patients had died in between. Consistent follow-up echocardiography was poorer in SAVR patients (47%) as compared with TAVR patients (93%). The postinterventional mean gradient in both SAVR and TAVR patients did not significantly change over time. In an intention-to-treat analysis, survival after a median duration of follow-up of seven years was 6.4%, 30.4%, and 46.7% in patients with MT, TAVR, and SAVR, respectively (p <0.001) (fig. 1). There were no significant differences in the occurrence of disabling stroke (5.7%) or myocardial infarction (2.5%) between the different treatment modalities. Long-term outcomes are depicted in table 3. Crossover from MT to SAVR or TAVR occurred in 11 patients (14.1%). One TAVR patient (0.4%) and one SAVR patient (0.9%) underwent repeat intervention for bioprosthetic valve degeneration between 4.5 and 8.4 years after the intervention. None of the patients experienced a major adverse cardiovascular event during repeat intervention for bioprosthetic valve degeneration. Impaired left ventricular function (LVEF <40%) was associated with increased mortality (HR 1.62, 95% CI 1.22–2.15; p <0.0001) whereas female sex was protective (HR 0.68, 95% CI 0.53–0.88; p = 0.0006).
Table 1 Baseline characteristics.
|
Overall
n = 442 |
MT
n = 78 |
SAVR
n = 107 |
TAVR
n = 257 |
p-value* | |
|---|---|---|---|---|---|
| Age (yrs) | 81.7 ± 6.0 | 83.2 ± 5.7 | 79.7 ± 5.5 | 82.1 ± 6.2 | <0.001 |
| Women | 230 (52.0%) | 33 (42.3%) | 53 (49.5%) | 144 (56.0%) | 0.09 |
| BMI (kg/m2) | 25.6 ± 4.6 | 24.4 ± 3.5 | 26.0 ± 4.7 | 25.8 ± 4.9 | 0.03 |
| Cardiac risk factors | |||||
| Hypertension | 338 (76.5%) | 52 (66.7%) | 85 (79.4%) | 201 (78.2%) | 0.08 |
| Current smoker | 65 (14.7%) | 7 (9.0%) | 16 (15.0%) | 42 (16.3%) | 0.27 |
| Diabetes mellitus | 101 (22.9%) | 18 (23.1%) | 21 (19.6%) | 62 (24.1%) | 0.65 |
| Hypercholesterolaemia | 233 (52.7%) | 32 (41.0%) | 46 (43.0%) | 155 (60.3%) | 0.001 |
| Positive family history for coronary artery disease | 78 (17.6%) | 12 (15.4%) | 17 (15.9%) | 49 (19.1%) | 0.65 |
| Past medical history | |||||
| Prior MI | 79 (17.9%) | 23 (29.5%) | 9 (8.4%) | 47 (18.3%) | 0.001 |
| Prior PCI | 77 (17.4%) | 10 (12.8%) | 9 (8.4%) | 58 (22.6%) | 0.003 |
| CABG | 76 (17.2%) | 18 (23.1%) | 4 (3.7%) | 54 (21.0%) | <0.001 |
| Previous stroke | 44 (10.0%) | 13 (16.7%) | 8 (7.5%) | 23 (8.9%) | 0.08 |
| Peripheral vascular disease | 93 (21.0%) | 16 (20.5%) | 13 (12.1%) | 64 (24.9%) | 0.03 |
| Symptoms | |||||
| NYHA functional classes III and IV |
251 (56.9) | 48 (62.3) | 48 (44.9) | 155 (60.3) | 0.014 |
| Angina | 157 (35.5%) | 27 (34.6%) | 55 (51.4%) | 75 (29.2%) | <0.001 |
| Syncope | 51 (11.5%) | 14 (17.9%) | 13 (12.1%) | 24 (9.3%) | 0.11 |
| Cardiac rhythm | |||||
| Atrial fibrillation | 105 (23.8%) | 20 (25.6%) | 19 (17.8%) | 66 (25.7%) | 0.25 |
| Prior pacemaker | 39 (8.8%) | 4 (5.1%) | 9 (8.4%) | 26 (10.1%) | 0.39 |
| Risk assessment (%) | |||||
| Log. EuroSCORE | 22.3 ± 14.6 | 27.9 ± 14.5 | 12.5 ± 8.2 | 24.7 ± 24.9 | <0.001 |
| Lin. EuroSCORE | 10.2 ± 2.5 | 11.2 ± 2.2 | 8.3 ± 2.0 | 10.7 ± 2.5 | <0.001 |
| STS score | 6.0 ± 5.0 | 6.5 ± 4.1 | 4.8 ± 5.3 | 6.4 ± 5.0 | 0.009 |
| Medications | |||||
| Acetylsalicylic acid | 254 (57.5%) | 39 (50.0%) | 59 (55.1%) | 156 (60.7%) | 0.21 |
| Clopidogrel | 62 (14.0%) | 10 (12.8%) | 5 (4.7%) | 47 (18.3%) | 0.003 |
| Oral anticoagulation | 114 (25.8%) | 22 (28.2%) | 18 (16.8%) | 74 (28.8%) | 0.05 |
| Echocardiography† | |||||
| LVEF (%) | 52 ± 14 | 46 ± 16 | 57 ± 12 | 51 ± 14 | <0.001 |
| Mean gradient (mm Hg) | 45 ± 17 | 41 ± 19 | 52 ± 15 | 44 ± 17 | 0.001 |
| AVA (cm2) | 0.7 ± 0.2 | 0.6 ± 0.2 | 0.6 ± 0.2 | 0.7 ± 0.2 | 0.82 |
| Invasive PA syst. pressure (mm Hg) | 52 ± 18 | 57 ± 19 | 43 ± 16 | 54 ± 17 | <0.001 |
BMI = body mass index; CABG = coronary artery bypass grafting; EuroSCORE = European System for Cardiac Operative Risk Evaluation; Lin. = linear; Log. = logarithmic; MI = myocardial infarction; LVEF = left ventricular ejection fraction; MT = medical treatment; NYHA = New York Heart Association; PA = pulmonary artery; PCI = percutaneous coronary intervention; STS = Society of Thoracic Surgeons. Values are n (%) or mean ± standard deviation, unless otherwise indicated. * Continuous variables were compared with analysis of variance and categorical variables with Pearson’s chi-square test. † Transthoracic echocardiography assessment used; if missing, transoesophageal echocardiography assessment used.
Table 2 Echocardiographic parameters.
|
Overall
n = 442 |
MT
n = 78 |
SAVR
n = 107 |
TAVR
n = 257 |
p-value | |
|---|---|---|---|---|---|
| Baseline | |||||
| LVEF (%) | 52 ± 14 | 46 ± 16 | 57 ± 12 | 51 ± 14 | <0.001 |
| Mean gradient (mmHg) | 45 ± 17 | 41 ± 19 | 52 ± 15 | 44 ± 17 | 0.001 |
| AVA (cm2) | 0.7 ± 0.2 | 0.6 ± 0.2 | 0.6 ± 0.2 | 0.7 ± 0.2 | 0.82 |
| At 3 years | n = 278 | n = 7 | n = 37 | n = 159 | |
| LVEF (%) | 55 ± 11 | 44 ± 11 | 55 ± 9 | 55 ± 15 | <0.001 |
| Mean gradient (mmHg) | 10.6 ± 6 | 47 ± 10 | 13.1 ± 7 | 11 ± 4 | 0.22 |
| AVA (cm2) | 1.4 ± 0.6 | 0.6 ± 0.3 | 1.4 ± 0.6 | 1.5 ± 0.6 | 0.18 |
| At or beyond 5 years | n = 142 | n = 5 | n = 28 | n = 109 | |
| LVEF (%) | 56 ± 13 | 44 ± 13 | 58 ± 12 | 56 ± 13 | <0.001 |
| Mean gradient (mmHg) | 11.8 ± 5 | 45 ± 16 | 12.7 ± 5 | 10 ± 5 | 0.14 |
| AVA (cm2) | 1.6 ± 0.4 | 0.5 ± 0.3 | 1.5 ± 0.4 | 1.7 ± 0.4 | 0.27 |
AVA = aortic valve area; LVEF = left ventricular ejection fraction Values are n (%) or mean ± standard deviation, unless otherwise indicated. Transthoracic echocardiography assessment used; if missing, transoesophageal echocardiography assessment used.
Figure 1 Cumulative incidence curves of all-cause death. The competing risk model shows patients allocated to MT (red), TAVR (black), and SAVR (blue). SAVR vs MT: p <0.0001; TAVI vs MT: p <0.0001. Confidence intervals are depicted as dashed lines.
Table 3 Clinical long-term outcomes.
|
Overall
n = 442 |
MT
n = 78 |
SAVR
n = 107 |
TAVR
n = 257 |
SAVR vs MT
HR (95% CI) |
p-value |
TAVR vs MT
HR (95% CI) |
p-value | |
|---|---|---|---|---|---|---|---|---|
| At 1 year | ||||||||
| All-cause mortality | 112 (25.3) | 43 (55.1) | 21 (19.6) | 48 (18.7) | 0.47 (0.25–0.86) | 0.0149 | 0.27 (0.18–0.41) | <0.0001 |
| Cardiovascular death | 84 (19.6) | 42 (54.0) | 11 (10.7) | 31 (12.4) | 0.28 (0.13–0.60) | 0.0011 | 0.18 (0.11–0.28) | <0.0001 |
| Myocardial infarction | 5 (1.3) | 1 (1.3) | 0 (0.0) | 4 (1.7) | * | 0.98 (0.11–8.92) | 0.9840 | |
| Major stroke | 18 (4.2) | 2 (3.7) | 4 (3.8) | 12 (4.8) | 1.11 (0.15–8.26) | 0.9192 | 1.83 (0.41–8.21) | 0.4286 |
| All-cause mortality or major stroke | 123 (27.8) | 44 (56.4) | 23 (21.5) | 56 (21.8) | 0.48 (0.26–0.87) | 0.0154 | 0.33 (0.22–0.49) | <0.0001 |
| All-cause mortality, MI, or major stroke | 125 (28.3) | 44 (56.4) | 23 (21.5) | 58 (22.6) | 0.48 (0.26–0.87) | 0.0151 | 0.35 (0.23–0.52) | <0.0001 |
| At 3 years | ||||||||
| All-cause mortality | 183 (41.4) | 55 (70.5) | 33 (30.8) | 95 (37.0) | 0.51 (0.31–0.86) | 0.0121 | 0.35 (0.25–0.49) | <0.0001 |
| Cardiovascular death | 132 (31.8) | 52 (67.8) | 18 (18.3) | 62 (26.0) | 0.34 (0.18–0.63) | 0.0007 | 0.24 (0.17–0.35) | <0.0001 |
| Myocardial infarction | 7 (1.9) | 2 (4.2) | 0 (0.0) | 5 (2.3) | * | 0.53 (0.10–2.80) | 0.4538 | |
| Major stroke | 23 (5.9) | 3 (6.8) | 8 (8.6) | 12 (4.8) | 0.87 (0.18–4.11) | 0.8592 | 1.17 (0.33–4.16) | 0.8119 |
| All-cause mortality or major stroke | 190 (43.0) | 56 (71.8) | 36 (33.6) | 98 (38.1) | 0.52 (0.31–0.86) | 0.0108 | 0.38 (0.27–0.53) | <0.0001 |
| All-cause mortality, MI, or major stroke | 193 (43.7) | 57 (73.1) | 36 (33.6) | 100 (38.9) | 0.51 (0.31–0.85) | 0.0097 | 0.38 (0.27–0.52) | <0.0001 |
| At 5 years | ||||||||
| All-cause mortality | 243 (55.3) | 66 (84.6) | 43 (40.3) | 134 (52.7) | 0.46 (0.29–0.73) | 0.0010 | 0.36 (0.27–0.49) | <0.0001 |
| Cardiovascular death | 178 (44.6) | 60 (79.8) | 29 (30.4) | 89 (39.4) | 0.37 (0.22–0.64) | 0.0003 | 0.26 (0.19–0.37) | <0.0001 |
| Myocardial infarction | 9 (2.8) | 2 (4.2) | 0 (0.0) | 7 (3.6) | * | 0.66 (0.13–3.25) | 0.6048 | |
| Major stroke | 25 (6.8) | 3 (6.8) | 9 (10.0) | 13 (5.5) | 0.9 (0.19–4.15) | 0.8897 | 1.21 (0.34–4.27) | 0.7710 |
| All-cause mortality or major stroke | 251 (57.1) | 67 (85.9) | 46 (43.1) | 138 (54.2) | 0.46 (0.29–0.72) | 0.0008 | 0.38 (0.28–0.52) | <0.0001 |
| All-cause mortality, MI, or major stroke | 254 (57.8) | 68 (87.2) | 46 (43.1) | 140 (55.0) | 0.45 (0.29–0.72) | 0.0007 | 0.37 (0.28–0.50) | <0.0001 |
| At 7 years | ||||||||
| All-cause mortality | 299 (73.6) | 72 (92.3) | 55 (59.3) | 172 (73.5) | 0.50 (0.33–0.77) | 0.0016 | 0.41 (0.31–0.54) | <0.0001 |
| Cardiovascular death | 223 (62.5) | 65 (88.4) | 39 (46.5) | 119 (60.7) | 0.43 (0.26–0.69) | 0.0006 | 0.31 (0.23–0.42) | <0.0001 |
| Myocardial infarction | 11 (3.9) | 2 (4.2) | 0 (0.0) | 9 (5.5) | * | 0.74 (0.15–3.56) | 0.7096 | |
| Major stroke | 25 (6.8) | 3 (6.8) | 9 (10.0) | 13 (5.5) | 0.90 (0.19–4.15) | 0.8897 | 1.21 (0.34–4.27) | 0.7710 |
| All-cause mortality or major stroke | 305 (75.0) | 73 (93.6) | 57 (60.2) | 175 (74.9) | 0.48 (0.32–0.74) | 0.0008 | 0.42 (0.32–0.56) | <0.0001 |
| All-cause mortality, MI, or major stroke | 309 (75.8) | 73 (93.6) | 57 (60.2) | 179 (76.2) | 0.48 (0.32–0.74) | 0.0008 | 0.43 (0.32–0.56) | <0.0001 |
Values are n (%) unless otherwise indicated. CI = confidence interval; HR = hazard ratio; MI = myocardial infarction; * = not possible to estimate
In this observational and prospective single centre study, both TAVR and SAVR were associated with a pronounced survival benefit. The increasing mortality gap between TAVR and SAVR patients on the one hand, and a narrowing gap between MT and TAVR patients between five and seven years on the other, reflect the significantly older age (median/interquartile range) of patients assigned to MT (84/7) and TAVR (83/7) as compared to SAVR (80/8) (p <0.001). Of note, all-cause mortality rates between TAVR and SAVR patients were comparable within the first year of intervention despite a surgical risk almost twice as high in TAVR as compared to SAVR patients, as assessed by EuroSCORE. In both treatment modalities, observed mortality was lower than predicted. A high risk of mortality secondary to comorbidities in combination with lenient investigation into the causes of death limit the assessment of valve deterioration during the extended follow-up. Two patients (1 TAVR, 1 SAVR) underwent repeat intervention for valvular degeneration; neither experienced a major adverse event secondary to the repeat intervention. In the absence of follow-up extending to the median duration of valve deterioration of surgical bioprostheses [11], a robust and sustained mortality reduction of TAVR with early-generation devices versus MT throughout seven years of follow-up further inspires confidence in TAVR.
Our study has several limitations. First, data were acquired at a single centre and results might not be generalisable to institutions with different referral patterns and collaborations between interventional cardiologists and cardiac surgeons. Second, patients were allocated to the different treatment strategies in a non-randomised fashion. However, we present adjusted analyses to correct for the selection bias. Furthermore, the analyses provide outcome data for all treated patients and thus represent the decisions and outcomes of unselected patients as encountered in routine clinical practice.
Our study shows that both TAVR and SAVR are associated with improved survival as compared to MT throughout a median duration of follow-up of seven years. Moreover, repeat interventions for bioprosthetic valve degeneration are rare.
There was no external funding.
Dr Pilgrim received research grants to the institution from Biotronik, Boston Scientific and Edwards Lifesciences and speaker fees from Biotronik and Boston Scientific. Dr. Räber has received speaker fees from AstraZeneca, Amgen, Biotronik, Abbott and Sanofi and research grants from Abbott, Sanofi and Regeneron. Dr Wenaweser has received lecture and proctoring fees from Medtronic and Edwards Lifesciences. Dr Windecker has received research grants to the institution from Biotronik and St Jude. All other authors report no conflicts of interest.
1 Aronow WS , Kronzon I . Prevalence and severity of valvular aortic stenosis determined by Doppler echocardiography and its association with echocardiographic and electrocardiographic left ventricular hypertrophy and physical signs of aortic stenosis in elderly patients. Am J Cardiol. 1991;67(8):776–7. doi:.https://doi.org/10.1016/0002-9149(91)90542-S
2 Kapadia SR , Leon MB , Makkar RR , Tuzcu EM , Svensson LG , Kodali S , et al.; PARTNER trial investigators. 5-year outcomes of transcatheter aortic valve replacement compared with standard treatment for patients with inoperable aortic stenosis (PARTNER 1): a randomised controlled trial. Lancet. 2015;385(9986):2485–91. doi:.https://doi.org/10.1016/S0140-6736(15)60290-2
3 Mack MJ , Leon MB , Smith CR , Miller DC , Moses JW , Tuzcu EM , et al.; PARTNER 1 trial investigators. 5-year outcomes of transcatheter aortic valve replacement or surgical aortic valve replacement for high surgical risk patients with aortic stenosis (PARTNER 1): a randomised controlled trial. Lancet. 2015;385(9986):2477–84. doi:.https://doi.org/10.1016/S0140-6736(15)60308-7
4 Vollenbroich R , Stortecky S , Rothenbuehler M , Roost E , Sakiri E , Franzone A , et al. Very long term outcomes of patients with severe aortic stenosis: the impact of treatment modality. Eur Heart J. 2017;38(suppl.1):482. doi:.https://doi.org/10.1093/eurheartj/ehx501.P482
5 Wenaweser P , Pilgrim T , Kadner A , Huber C , Stortecky S , Buellesfeld L , et al. Clinical outcomes of patients with severe aortic stenosis at increased surgical risk according to treatment modality. J Am Coll Cardiol. 2011;58(21):2151–62. doi:.https://doi.org/10.1016/j.jacc.2011.05.063
6 Andersen PK , Abildstrom SZ , Rosthøj S . Competing risks as a multi-state model. Stat Methods Med Res. 2002;11(2):203–15. doi:.https://doi.org/10.1191/0962280202sm281ra
7 Gray RJ . A class of k-sample tests for comparing the cumulative incidence of a competing risk. Ann Stat. 1988;16(3):1141–54. doi:.https://doi.org/10.1214/aos/1176350951
8Klein JP, Moeschberger ML. Survival analysis: Techniques for censored and truncated data. Springer Science & Business Media; 2006.
9Gray B, Gray MB, Gray R. The cmprsk package. The Comprehensive R Archive network. 2004.
10 Pilgrim T , Englberger L , Rothenbühler M , Stortecky S , Ceylan O , O’Sullivan CJ , et al. Long-term outcome of elderly patients with severe aortic stenosis as a function of treatment modality. Heart. 2015;101(1):30–6. doi:.https://doi.org/10.1136/heartjnl-2014-306106
11 Foroutan F , Guyatt GH , O’Brien K , Bain E , Stein M , Bhagra S , et al. Prognosis after surgical replacement with a bioprosthetic aortic valve in patients with severe symptomatic aortic stenosis: systematic review of observational studies. BMJ. 2016;354:i5065. doi:.https://doi.org/10.1136/bmj.i5065
There was no external funding.
Dr Pilgrim received research grants to the institution from Biotronik, Boston Scientific and Edwards Lifesciences and speaker fees from Biotronik and Boston Scientific. Dr. Räber has received speaker fees from AstraZeneca, Amgen, Biotronik, Abbott and Sanofi and research grants from Abbott, Sanofi and Regeneron. Dr Wenaweser has received lecture and proctoring fees from Medtronic and Edwards Lifesciences. Dr Windecker has received research grants to the institution from Biotronik and St Jude. All other authors report no conflicts of interest.