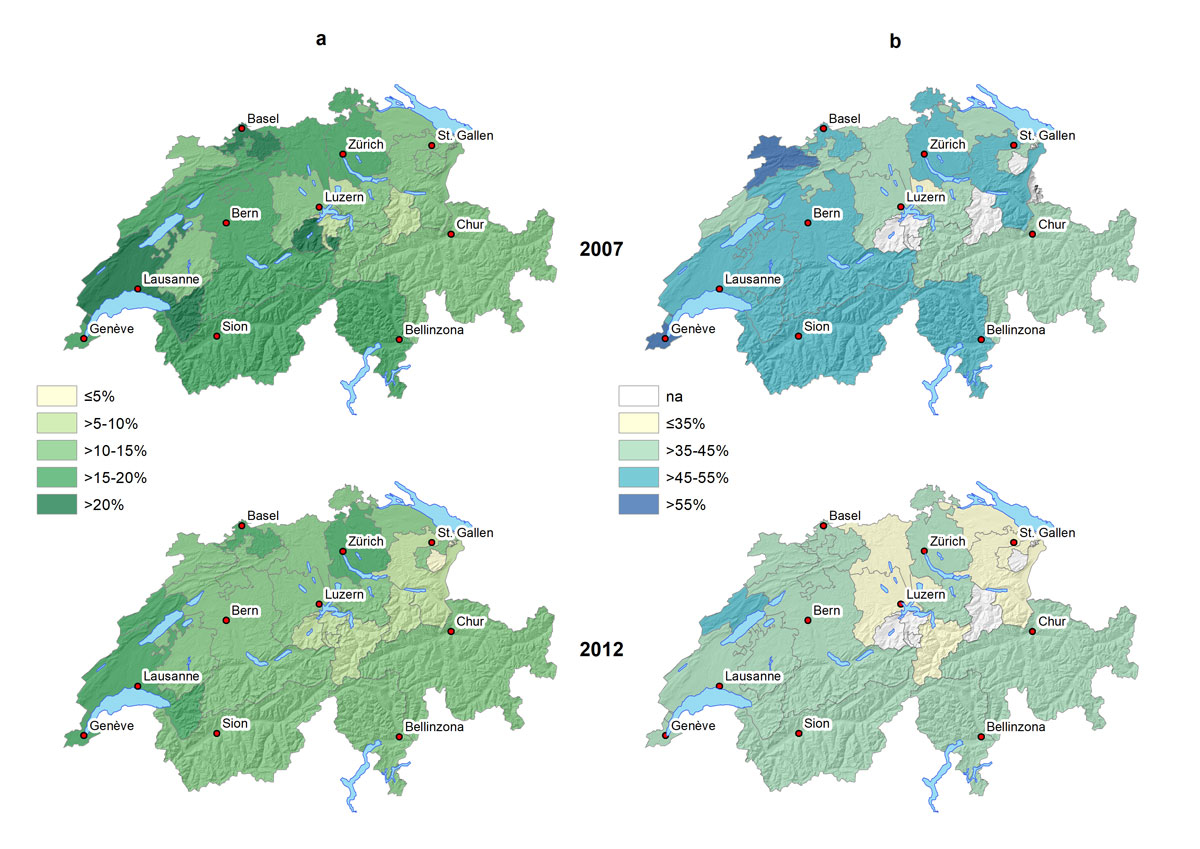
Figure 1 Geographical distribution of people reporting having been vaccinated for influenza in the last 12 months in Switzerland, 2007 and 2012. Panel A, overall; panel B, people aged ≥65 years. na = not applicable (no. of respondents <100).
DOI: https://doi.org/10.4414/smw.2019.14705
Within the last 150 years, six major influenza pandemics, in 1889, 1900, 1918, 1957, 1968 and 2009, have killed millions of people [1]. But even in years when there is no pandemic, seasonal influenza epidemics represent an important public health burden across the globe [2]. Yearly seasonal influenza epidemics cause 3 to 5 million cases of severe illness and kill from 250,000 to 500,000 persons [3], particularly infants, the elderly and the chronically ill. Influenza also raises mortality among those with certain bacterial diseases such as tuberculosis [4, 5]. A recent European report ranked influenza highest in the burden of infectious diseases, measured in disability-adjusted life years (DALYs), after tuberculosis, human immunodeficiency virus / acquired immunodeficiency syndrome (HIV/AIDS), and invasive pneumococcal diseases [6]. European recommendations set a target of a vaccination uptake of 75% among the elderly people [7]. The Netherlands achieved the highest uptake with >80% in elderly people, and the UK almost reached the target with an uptake of 74% in 2009/2010 [7].
In Switzerland, influenza is responsible for roughly 110,000 to 280,000 medical consultations and 1000 to 5000 hospitalisations every year [8]. The annual number of influenza-attributable deaths based on modelling of the cause of mortality 1969–1999 is between 600 and 700, which is about twice the official count of influenza deaths [9]. Estimates of mortality increase in all age and population groups, but particularly in the elderly. The Federal Office of Public Health (FOPH) in Switzerland has had vaccine recommendations in place since 2007, which target mainly elderly people, but also those with chronic illnesses (including children older than 6 months), premature infants, pregnant women and those who are resident in long-term healthcare facilities or are in regular contact with vulnerable populations [10]. For these people at risk, vaccination costs are covered by Swiss mandatory health insurance. Vaccinations are mainly delivered by general practitioners and, to a small degree, at pharmacies offering this service in about half of the cantons [11]. However, there is little information on trends in influenza vaccine uptake at a national level to improve the vaccine uptake and guide future vaccination programs. We studied trends and associations of sociodemographic characteristics and health-related factors with influenza vaccination practices in Switzerland in 2007 and 2012 (overall and ≥65 years) using data from the nationwide representative health surveys.
The Swiss Health Interview Survey (SHIS) is a cross-sectional survey conducted every 5 years since 1992 by the Swiss Federal Statistical Office (SFSO). A multistage probability sample is randomly drawn from all residents in Switzerland not living in institutions, as previously reported [12–14]. The health survey collects data through computer assisted telephone interviews and written self-administered questionnaires. The interviews are conducted in the three official languages (German, French and Italian) between January and December of the year of survey.
We analysed the two most recently available data sets, 2007 and 2012. Since questions on influenza vaccination were included in the written questionnaire, we used only survey data from the written forms. We included 32,750 respondents who responded to a written questionnaire, 14,393 in 2007 and 18,357 in 2012.
There were two main questions about influenza vaccination:
The questionnaire also included questions on nationality, profession and sociodemographic and socioeconomic information. We also collected health-related information on chronic diseases including diabetes, cancer, and lung, cerebrovascular, kidney and cardiovascular disease. The level of respondents’ health insurance bearing upon hospital stays and different levels of comfort, choice of physicians and use of any alternative therapy was recorded as well.
Pregnancy was recorded as current pregnancy among women 15 to 49 years old. Alternative therapy, in the past 12 months, included acupuncture, traditional Chinese medicine, homeopathy, and osteopathy. Current chronic conditions included the lung diseases bronchial asthma, chronic bronchitis and emphysema. Diabetes was defined by the use of any diabetic drug, cardiovascular disease by the use of any heart medication, and all other chronic diseases were recorded as self-reported. Employment in a healthcare profession was recorded in the event of any profession in the healthcare system (in the 2007 survey, veterinary professions were also included in this category).
For each of the two survey years, we calculated the proportions of the population (overall and ≥65 years) that reported having been vaccinated within the last 12 months; the first proportion included the data of the second. We used univariate and multivariate logistic regression models to estimate associations between vaccination status and patient/health-related factors, presented as unadjusted and adjusted odds ratios (aORs). We also performed multivariate logistic regression models that included an interaction term with the year of survey and the variable of interest. In all analyses, we used the SFSO’s survey weights and reported all proportions and ORs with the corresponding 95% confidence intervals (CIs) derived from robust standard error calculations. We considered p-values <0.05 as statistically significant. All analyses were performed in Stata (version 15.1, Corporation, College Station, Texas, USA).
We visualised geographical distributions of the population that reported vaccination for influenza at the cantonal level using ArcGIS version 10.5 (Redlands, CA, USA).
Data were anonymised before analysis. We obtained permission to analyse and publish the data through a contract with the SFSO (Ref. 624.110-1).
The overall proportion of persons reporting having been vaccinated at some time was 33.6% (95% CI 32.9–34.3). The average frequency of persons reporting vaccination for influenza within the past 12 months was 15.2% (95% CI 14.7–15.7), having dropped from 16.4% (95% CI 15.6–17.2) in 2007 to 14.1% (95% CI 13.5–14.8) in 2012 (table 1, p <0.001). In those ≥65 years old, the principal target population as recommended by the FOPH, the average frequency of influenza vaccination was 42.6% (95% CI 41.1–44.0), having dropped from 47.8% (95% CI 45.7–49.9) in 2007 to 38.5% (95% CI 36.6–40.5) in 2012 (p <0.001).
Table 1 Percent of people reporting having been vaccinated for influenza in the last 12 months in Switzerland, 2007 and 2012, overall and among people ≥65 years old. Results are presented as % (95% confidence interval).
| Characteristic | 2007 | 2012 | |||
|---|---|---|---|---|---|
| All | ≥65 years old | All | ≥65 years old | ||
| Total | 16.37 (15.61–17.16) | 47.79 (45.66–49.93) | 14.09 (13.45–14.75) | 38.53 (36.60–40.49) | |
| Age group, years | 15–19 | 7.75 (5.32–11.16) | – | 5.23 (3.91–6.97) | – |
| 20–29 | 5.45 (3.98–7.42) | – | 4.94 (3.92–6.20) | – | |
| 30–39 | 7.05 (5.80–8.56) | – | 4.55 (3.70–5.59) | – | |
| 40–49 | 8.80 (7.43–10.39) | – | 6.67 (5.72–7.77) | – | |
| 50–64 | 14.94 (13.51–16.49) | – | 12.65 (11.46–13.94) | – | |
| 65–75 | 41.64 (38.90–44.44) | 41.64 (38.90–44.44) | 29.31 (27.28–31.43) | 29.31 (27.28–31.43) | |
| >75 | 55.24 (51.94–58.50) | 55.24 (51.94–58.50) | 48.99 (45.73–52.26) | 48.99 (45.73–52.26) | |
| Sex | Male | 15.74 (14.67–16.86) | 48.69 (45.39–52.00) | 13.52 (12.67–14.43) | 38.47 (35.84–41.17) |
| Female | 16.97 (15.90–18.09) | 47.11 (44.31–49.92) | 14.63 (13.71–15.60) | 38.57 (35.84–41.38) | |
| Pregnancy (current)* | Yes | 2.25 (0.62–7.90) | – | 5.11 (4.40–5.94) | – |
| No | 7.88 (6.65–9.30) | – | 8.95 (4.91–15.75) | – | |
| BMI group | Underweight | 12.01 (8.72–16.32) | 53.33 (39.66–66.52) | 14.30 (11.07–18.29) | 40.59 (29.03–53.30) |
| Normal | 13.65 (12.72–14.64) | 44.70 (41.63–47.81) | 12.24 (11.44–13.08) | 39.43 (36.55–42.38) | |
| Overweight | 20.62 (19.12–22.21) | 50.42 (47.02–53.82) | 15.99 (14.78–17.29) | 37.26 (34.15–40.49) | |
| Obese | 22.98 (20.05–26.20) | 52.81 (46.13–59.39) | 18.21 (16.16–20.44) | 38.55 (33.55–43.79) | |
| Language region | German-speaking | 15.45 (14.49–16.47) | 45.93 (43.16–48.72) | 13.53 (12.70–14.41) | 37.75 (35.23–40.33) |
| French-speaking | 18.31 (17.01–19.68) | 53.65 (50.11–57.16) | 15.94 (14.87–17.07) | 41.31 (38.13–44.56) | |
| Italian-speaking | 16.89 (14.12–20.08) | 42.74 (35.42–50.40) | 11.82 (9.92–14.02) | 34.89 (28.31–42.10) | |
| Setting | Urban | 17.30 (16.39–18.25) | 48.70 (46.23–51.17) | 15.07 (14.32–15.85) | 39.80 (37.68–41.97) |
| Rural | 13.82 (12.49–15.26) | 45.00 (40.76–49.32) | 11.38 (10.20–12.67) | 34.41 (30.08–39.01) | |
| Citizenship | Swiss | 17.13 (16.35–17.94) | 48.06 (45.92–50.21) | 15.20 (14.48–15.94) | 38.65 (36.63–40.71) |
| Non-Swiss | 13.46 (11.43–15.78) | 45.44 (36.42–54.78) | 10.37 (9.08–11.82) | 37.46 (31.22–44.15) | |
| Education level | Primary | 24.53 (21.78–27.51) | 44.79 (40.49–49.17) | 14.74 (13.11–16.53) | 33.77 (29.48–38.35) |
| Apprenticeship | 15.14 (14.19–16.14) | 47.41 (44.50–50.32) | 14.53 (13.56–15.56) | 39.19 (36.50–41.94) | |
| Secondary | 11.44 (8.58–15.12) | 45.04 (32.06–58.73) | 13.03 (11.08–15.25) | 45.74 (38.41–53.25) | |
| Tertiary | 16.31 (14.90–17.81) | 52.77 (47.99–57.51) | 13.37 (12.33–14.50) | 39.51 (35.66–43.50) | |
| Smoking | Never smoked | 16.55 (15.46–17.70) | 47.31 (44.40–50.24) | 13.94 (13.02–14.90) | 37.22 (34.52–39.99) |
| Former smoker | 22.50 (20.79–24.31) | 50.32 (46.56–54.08) | 20.21 (18.71–21.80) | 41.55 (38.31–44.86) | |
| Current smoker | 10.89 (9.71–12.19) | 43.20 (37.63–48.93) | 9.58 (8.63–10.63) | 36.34 (31.30–41.71) | |
| Self-reported health status | Very good | 10.97 (9.50–12.63) | 34.51 (29.18–40.25) | 8.50 (7.73–9.34) | 28.43 (24.83–32.32) |
| Good | 14.76 (13.88–15.67) | 45.57 (42.89–48.29) | 14.22 (13.26–15.24) | 37.56 (34.77–40.43) | |
| Moderate | 33.13 (3.10–36.31) | 58.16 (53.28–62.90) | 25.87 (23.69–28.19) | 46.50 (42.59–50.46) | |
| Bad | 38.55 (31.45–46.17) | 65.80 (54.60–75.48) | 33.85 (28.61–39.51) | 54.21 (44.11–63.97) | |
| Very bad | 44.33 (27.56–62.49) | 73.69 (37.76–92.82) | 29.13 (17.36–44.58) | 41.73 (21.00–65.86) | |
| Hospital stay insurance | Basic | 14.04 (13.15–14.99) | 44.87 (42.07–47.70) | 12.30 (11.53–13.12) | 35.40 (32.83–38.05) |
| Semiprivate | 21.39 (19.58–23.33) | 51.23 (47.02–55.43) | 19.74 (18.17–21.41) | 41.40 (37.84–45.05) | |
| Private | 28.34 (25.47–31.40) | 55.06 (49.58–60.43) | 27.15 (24.34–30.15) | 50.55 (45.37–55.72) | |
| Other | 23.45 (15.11–34.52) | 62.63 (35.66–83.52) | 9.65 (6.27–14.56) | 25.94 (12.61–45–95) | |
| Use of any alternative medicine therapy† | Yes | 16.70 (15.35–18.14) | 45.57 (41.89–49.29) | 11.30 (10.26–12–42) | 32.10 (28.52–35.89) |
| No | 16.23 (15.32–17.18) | 48.90 (46.28–51.52) | 15.03 (14.27–15.84) | 40.31 (38.07–42.58) | |
| Chronic diseases‡ | Diabetes | 41.51 (36.70–46.48) | 59.95 (53.36–66.20) | 37.58 (33.48–41.87) | 49.58 (43.97–55.20) |
| Lung disease | 38.19 (31.46–45.41) | 63.78 (53.04–73.29) | 33.04 (26.24–40.64) | 48.08 (37.15–59.21) | |
| Cerebrovascular disease | 47.68 (37.90–57.64) | 61.30 (48.91–72.38) | 39.96 (32.02–48.46) | 49.85 (39.77–59.94) | |
| Cardiovascular disease | 54.48 (50.41–58.48) | 64.16 (59.64–68.44) | 42.50 (38.96–46.12) | 51.97 (47.51–56.39) | |
| Kidney disease | 22.40 (18.34–27.05) | 52.57 (42.50–62.44) | 23.44 (19.74–27.60) | 43.40 (36.14–50.96) | |
| Cancer | 30.47 (25.84–35.53) | 51.47 (43.40–59.47) | 29.92 (26.11–34.03) | 46.74 (40.60–52.99) | |
| Healthcare profession§ | 17.56 (15.47–19.86) | – | 15.15 (13.16–17.37) | – | |
95% CI = 95% confidence interval; BMI = body mass index * Current pregnancy in women 15 to 49 years † Use of any alternative therapy in the past 12 months (including acupuncture, traditional Chinese medicine, homeopathy, osteopathy) ‡ Current chronic diseases vs. no disease (reference); lung diseases: bronchial asthma, chronic bronchitis and emphysema; diabetes: use of any diabetic drug; cardiovascular disease: use of any heart medication; all other diseases: self-reported § Any profession in the healthcare system (in the 2007 survey, the veterinary professions were also included in this category) vs any other profession (reference).
The decline in self-reported influenza vaccination was more pronounced in both the 15–19 year age group (aOR 0.5, 95% CI 0.3–1.0) and those 65 to 75 years old (aOR 0.6, 95% CI 0.5–0.7, p-value from test for interaction 0.01, see supplementary table S1 in appendix 1). The decline was also more pronounced in those with less education (aOR 0.6, 95% CI 0.4-0.7, p-value from test for interaction 0.03), except in the ≥65 age group. An increase in vaccination rate was seen in pregnant women between 2007 and 2012 (aOR 4.5, 95% CI 1.0–20.5, p = 0.02). The temporal changes were not associated with age, language region, urban/rural setting, citizenship, use of any alternative medicine therapy, or type of hospital stay insurance (p >0.05, table S1).
In both 2007 and 2012, the proportion of self-reported influenza vaccination was highest in the age group ≥65 years, and also higher in people living in urban settings, in the French-speaking region, and among Swiss citizens, persons with a only primary education, former smokers and persons with health insurance beyond mandatory basic insurance that covered semiprivate or private hospital stays (table 1). Persons with chronic diseases were also vaccinated for influenza more frequently (range 20–50%). A lower proportion of self-reported vaccination was observed in the younger age groups of 15–50 years (range 5–10%), the German-speaking area of Switzerland, current smokers and persons who reported their health status as very good. Pregnant women had the lowest frequency of influenza vaccination (2.3%, 95% CI 0.6–7.9, table 1), but the frequency increased between 2007 and 2012 (table S1). The regional differences in the vaccination status in the last 12 months in the overall population and the ≥65 age group are shown in figures 1A and 1B, respectively.
Figure 1 Geographical distribution of people reporting having been vaccinated for influenza in the last 12 months in Switzerland, 2007 and 2012. Panel A, overall; panel B, people aged ≥65 years. na = not applicable (no. of respondents <100).
As shown in table 2, having been vaccinated in the last 12 months was positively associated with age ≥65 years, living in French-speaking and urban areas, history of smoking, bad self-reported health status, private/semiprivate hospital stay insurance, and following a healthcare profession. Influenza vaccination was more frequent in participants with another underlying condition. Use of any alternative medicine therapy was negatively associated with reporting influenza vaccination (aOR 0.8, 95% CI 0.7–0.9). Influenza vaccination was also less likely in 2012 (aOR 0.7, 95% CI 0.7–0.8) than in 2007, and even less likely among persons ≥65 years old (aOR 0.6, 95% CI 0.5–0.7). We found no association with sex, body mass index, non-Swiss citizenship or educational level (table 2). Similar findings were observed when analysing only participants ≥65 years old. Supplementary table S2 in appendix 1 shows unadjusted and adjusted ORs of the associations between self-reported vaccination for influenza in the last 12 months and sociodemographic characteristics and health-related factors.
Table 2 Associations of having been vaccinated for influenza in the last 12 months with sociodemographic characteristics and health-related factors (as compared to no vaccination) in Switzerland, 2007 and 2012, overall and among people ≥65 years old.
| Characteristic | All | ≥65 years old | ||||
|---|---|---|---|---|---|---|
|
Adjusted OR
(95% CI) |
p-value |
Adjusted OR
(95% CI) |
p-value | |||
| Year of survey | 2007 | 1 | <0.001 | 1 | <0.001 | |
| 2012 | 0.74 (0.66–0.84) | 0.64 (0.54–0.74) | ||||
| Age group, years | 15–19 | 1.14 (0.60–2.14) | <0.001 | – | <0.001 | |
| 20–29 | 1 | – | ||||
| 30–39 | 1.25 (0.81–1.93) | – | ||||
| 40–49 | 1.56 (1.05–2.34) | – | ||||
| 50–64 | 2.81 (1.92–4.10) | – | ||||
| 65–75 | 8.24 (5.61–12.12) | 1 | ||||
| >75 | 15.67 (10.50–23.39) | 1.92 (1.64–2.25) | ||||
| Sex | Male | 1 | 0.32 | 1 | 0.34 | |
| Female | 0.94 (0.82–1.07) | 1.09 (0.91–1.30) | ||||
| BMI group | Underweight | 1 | 0.99 | 1 | 0.98 | |
| Normal | 1.02 (0.71–1.47) | 0.98 (0.55–1.74) | ||||
| Overweight | 1.01 (0.70–1.47) | 1.00 (0.56–1.79) | ||||
| Obese | 1.05 (0.71–1.54) | 1.03 (0.57–1.88) | ||||
| Language region | German-speaking | 1 | 0.003 | 1 | 0.13 | |
| French-speaking | 1.22 (1.09–1.38) | 1.16 (0.99–1.37) | ||||
| Italian-speaking | 1.00 (0.80–1.24) | 0.93 (0.69–1.25) | ||||
| Setting | Urban | 1.20 (1.04–1.38) | 0.011 | 1.18 (0.97–1.45) | 0.099 | |
| Rural | 1 | 1 | ||||
| Citizenship | Swiss | 1 | 0.49 | 1 | 0.73 | |
| Non-Swiss | 1.07 (0.88–1.30) | 0.95 (0.70–1.28) | ||||
| Education level | Primary | 1 | 0.09 | 1 | 0.055 | |
| Apprenticeship | 1.06 (0.88–1.27) | 1.28 (1.02–1.59) | ||||
| Secondary | 1.19 (0.89–1.59) | 1.37 (0.95–1.96) | ||||
| Tertiary | 1.24 (1.01–1.53) | 1.44 (1.10–1.88) | ||||
| Smoking | Never smoked | 1 | 0.045 | 1 | 0.11 | |
| Former smoker | 1.15 (1.01–1.32) | 1.21 (1.01–1.44) | ||||
| Current smoker | 0.97 (0.83–1.13) | 1.06 (0.84–1.34) | ||||
| Self-reported health status | Very good | 1 | <0.001 | 1 | <0.001 | |
| Good | 1.19 (1.00–1.41) | 1.36 (1.07–1.72) | ||||
| Moderate | 1.54 (1.27–1.88) | 1.71 (1.30–2.24) | ||||
| Bad | 2.44 (1.81–3.30) | 2.18 (1.41–3.36) | ||||
| Very bad | 2.18 (1.12–4.21) | 2.02 (0.85–4.80) | ||||
| Hospital stay insurance | Basic | 1 | <0.001 | 1 | <0.001 | |
| Semiprivate | 1.40 (1.22–1.60) | |||||
| Private | 1.81 (1.53–2.14) | 1.39 (1.15–1.67) | ||||
| Other | 1.30 (0.77–2.18) | 1.89 (1.51–2.37) | ||||
| Use of any alternative medicine therapy* | Yes | 0.79 (0.69–0.89) | <0.001 | 0.70 (0.58–0.83) | <0.001 | |
| No | 1 | |||||
| Chronic diseases† | Diabetes | 1.62 (1.34–1.96) | <0.001 | 1.46 (1.16–1.82) | 0.001 | |
| Lung disease | 2.43 (1.69–3.49) | <0.001 | 1.88 (1.18–3.00) | 0.008 | ||
| Cerebrovascular disease | 1.17 (0.83–1.64) | 0.38 | 1.06 (0.73–1.54) | 0.75 | ||
| Cardiovascular disease | 1.49 (1.28–1.74) | <0.001 | 1.43 (1.20–1.71) | <0.001 | ||
| Kidney disease | 1.01 (0.80–1.28) | 0.91 | 0.90 (0.66–1.22) | 0.48 | ||
| Cancer | 1.26 (1.41–2.09) | 0.030 | 1.11 (0.86–1.43) | 0.44 | ||
| Healthcare profession ‡ | 1.71 (1.41–2.09) | <0.001 | – | |||
95% CI = 95% confidence interval; BMI = body mass index; OR = odds ratio Model adjusted for all variables included in the table. Unadjusted ORs are shown in supplementary table S2 in appendix 1. * Use of any alternative therapy in the past 12 months (including acupuncture, traditional Chinese medicine, homeopathy, osteopathy) † Current chronic disease versus no chronic disease (reference); lung diseases: bronchial asthma, chronic bronchitis and emphysema vs no lung disease (reference); diabetes: use of any diabetic drug vs no diabetes (reference); cardiovascular disease: use of any heart medication vs no cardiovascular disease (reference); all other diseases: self-reported disease vs no disease (reference) ‡ Any profession in the health care system (in the 2007 survey, the veterinary professions were also included in this category) vs. any other profession (reference)
Self-reported seasonal influenza vaccination declined overall and in elderly persons from 2007 to 2012. The decline over time was associated with age and education level. In Switzerland and other countries, influenza vaccination is recommended (by the FOPH in Switzerland) for elderly people, those who have chronic illnesses (including children older than 6 months), premature infants, pregnant women and those who are resident in long-term healthcare facilities or are in regular contact with vulnerable populations. Overall influenza vaccine coverage in Switzerland in the years 2007 and 2012 averaged ~15%; it was ~40% among those ≥65 years, ~50% among chronically ill people, and ~15% among healthcare staff. Although not directly comparable, a study on institutional influenza vaccination coverage in 1983 showed similar coverage of 40% for all patients, which was slightly higher, at 47%, for persons ≥65 years, and 16% among healthcare staff [15]. A study in 2000 from the Canton of Geneva reported vaccination coverage of 59% in the geriatric population after several campaign activities between 1991 and 2000 [16]. Influenza vaccine uptake in Switzerland is therefore still markedly lower than the European target of 75% among elderly people [7].
Of further concern to public health are vaccination coverage that, overall, is declining, and vaccine hesitancy. In recent years, the European Union has seen large outbreaks of vaccine-preventable diseases such as measles, rubella and influenza, and a roadmap has identified steps to improve the situation [17]. Thus have European countries committed to intensified efforts to increase vaccination coverage for influenza and other infectious diseases [18]. In contrast to seasonal influenza vaccination, the coverage in measles vaccination among young adults in Switzerland seems to have increased to almost 90%, possibly owing to nationwide campaigns and a national measles strategy [19]. This could serve as a model for influenza vaccination coverage as well.
The relationship between vaccination uptake, knowledge, attitudes and awareness is complex [20]. The main reasons for young people not being vaccinated against influenza are underestimation of or little knowledge about disease severity, vaccine side effects and access to and the cost of vaccines [21–23]. A study in France showed that even among persons who were aware of serious and fatal influenza complications, 60% were unaware of having an indication for influenza vaccination [21]. Vaccine hesitancy may also arise from the seasonal vaccine’s varying efficiency. During the last influenza season of 2017/2018, the recommended vaccine composition only partially matched the circulating strains, which resulted in moderate vaccine efficiency [24, 25]. However, a recent mathematical model of influenza transmission and vaccination has demonstrated that the health burden associated with influenza is more sensitive to changes in vaccination coverage than to changes in vaccine efficacy [25]. This underlines the importance of high influenza vaccination coverage in the population.
We observed that both persons in the 15–50 age group and pregnant women were less likely to have been vaccinated against influenza than persons ≥65 years old. Similarly, younger persons in the US were less likely to have received influenza vaccination than elderly persons in 2011/2012 [26]. Although elderly people remain the main target population, children should also be recognised in vaccine recommendations. Community studies in the US have shown that children are very vulnerable to seasonal influenza [27, 28]. Influenza transmission rates are high in schools and children easily transmit the virus to household members and into their community [29, 30]. Several school-based influenza vaccination studies have been conducted in the US and showed relative reductions in influenza-like illness in both children and adults, high school days lost and in adults work days lost [29]. In our study, only 2.3% of pregnant women were vaccinated, but the frequency increased substantially between 2007 and 2012. Influenza vaccination for healthy pregnant women in Switzerland has been recommended only since 2010. The main concern about influenza vaccination among pregnant women is effects on fetal development [31–35]. However, recent studies have found no evidence for an association between maternal influenza vaccination during pregnancy and adverse outcomes [31, 35].
Influenza vaccination has been shown to prevent death, morbidity, hospital admissions and other negative health-related outcomes, particularly among chronically ill people [36–41], but also in children [33] and pregnant women [42]. Apart from influenza vaccination, everyday preventive actions are also suitable measures to limit the spread of the disease [8]. These include trying to avoid close contact with sick people, covering one’s nose and mouth while coughing or sneezing, throwing away tissues after use and regularly washing hands.
Our study is limited by the fact that the vaccine status was self-reported and that persons younger than 15 years were not included in the survey. A strength of the study is that the SHIS is a nationwide, representative survey that is repeated every 5 years using the same methodology. In addition, analyses were weighted and adjusted for a wide range of important cofactors.
The last, unusually long influenza season of 2017/2018 [33, 43], with possibly higher mortality than previous years, is a further reminder of the need to strengthen efforts to increase influenza vaccination uptake, particularly in the younger and elderly populations. We therefore need new approaches to increase vaccination coverage, which could, for example, include the use social media, chats and web-based games [44, 45]. Recommendations by healthcare professionals, such as client reminder/recall and standing orders, also should be considered to improve influenza vaccination coverage [46]. In conclusion, our findings should be considered in future adaptation of influenza vaccination policies and intervention programmes using novel approaches such as social media. Further studies should test these approaches in pragmatic clinical trials and programme evaluation studies.
The appendix is available in a separate file at https://smw.ch/en/article/doi/smw.2019.14705/.
We thank the Swiss Federal Statistical Office for providing the data of the Swiss Health Survey 2007 and 2012, and the people who participated in the surveys.
No financial support and no other potential conflict of interest relevant to this article was reported.
1 Potter CW . A history of influenza. J Appl Microbiol. 2001;91(4):572–9. doi:.https://doi.org/10.1046/j.1365-2672.2001.01492.x
2 Nicholson KG , Wood JM , Zambon M . Influenza. Lancet. 2003;362(9397):1733–45. doi:.https://doi.org/10.1016/S0140-6736(03)14854-4
3 Fauci AS , Touchette NA , Folkers GK . Emerging infectious diseases: a 10-year perspective from the National Institute of Allergy and Infectious Diseases. Emerg Infect Dis. 2005;11(4):519–25. doi:.https://doi.org/10.3201/eid1104.041167
4 Walaza S , Cohen C , Nanoo A , Cohen AL , McAnerney J , von Mollendorf C , et al. Excess mortality associated with influenza among tuberculosis deaths in South Africa, 1999-2009. PLoS One. 2015;10(6):e0129173. doi:.https://doi.org/10.1371/journal.pone.0129173
5 Zürcher K , Zwahlen M , Ballif M , Rieder HL , Egger M , Fenner L . Influenza pandemics and tuberculosis mortality in 1889 and 1918: analysis of historical data from Switzerland. PLoS One. 2016;11(10):e0162575. doi:.https://doi.org/10.1371/journal.pone.0162575
6 Cassini A , Colzani E , Pini A , Mangen MJ , Plass D , McDonald SA , et al.; On Behalf Of The BCoDE Consortium. Impact of infectious diseases on population health using incidence-based disability-adjusted life years (DALYs): results from the Burden of Communicable Diseases in Europe study, European Union and European Economic Area countries, 2009 to 2013. Euro Surveill. 2018;23(16). doi:.https://doi.org/10.2807/1560-7917.ES.2018.23.16.17-00454
7World Health Organization ROfE. Evaluation of seasonal influenza vaccination policies and coverage in the WHO European Region. Available at: http://www.euro.who.int/__data/assets/pdf_file/0003/241644/Evaluation-of-seasonal-influenza-vaccination-policies-and-coverage-in-the-WHO-European-Region.pdf 2014.
8Federal Office of Public Health. National Seasonal Flu (Influenza) Vaccination Website. Available at: https://www.bag.admin.ch/bag/en/home/krankheiten/krankheiten-im-ueberblick/grippe. 2018.
9 Brinkhof MW , Spoerri A , Birrer A , Hagman R , Koch D , Zwahlen M . Influenza-attributable mortality among the elderly in Switzerland. Swiss Med Wkly. 2006;136(19-20):302–9. doi:.https://doi.org/10.4414/smw.2006.11373
10Federal Office of Public Health. National Influenza Vaccination Website: vaccine recommendations. Available at: https://wwwvaccinateagainstthefluch/en-us/vaccination/impfempfehlungenhtml.
11pharmaSuisse. Impfen in der Apotheke: Bestandsaufnahme und Erfahrungen der Apotheken. Available at: https://impfapotheke.ch/assets/aktuelles/7-pharmasuisse-studie-impfen-2018-08-16.pdf. 2018.
12 Burton-Jeangros C , Cullati S , Manor O , Courvoisier DS , Bouchardy C , Guessous I . Cervical cancer screening in Switzerland: cross-sectional trends (1992-2012) in social inequalities. Eur J Public Health. 2017;27(1):167–73.
13 Fenner L , Kässner A , Berlin C , Egger M , Zwahlen M . Trends in the use of mammography for early breast cancer detection in Switzerland: Swiss Health Surveys 2007 and 2012. Swiss Med Wkly. 2018;148:w14603. doi:.https://doi.org/10.4414/smw.2018.14603
14Swiss Federal Statistical Office. Schweizerische Gesundheitsbefragung 2012. Available at: https://www.bfs.admin.ch/bfs/de/home/statistiken/kataloge-datenbanken/publikationen.assetdetail.349056.html. 2012.
15 Ammon CE . A survey of institutional influenza vaccination in Switzerland. Soz Praventivmed. 2000;45(4):182–7. doi:.https://doi.org/10.1007/BF01359915
16 Toscani L , Gauthey L , Robert CF . The information network of senior citizens in Geneva, Switzerland, and progress in flu vaccination coverage between 1991 and 2000. Vaccine. 2003;21(5-6):393–8. doi:.https://doi.org/10.1016/S0264-410X(02)00411-5
17 The Lancet. Addressing decreasing vaccine coverage in the EU. Lancet. 2018;391(10131):1638. doi:. https://doi.org/10.1016/S0140-6736(18)30942-5
18European Union. EU Manifesto on Influenza Vaccination. Our response to the burden of influenza in Europe. Available at: http://eufightingflucom/manifesto/. 2018.
19 Altpeter E , Wymann MN , Richard JL , Mäusezahl-Feuz M . Marked increase in measles vaccination coverage among young adults in Switzerland: a campaign or cohort effect? Int J Public Health. 2018;63(5):589–99. doi:.https://doi.org/10.1007/s00038-018-1102-x
20 Larson HJ , Jarrett C , Eckersberger E , Smith DM , Paterson P . Understanding vaccine hesitancy around vaccines and vaccination from a global perspective: a systematic review of published literature, 2007-2012. Vaccine. 2014;32(19):2150–9. doi:.https://doi.org/10.1016/j.vaccine.2014.01.081
21 Casalino E , Ghazali A , Bouzid D , Antoniol S , Pereira L , Kenway P , et al.; Emergency Department study group on respiratory viruses. Patient’s behaviors and missed opportunities for vaccination against seasonal epidemic influenza and evaluation of their impact on patient’s influenza vaccine uptake. PLoS One. 2018;13(3):e0193029. doi:.https://doi.org/10.1371/journal.pone.0193029
22 Wendlandt R , Cowling BJ , Chen Y , Havers F , Shifflett P , Song Y , et al. Knowledge, attitudes and practices related to the influenza virus and vaccine among older adults in Eastern China. Vaccine. 2018;36(19):2673–82. doi:.https://doi.org/10.1016/j.vaccine.2018.03.052
23 Wheelock A , Thomson A , Sevdalis N . Social and psychological factors underlying adult vaccination behavior: lessons from seasonal influenza vaccination in the US and the UK. Expert Rev Vaccines. 2013;12(8):893–901. doi:.https://doi.org/10.1586/14760584.2013.814841
24 Sullivan SG , Chilver MB , Carville KS , Deng YM , Grant KA , Higgins G , et al. Low interim influenza vaccine effectiveness, Australia, 1 May to 24 September 2017. Euro Surveill. 2017;22(43). doi:.https://doi.org/10.2807/1560-7917.ES.2017.22.43.17-00707
25 Sah P , Medlock J , Fitzpatrick MC , Singer BH , Galvani AP . Optimizing the impact of low-efficacy influenza vaccines. Proc Natl Acad Sci USA. 2018;115(20):5151–6. doi:.https://doi.org/10.1073/pnas.1802479115
26Centers for Disease Control and Prevention. Seasonal influenza vaccination trends. Available at: https://www.cdc.gov/flu/fluvaxview/1112season.htm. 2012.
27 Glezen WP , Couch RB , MacLean RA , Payne A , Baird JN , Vallbona C , et al. Interpandemic influenza in the Houston area, 1974-76. N Engl J Med. 1978;298(11):587–92. doi:.https://doi.org/10.1056/NEJM197803162981103
28 Shang M , Blanton L , Brammer L , Olsen SJ , Fry AM . Influenza-associated pediatric deaths in the United States, 2010-2016. Pediatrics. 2018;141(4):e20172918. doi:.https://doi.org/10.1542/peds.2017-2918
29 Basurto-Dávila R , Meltzer MI , Mills DA , Beeler Asay GR , Cho BH , Graitcer SB , et al. School-Based Influenza Vaccination: Health and Economic Impact of Maine’s 2009 Influenza Vaccination Program. Health Serv Res. 2017;52(Suppl 2):2307–30. doi:.https://doi.org/10.1111/1475-6773.12786
30 Fiore AE , Epperson S , Perrotta D , Bernstein H , Neuzil K . Expanding the recommendations for annual influenza vaccination to school-age children in the United States. Pediatrics. 2012;129(Suppl 2):S54–62. doi:.https://doi.org/10.1542/peds.2011-0737C
31 Zerbo O , Qian Y , Yoshida C , Fireman BH , Klein NP , Croen LA . Association between influenza infection and vaccination during pregnancy and risk of autism spectrum disorder. JAMA Pediatr. 2017;171(1):e163609. doi:.https://doi.org/10.1001/jamapediatrics.2016.3609
32 Hviid A , Svanström H , Mølgaard-Nielsen D , Lambach P . Association between pandemic influenza A(H1N1) vaccination in pregnancy and early childhood morbidity in offspring. JAMA Pediatr. 2017;171(3):239–48. doi:.https://doi.org/10.1001/jamapediatrics.2016.4023
33 Ferdinands JM , Olsho LE , Agan AA , Bhat N , Sullivan RM , Hall M , et al.; Pediatric Acute Lung Injury and Sepsis Investigators (PALISI) Network. Effectiveness of influenza vaccine against life-threatening RT-PCR-confirmed influenza illness in US children, 2010-2012. J Infect Dis. 2014;210(5):674–83. doi:.https://doi.org/10.1093/infdis/jiu185
34 Zerbo O , Iosif AM , Walker C , Ozonoff S , Hansen RL , Hertz-Picciotto I . Is maternal influenza or fever during pregnancy associated with autism or developmental delays? Results from the CHARGE (CHildhood Autism Risks from Genetics and Environment) study. J Autism Dev Disord. 2013;43(1):25–33. doi:.https://doi.org/10.1007/s10803-012-1540-x
35 Zerbo O , Modaressi S , Chan B , Goddard K , Lewis N , Bok K , et al. No association between influenza vaccination during pregnancy and adverse birth outcomes. Vaccine. 2017;35(24):3186–90. doi:.https://doi.org/10.1016/j.vaccine.2017.04.074
36 Talbot HK , Zhu Y , Chen Q , Williams JV , Thompson MG , Griffin MR . Effectiveness of influenza vaccine for preventing laboratory-confirmed influenza hospitalizations in adults, 2011-2012 influenza season. Clin Infect Dis. 2013;56(12):1774–7. doi:.https://doi.org/10.1093/cid/cit124
37 Pereira M , Williams S , Restrick L , Cullinan P , Hopkinson NS ; London Respiratory Network. Healthcare worker influenza vaccination and sickness absence - an ecological study. Clin Med (Lond). 2017;17(6):484–9. doi:.https://doi.org/10.7861/clinmedicine.17-6-484
38 Phrommintikul A , Kuanprasert S , Wongcharoen W , Kanjanavanit R , Chaiwarith R , Sukonthasarn A . Influenza vaccination reduces cardiovascular events in patients with acute coronary syndrome. Eur Heart J. 2011;32(14):1730–5. doi:.https://doi.org/10.1093/eurheartj/ehr004
39 Colquhoun AJ , Nicholson KG , Botha JL , Raymond NT . Effectiveness of influenza vaccine in reducing hospital admissions in people with diabetes. Epidemiol Infect. 1997;119(3):335–41. doi:.https://doi.org/10.1017/S095026889700825X
40 Liu WC , Lin CS , Yeh CC , Wu HY , Lee YJ , Chung CL , et al. Effect of Influenza Vaccination Against Postoperative Pneumonia and Mortality for Geriatric Patients Receiving Major Surgery: A Nationwide Matched Study. J Infect Dis. 2018;217(5):816–26. doi:.https://doi.org/10.1093/infdis/jix616
41 Arriola CS , Anderson EJ , Baumbach J , Bennett N , Bohm S , Hill M , et al. Does Influenza Vaccination Modify Influenza Severity? Data on Older Adults Hospitalized With Influenza During the 2012-2013 Season in the United States. J Infect Dis. 2015;212(8):1200–8. doi:.https://doi.org/10.1093/infdis/jiv200
42 Mosby LG , Rasmussen SA , Jamieson DJ . 2009 pandemic influenza A (H1N1) in pregnancy: a systematic review of the literature. Am J Obstet Gynecol. 2011;205(1):10–8. doi:.https://doi.org/10.1016/j.ajog.2010.12.033
43 Adlhoch C , Snacken R , Melidou A , Ionescu S , Penttinen P ; The European Influenza Surveillance Network. Dominant influenza A(H3N2) and B/Yamagata virus circulation in EU/EEA, 2016/17 and 2017/18 seasons, respectively. Euro Surveill. 2018;23(13). doi:.https://doi.org/10.2807/1560-7917.ES.2018.23.13.18-00146
44NHS Foundation Trust. The Flu Bee Game web app. Available at: https://focusgames.com/case_studies/Flu%20Bee%20-%20Case%20Study%202018.pdf. 2017.
45 Glanz JM , Wagner NM , Narwaney KJ , Kraus CR , Shoup JA , Xu S , et al. Web-based social media intervention to increase vaccine acceptance: a randomized controlled trial. Pediatrics. 2017;140(6):e20171117. doi:.https://doi.org/10.1542/peds.2017-1117
46 Lu PJ , Srivastav A , Amaya A , Dever JA , Roycroft J , Kurtz MS , et al. Association of provider recommendation and offer and influenza vaccination among adults aged ≥18 years - United States. Vaccine. 2018;36(6):890–8. doi:.https://doi.org/10.1016/j.vaccine.2017.12.016
No financial support and no other potential conflict of interest relevant to this article was reported.