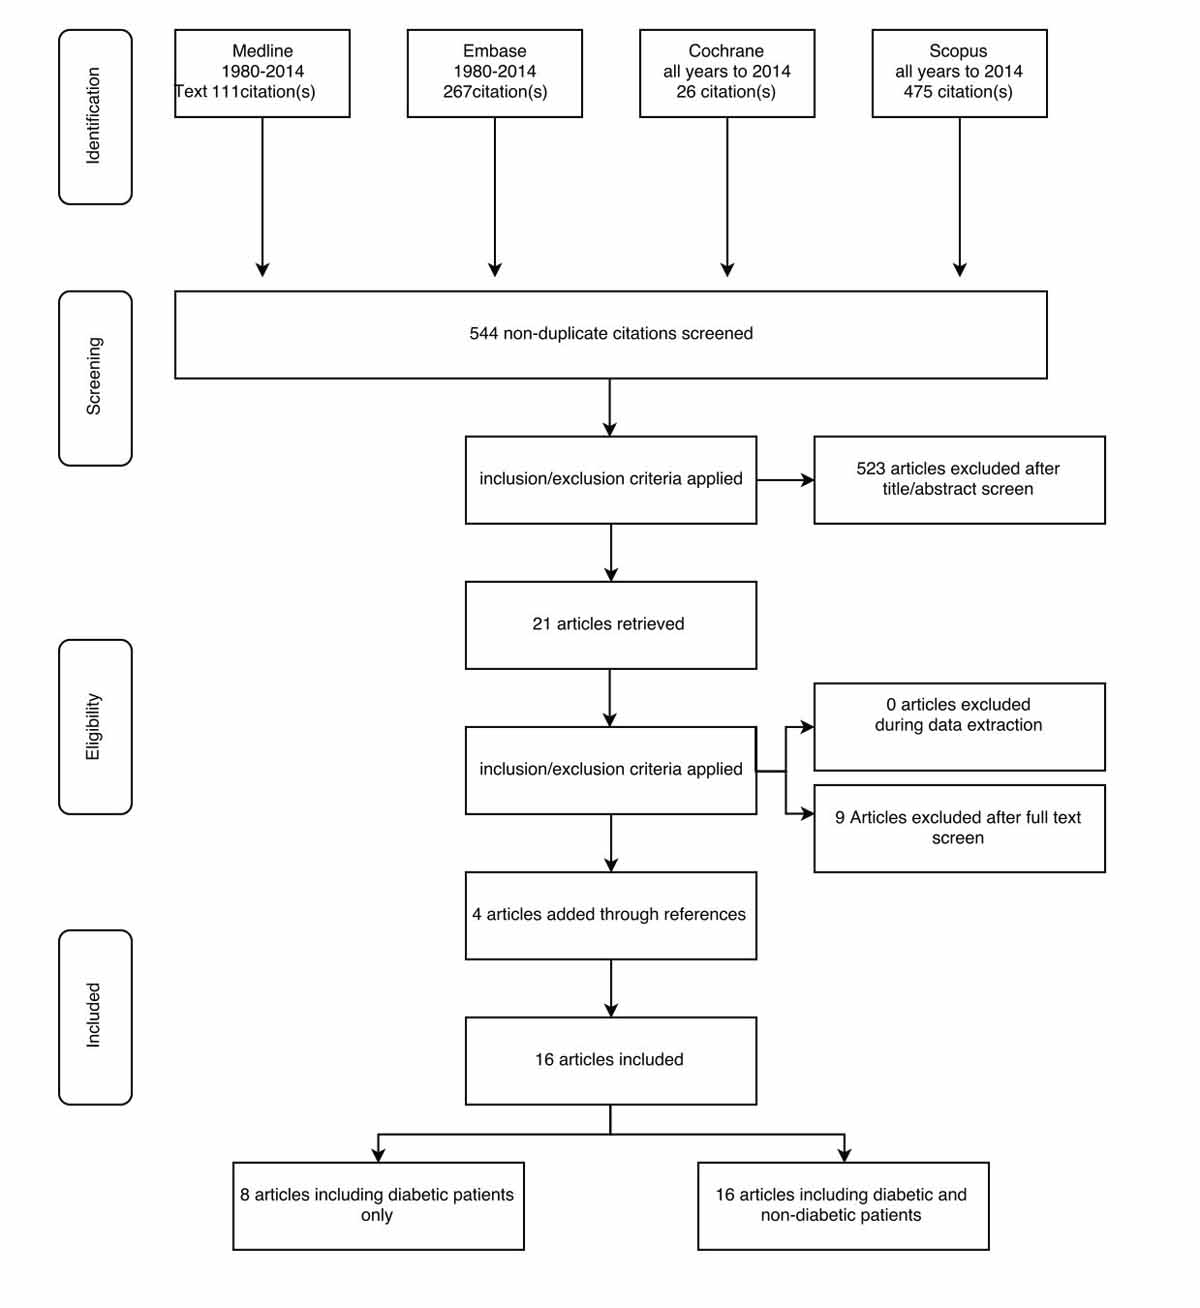
Figure 1 PROSPERO flow chart.
DOI: https://doi.org/10.4414/smw.2018.14633
Obesity is a major health issue worldwide and associated with several comorbidities including type 2 diabetes mellitus (T2DM), cardiovascular diseases and cancer. Bariatric surgery is currently the most effective method to induce weight loss in patients with morbid obesity [1]. Worldwide, the most commonly performed bariatric procedures are laparoscopic roux-en-Y gastric bypass (RYGB) and sleeve gastrectomy (SG). RYGB was considered to be the gold standard procedure for many years, whereas SG is nowadays the most commonly performed bariatric operation worldwide. Together, both procedures constitute nearly 80% of all bariatric operations worldwide [2].
Bariatric surgery is superior to medical treatment for T2DM [3]. However, it is unclear whether RYGB or SG offer the greatest benefit for patients with T2DM. Several randomised controlled trials (RCTs) have compared RYGB with SG. However, body weight loss and body mass index (BMI) was chosen as primary endpoint in six RCTs [4], whereas T2DM was primary endpoint in only one, glycated haemoglobin (HbA1c) in five and fasting blood glucose in three. Consequently, most RCTs did not include enough patients with T2DM and thus were not powered to allow a comparison between RYGB and SG in this group. Therefore, it remains unclear which of the two bariatric procedures is superior for optimal metabolic control in general and for optimal glycaemic control specifically after surgery.
The aim of this systematic review and meta-analysis of RCTs was to compare the metabolic effects of RYGB and SG assessed as serum glucose, and other markers for T2DM and dyslipidaemia in order to identify the procedure associated with best metabolic outcomes.
A systematic review protocol was registered on the international PROSPERO database and can be accessed by the following registration number: CRD42014009837. All units in the meta-analysis were converted to International System of Units (SI units). Glucose values were converted from mmol/l to mg/dl by dividing by 0.555 (mg/dl × 0.555 = mmol/l), high-density lipoprotein, low-density lipoprotein and cholesterol values from mmol/l to mg/dl by dividing by 0.02586 (mg/dl × 0.02586 = mmol/l), and triglyceride values from mmol/l to mg/dl by dividing by 0.0113 (mg/dl × 0.0113 = mmol/l). To convert the standard error of the mean (SEM) into the standard deviation (SD,) the following formula was used: SD = SE√n [5].
A literature search was carried out by a professional librarian, MG in collaboration with DAR. An example of our search strategy is included in appendix 1. Two independent reviewers, TH and CH, [6] screened and extracted the data from the records using a pre-defined electronic protocol available at review-net.com. An official meeting of the investigators resolved discrepancies by specialist group consensus. The same procedure was applied for screening and inclusion/exclusion of articles.
All RCT reports that included data on the primary and secondary endpoints of this systematic review were included. In six RCTs, changes in fasting blood glucose were reported as the primary endpoint. Specific search terms were used for each database: Medline, Pubmed, Cochrane, Embase and SCOPUS. The search took place on the 21 November 2014 and included publications from 1980 onwards. There were no language restrictions. Additional inclusion criteria were: studies comparing RYGB (including biliopancreatic diversion) with SG, and patient age above 18 years. Studies of banding alone, animal studies, case reports, retrospective or prospective nonrandomised cohort and case control studies were excluded.
For studies where data for the same cohort of patients were reported in more than one publication (follow-up publications), only the most recent data were included. The study of Woelnerhanssen et al. 2011 included the same patient cohort as that of Peterli et al. 2012 and Peterli et al. 2013 [7–9]. The study of Lee et al. July 2011 included the same patient cohort as Lee et al. February 2011 and Lee et al. 2014 [4, 10, 11]. The study of Schauer et al. 2014 [12] included the same patient cohort as Schauer et al. 2012 [13], Sangeeta [12] and Kashyap et al. [14]. Follow-up studies with same patient cohorts but different endpoints were included in specific analyses.
The data extracted were the following: author’s last name, publication year, study design, total number of patients, number of patients in the SG group, number of patients in the RYGB group, age (mean, median, SD, SEM, range, or interquartile range [IQR]), male:female ratio, preoperative BMI (weight and height), preoperative fasting blood glucose, preoperative oral antidiabetic therapy, preoperative insulin administration (units per day), type of operation, operation technique, operating time (mean, median, SD, SEM, range, or IQR), blood loss (mean, median, SD, SEM, range, or IQR), rate of conversion to open surgery, reason for conversion to open surgery, complications, type of complications, postoperative leak, mortality, cause of death, postoperative fasting blood glucose levels, postoperative antidiabetic therapy, postoperative insulin administration (units), length of hospital stay (mean, median, SD, range, or IQR), postoperative weight reduction (BMI), and the level of evidence of each study (Cochrane risk-of-bias assessment).
The primary outcome was improvement in differences in fasting blood glucose levels, insulin resistance and HbA1c in diabetic patients. A subgroup analysis of studies that included only patients with known T2DM preoperatively was performed. Secondary outcomes included weight-related and lipid metabolism endpoints (such as BMI, and low-density lipoprotein, high-density lipoprotein, cholesterol and triglyceride concentrations).
A quantitative synthesis was performed if the included studies reported data on the same parameter and at the same time point. A narrative synthesis of the findings from the included studies and summaries of intervention effects for each comparative study by calculating odds ratios (for dichotomous variables) or mean differences (for continuous variables) was created. For the quantitative synthesis, we pooled the results using a fixed-effects meta-analysis, with mean differences (MDs) for continuous variables and odds ratios for binary variables, and calculated 95% confidence intervals (CIs) with the two-sided p-values for each outcome. Heterogeneity between the studies in effect measures were assessed using both the chi-squared test and the I-squared statistic. An I2 value greater than 50% was considered indicative of substantial heterogeneity; however, both fixed- and random-effects models are reported. Funnel plots were used and all studies were tested for asymmetry that may reflect selective publication bias or poor methodology. Statistical analysis was performed using R version 3.3.2 (R Core Team, GNU GPL v2 License), R Studio version 1.0.44 (RStudio, Inc. GNU Affero General Public License v3, Boston, MA, 2016) with the graphical user interface (GUI) rBiostatistics.com alpha version (Cloud Graphical User Interface for R Statistics and eLearning Platform. Zurich, Switzerland, 2016).
The selection process from the initial results of publication searches to the final included studies is illustrated in figure 1. Initially a total of 879 records were identified, of which 554 were non-duplicates. After the inclusion and exclusion criteria had been applied, 523 records were excluded and an additional 21 records were retrieved. Nine records were excluded after full-text screening (duplicates, statements or abstracts with no full-text available) and four records were added through a manual check of reference lists. Finally, 16 RCT records were included in the meta-analysis (table 1). The focus was on diabetic patients, who were included in eight studies [4, 10, 12–14, 20], including one ongoing study in diabetic patients that was not published at the time of our study [16]. The studies including both diabetic and nondiabetic patients were also analysed, including all 16 RCTs available.
Figure 1 PROSPERO flow chart.
Table 1 Summary of the randomised controlled trials included.
| Reference | Year of publication | Journal | Time period of trial | Multi- or single centre | Country | City | Total number of patients |
|---|---|---|---|---|---|---|---|
| Karamanakos et al. [15] | 2008 | Ann Surg | Single | Greece | Patras | 32 | |
| Peterli et al. [16] | 2009 | Ann Surg | Single | Switzerland | Basel | 27 | |
| Kehagias et al. [17] | 2011 | Obes Surg | Jan 2005 to Feb 2007 | Single | Greece | Patras | 60 |
| Lee et al. [10] | 2011 | Surg Obes Relat. | Sept 2007 to Jun 2008 | Single | Taiwan | Taoyuan, Taipei, | 32 |
| Lee et al. [4] | 2011 | Arch Surg | Sept 2007 to Jun 2008 | Single | Taiwan | Taoyuan, Kaohsiung | 60 |
| Woelnerhanssen et al. [7] | 2011 | Surg Obes Relat | Single | Switzerland | Basel | 23 | |
| Paluszkiewicz et al. [18] | 2012 | Videosugery | Nov 2008 to Mar 2009 | Single | Poland | Warsaw | 72 |
| Peterli et al. [8] | 2012 | Obes Surg | Single | Switzerland | Basel | 23 | |
| Ramon et al. [19] | 2012 | J Gastrointest Sur | Apr 2007 to Mar 2008 | Single | Spain | Barcelona | 15 |
| Schauer et al. [12] | 2012 | NEJM | Mar 2007 to Jan 2011 | Single | USA | Cleveland, Boston | 100 |
| Kashyap et al. [14] | 2013 | Diabetes Care | Mar 2007 to | Single | USA | Cleveland, Boston, Los Angeles,San Antonio | 37 |
| Keidar et al. [20] | 2013 | Diabetologia | Jun 2008 to Feb 2010 | Single | Israel | Jerusalem, Petach Tikva | 37 |
| Peterli et al. [9] | 2013 | Ann Surg | Jan 2007 to Nov 2011 | Multi | Switzerland | Basel, Bern, Zürich, St.Gallen | 217 |
| Helmiö et al. [21] | 2014 | Scand J Surg | Apr 2008 to Jun 2010 | Multi | Finland | Turku | 240 |
| Lee et al. [11] | 2014 | Obes Surg | Sept 2007 to Jun 2008 | Single | Taiwan | Taoyouan | 60 |
| Schauer et al. [13] | 2014 | NEJM | Mar 2007 to Jan 2011 | Single | USA | Clevland, Boston | 97 |
The risk-of-bias assessments are described in detail in figures S1a and S1b in appendix 2. Briefly, the assessment of risk of bias was performed by independent reviewers using the updated CBRG criteria [22], including selection, performance, detection, attrition and reporting bias. Disagreements were settled by a third reviewer.
We first focus on trials including mixed overweight and obese patient populations with and without T2DM. The results from the subgroup analysis of trials including only overweight and obese patients with T2DM are then reported.
Age at baseline, (preoperatively) did not differ between the RYGB and SG groups (MD 0.02 years, 95% CI −1.51 to 1.56) with a pooled mean age of 43 years (range 37–50) for the RYGB and 42 years (range 36–48) for the SG group. Seven RCTs included both female and male patients [9, 11, 13, 15, 17, 18, 20], one study [19] included only female and two studies [16, 21] only male patients. Overall, there was no significant difference in the proportion of female patients in the RYGB and SG groups.
Fasting blood glucose was reported at baseline, 12, 24, 36 and 52 months postoperatively (figs 2a to 2e ). Surprisingly, there was a significant difference between the two groups at baseline, with higher fasting blood glucose in the SG group (MD 17.38 mg/dl, 95% CI 12.52 to 22.23; p<0.001; fig. 2a), but with high heterogeneity. However, as illustrated in figure 2b, this difference was lost when the RCT from Schauer et al. [13] was excluded from the analysis (p = 0.738), and this time with zero heterogeneity. Although at 12 months (fig. 2c), there was no significant difference in the fasting blood glucose values between the two groups, at 24 months (fig. 2d) (MD −16.92 mg/dl, 95% CI −21.67 to −12.18; p <0.001) and at 36 months (fig. 2e) (MD −5.97 mg/dl, 95% CI −9.32 to −2.62; p <0.001) there was a significantly better outcome in the RYGB group, with lower fasting blood glucose levels compared with the SG group. The only RCT reporting fasting blood glucose at 52 months (Lee et al. [11]) also showed lower values in the long term in the RYGB group (MD −15.20 mg/dl, 95% CI −27.35 to −3.05; p = 0.010).
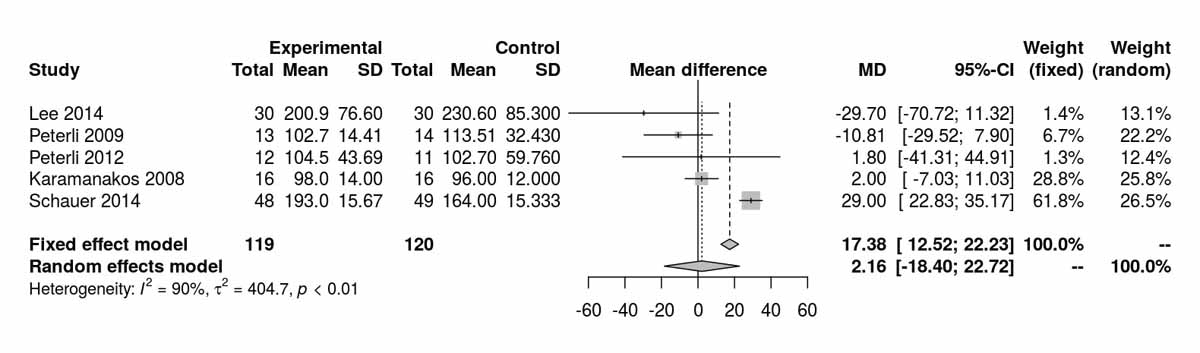
Figure 2a Fasting blood glucose at baseline.
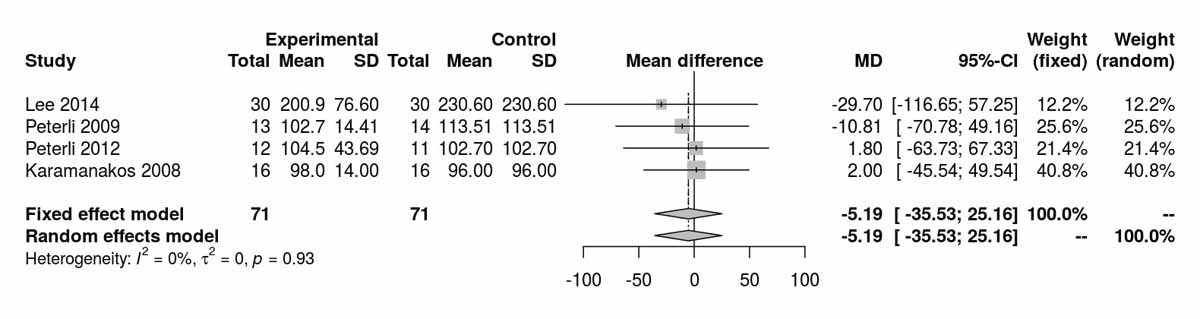
Figure 2b Fasting blood glucose at baseline without Schauer et al. 2014 [13].
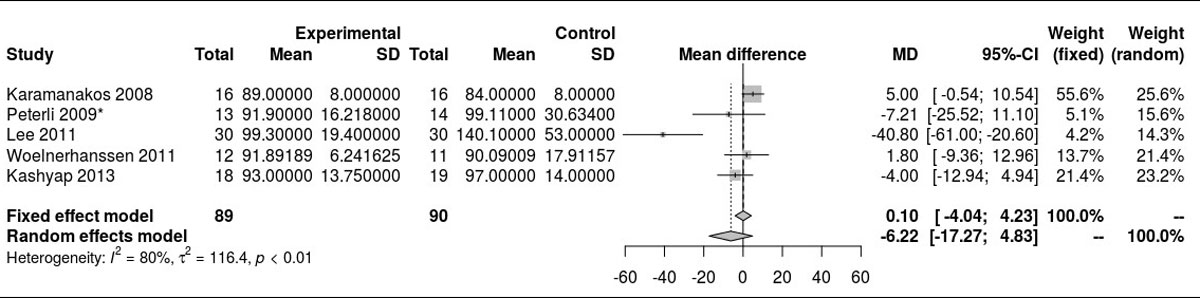
Figure 2c Fasting blood glucose at 12 months.
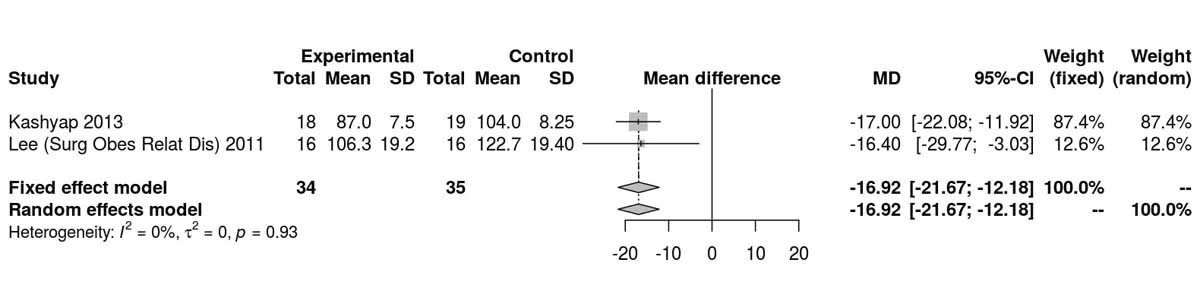
Figure 2d Fasting blood glucose at 24 months.
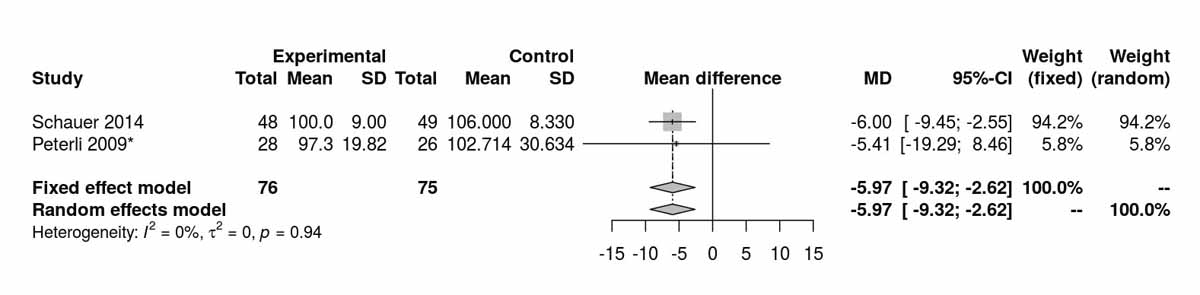
Figure 2e Fasting blood glucose at 36 months.
Fasting insulin at baseline was reported by three RCTs [8, 12, 16] and significantly lower levels were shown in the SG group (MD 4.76 μU/l, 95% CI 4.01 to 5.51; p <0.001; fig. 3a). As with the fasting blood glucose results, the difference was due only to the RCT from Schauer et al. [12] (fig. 3b). However, at 12 months, both SG and RYGB groups had similar values (fig. 3c). The only RCT reporting fasting insulin at 52 months (Lee et al. [11]) also showed no significant difference between the two groups (MD −0.50 μU/l, 95% CI −1.37 to 0.37; p = 0.260).
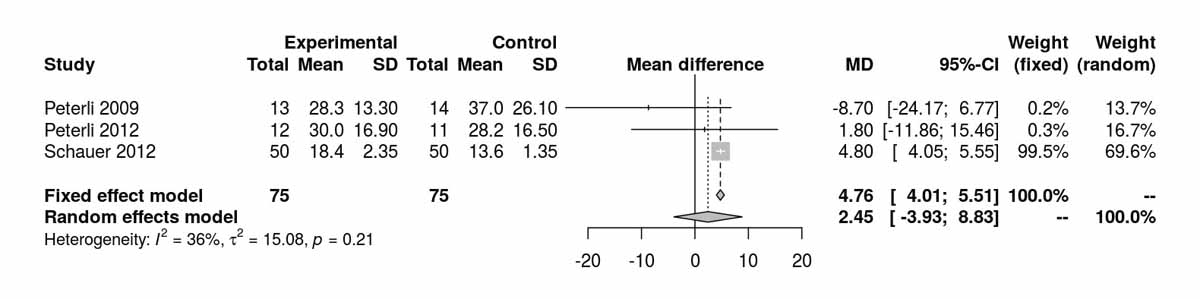
Figure 3a Insulin at baseline.
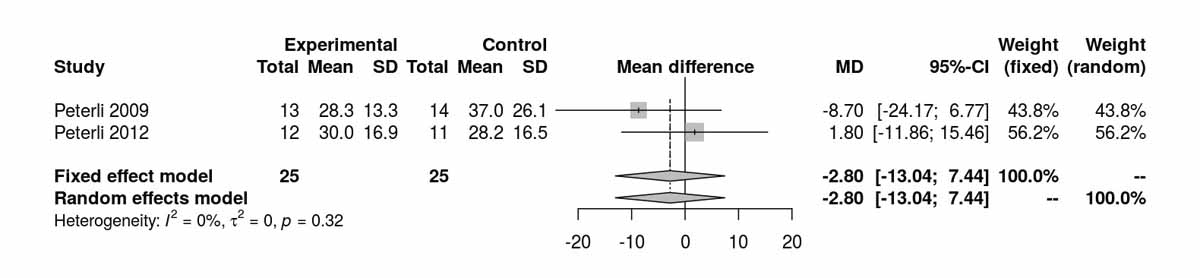
Figure 3b Insulin at baseline without Schauer et al. 2012 [12].
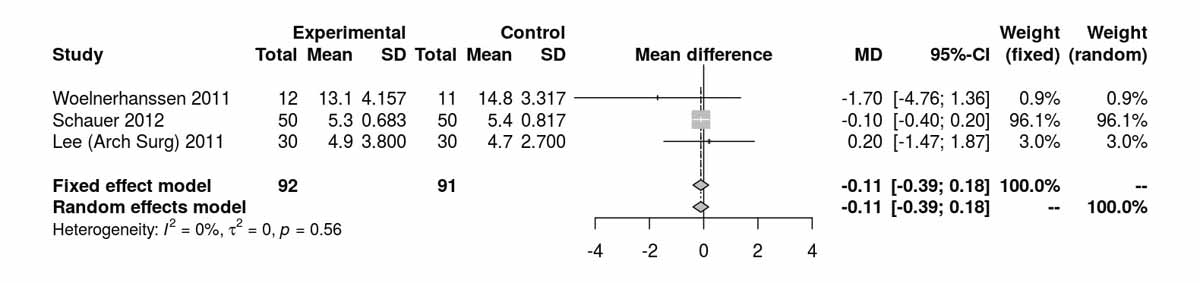
Figure 3c Insulin at 12 months.
HbA1c at baseline (fig. 4a) was similar in both groups. At 12 months, there was a significant difference between the two groups favouring the RYGB group (MD −0.47%, 95% CI −0.73 to −0.20%; p <0.001; fig. 4b). At 36 months, reported by only two RCTs, there was only a trend favouring the RYGB group (p = 0.127; fig. 4c).
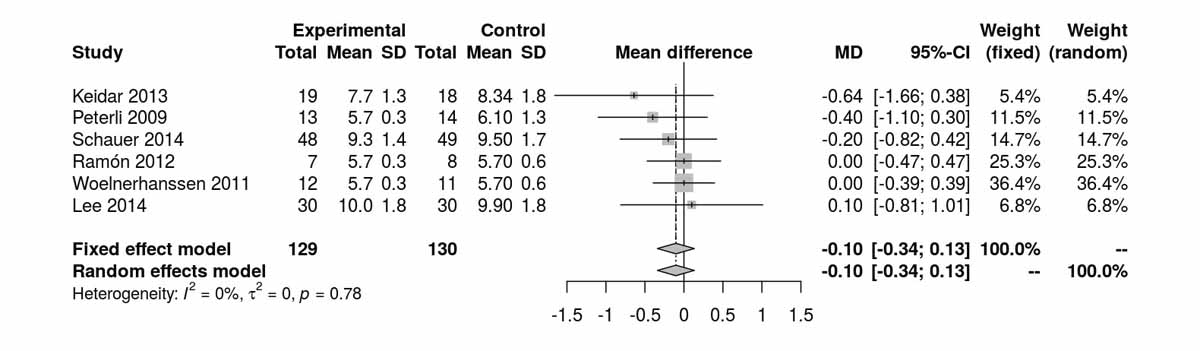
Figure 4a Glycated haemoglobin (HbA1c) at baseline.

Figure 4b Glycated haemoglobin (HbA1c) at 12 months.
Figure 4c Glycated haemoglobin (HbA1c) at 36 months.
The homeostatic model assessment (HOMA) index is a method for assessing β-cell function and insulin resistance from basal fasting blood glucose and insulin concentrations. The HOMA index was reported at baseline, 1 week, and 3, 12, 24 and 52 months postoperatively (figs 5a–5e ). At baseline the results were significantly in favour of the SG group (MD 2.96, 95% CI 2.51to3.41; p <0.001; fig. 5a); however this difference was again lost when the study from Schauer et al. [12] was excluded (fig. 5b). At 3 months postoperatively, favourable results were found for the RYGB group (MD −0.64, 95% CI −0.99 to −0.29; p <0.001; fig. 5c). At 12 months, and including the study from Schauer et al. [12], the results favoured the SG group (MD 0.09, 95% CI 0.01 to 0.17; p = 0.036). However, when the study from Schauer et al. [12] was excluded because of the differences at baseline, the results were opposite, favouring the RYGB group (MD −0.61, 95% CI −1.23 to 0.01; p = 0.054; figs 5d and 5e ). One RCT reported by Lee et al. [4] also showed favourable results for RYGB at 24 months (MD −0.60, 95% CI −1.16 to −0.04; p = 0.040); however this was lost at 52 months (MD −0.20, 95% CI −0.48 to 0.08; p = 0.160) [11].
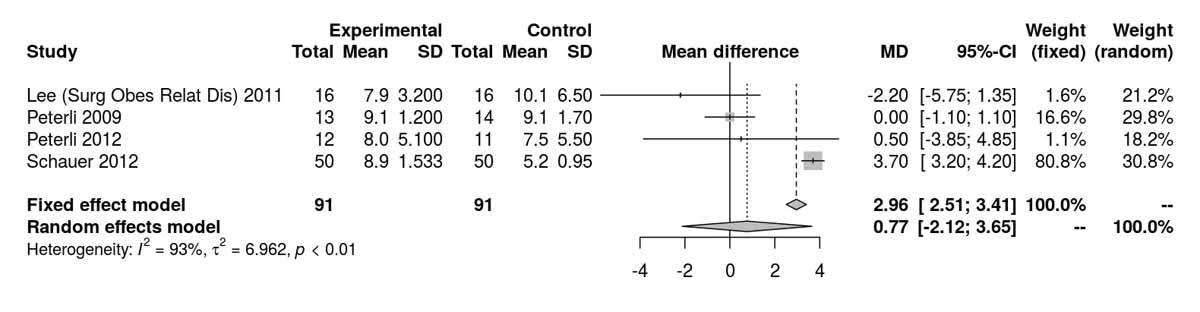
Figure 5a HOMA index at baseline.
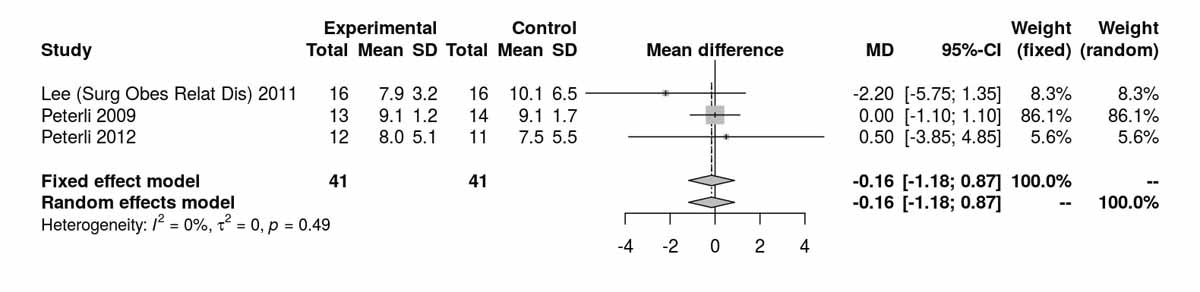
Figure 5b HOMA index at baseline without Schauer et al. 2012 [12].

Figure 5c HOMA index at 3 months.
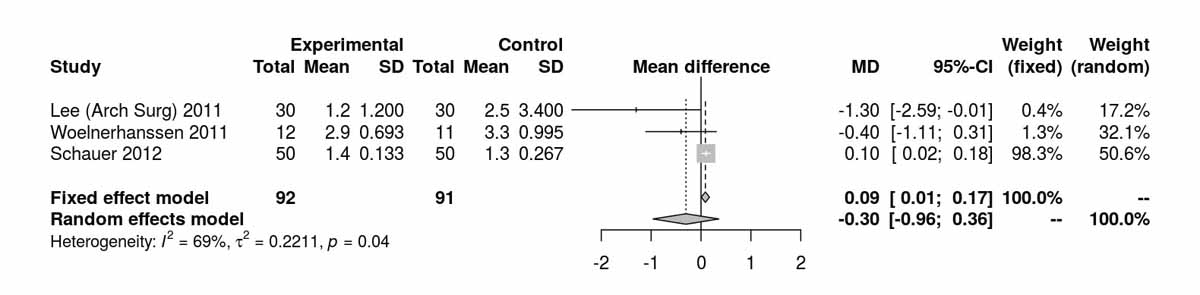
Figure 5d HOMA index at 12 months.
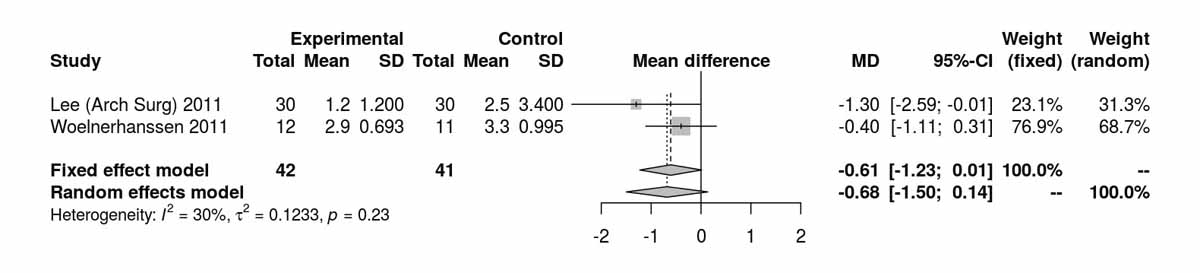
Figure 5e HOMA index at 12 months without Schauer et al. 2012 [12].
Lo-w-density lipoproteins at baseline showed no significant difference between the RYGB and SG groups (fig. S2a in appendix 2). There was a significant difference favouring the RYGB group at 12 months (MD −17.74 mg/dl, 95% CI −25.61 to −9.88; p <0.001; fig. S2b). At 24 months postoperatively, only the RCT from Kashyap et al. [14] showed a significant difference, also favouring the RYGB group (MD −18.60 mg/dl, 95% CI −35.91 to −1.29; p = 0.040). Two RCTs reported results at 36 moths with trends favouring the RYGB group (MD −8.63 mg/dl, 95% CI −19.33 to 2.06; p = 0.113, fig. S2c). The RCT from Lee et al. [11] with long term results showed a significant difference favouring the RYGB group (MD −30.60 mg/dl 95% CI −48.84 to −12.36; p <0.001).
For high-density lipoproteins, there was a significant difference between the two groups disfavouring the SG group at baseline (MD 2.69 mg/dl, 95% CI 0.22to5.17; p = 0.030; fig. S3a). However, at 12 months (p = 0.066) and at 36 months (p = 0.810) there was no significant difference found (figs S3b and S3c ). The only RCT (Lee et al. [11]) reporting data at 60 months postoperatively also showed no significant difference between the two groups (MD −1.10 mg/dl, 95% CI −4.64 to 2.44; p = 0.540).
Cholesterol showed no significant difference between the groups at baseline (fig. S4a). There was a significant difference between the two groups favouring the RYGB group at 12 months (MD −16.29 mg/dl, 95% CI −26.69 to −5.90; p <0.001; fig. S4b). The only RCT reporting cholesterol values at 24 months was that of Kashyap et al. [14], which also showed results favouring the RYGB group (MD −23.20 mg/dl, 95% CI −42.29 to −4.11; p = 0.020). Similarly, the only RCT reporting cholesterol values at 60 months was the one from Lee et al. [11], which also showed results favouring the RYGB group (MD −43.30 mg/dl, 95% CI −61.10 to −25.50; p <0.001).
Triglyceride levels differed significantly between the SG and RYGB groups, favouring SG at baseline (MD 17.46 mg/dl, 95% CI 10.13to24.83; p <0.001; figs S5a and S5b ) purely due to the inclusion of the RCT from Schauer et al. [13]. Despite this, at 12 months there was a significant difference between the two groups favouring the RYGB group (MD −5.60 mg/dl, 95% CI −8.98 to −2.22; p = 0.001; figs S5c and S5d ). The only study reporting triglyceride levels at 52 months postoperatively was that of Lee et al. [11], which showed a significant difference favouring the RYGB group (MD −36.60 mg/dl, 95% CI −48.46 to −24.74; p <0.001).
BMI was reported at baseline and at 3, 6, 12, 24 and 52 months postoperatively (figs 6a–6e ). There was no significant difference between BMI at baseline, at 3 months, at 12 months and at 24 months. However, two RCTs reporting BMI at 6 months postoperatively showed a significant difference in BMI favouring the SG group (MD 1.88 kg/m2, 95% CI 0.38 to 3.38; p = 0.014; fig. 6c). The only study reporting BMI at 52 months (Lee et al. [11]) favoured RYGB (MD −1.80 kg/m2, 95% CI−2.92 to −0.68; p = 0.002). Thus, although BMI did not differ between the groups during short- and mid-term follow up, there was a clear difference favouring the RYGB over the SG group in the long term, with BMI reductions of nearly −2 up to −3 kg/m2.
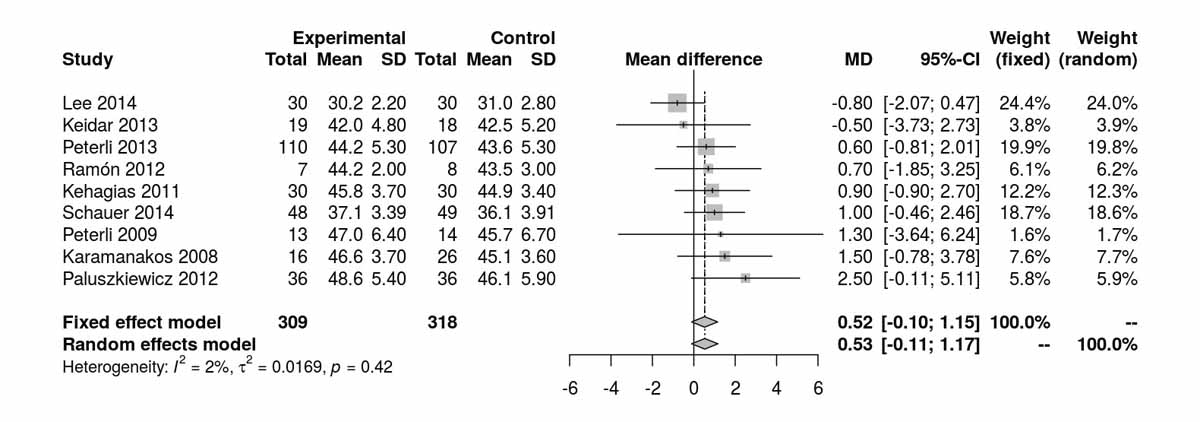
Figure 6a Body mass index (BMI) at baseline.
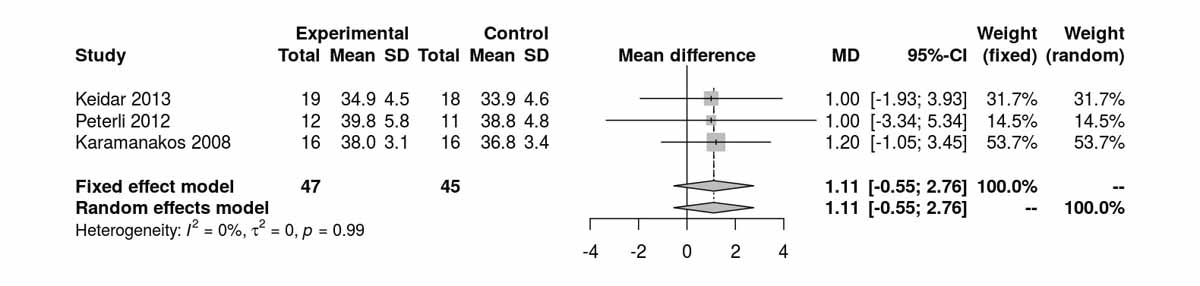
Figure 6b Body mass index (BMI) at 3 months.
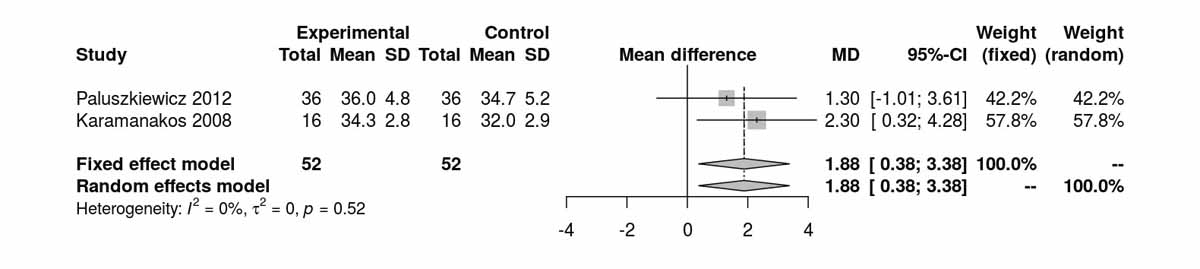
Figure 6c Body mass index (BMI) at 6 months.
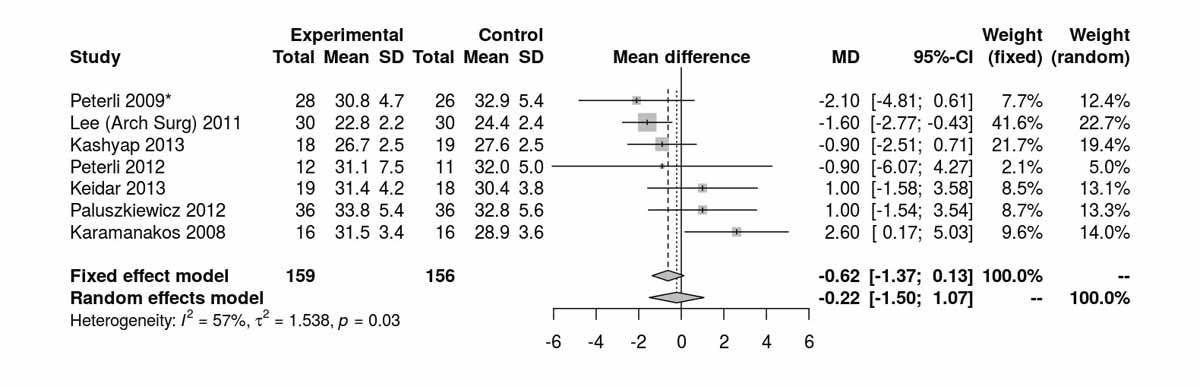
Figure 6d Body mass index (BMI) at 12 months.
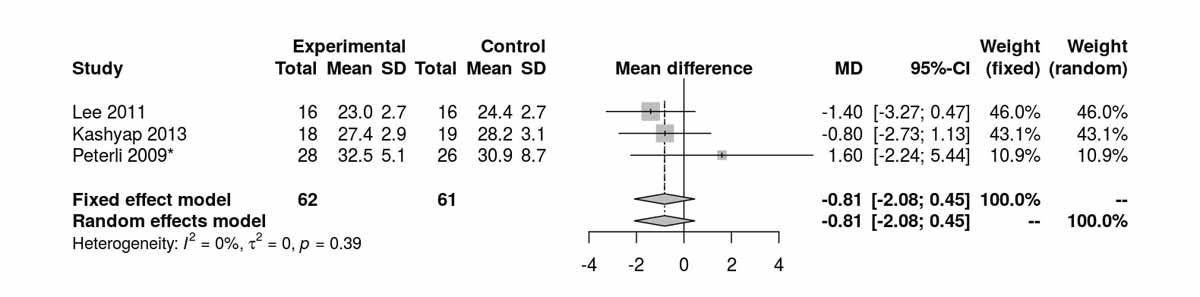
Figure 6e Body mass index (BMI) at 24 months.
Eight RCTs [4, 10–14, 20] investigated only obese patients with diabetes. The separate analyses for these RCTs is described below.
Age was reported by four RCTs including only patients with T2DM. At baseline (preoperatively) there was no significant difference between the SG and RYGB groups (MD −0.11 years, 95% CI −2.32 to 2.10) with a pooled mean age of 48 years (range 39–57) in the RYGB groups and 47 years (range range ) in the SG group. This indicates that patients with T2DM were older than the overall analysis group. The gender distribution between the two groups was also comparable.
Baseline levels for fasting blood glucose were reported in three of the studies including only diabetic patients. There was a significant difference, disfavouring the SG group, with higher fasting blood glucose levels at baseline (MD 26.45 mg/dl, 95% CI 20.46to32.44; p <0.001; fig. S6c in appendix 2). However, after the RCT from Schauer et al. [13] was excluded, this difference was lost (fig. S6d). The fasting blood glucose values at 12 months were reported in three studies including only diabetic patients and were significantly higher in the SG group (MD −9.25 mg/dl, 95% CI −16.21 to −2.30; p = 0.009; fig. 7a). When the random effect instead of the fixed effect model were used because of high heterogeneity, the difference lost statistical significance (MD −15.26 mg/dl, 95% CI −33.37 to 2.86). At 24 months, only two studies reported fasting blood glucose values and there was a significant difference between the two groups, again favouring the RYGB group (MD −16.92 mg/dl; 95% CI −21.67 to −12.18; p <0.001; fig. 7b).Two studies reported fasting blood glucose data at 36 months postoperatively with similar results, favouring the RYGB group (MD −5.97 mg/dl, 95% CI −9.32 to −2.61; p <0.001; fig. 7c). The only study (Lee et al. [11]) reporting values on fasting blood glucose at 52 months in patients with diabetes clearly showed results favouring the RYGB group (MD −15.20 mg/dl, 95% CI −27.35 to −3.05; p = 0.010).
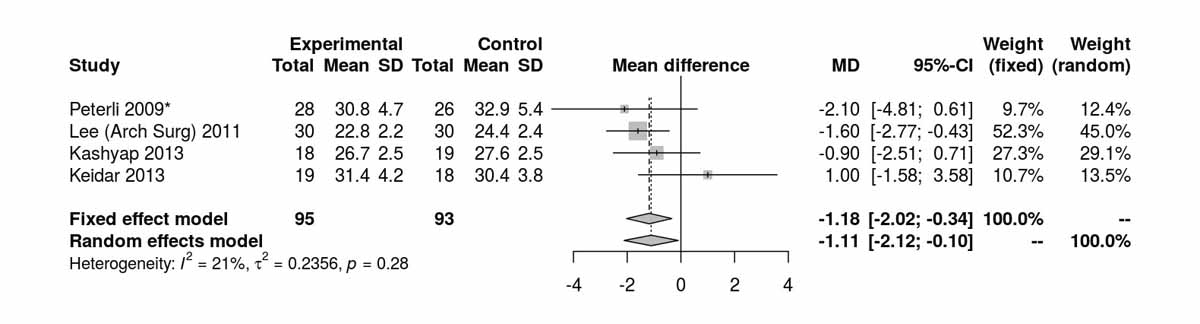
Figure 7a Fasting blood glucose at 12 months diabetic only (analysis of studies including only patients with type 2 diabetes).
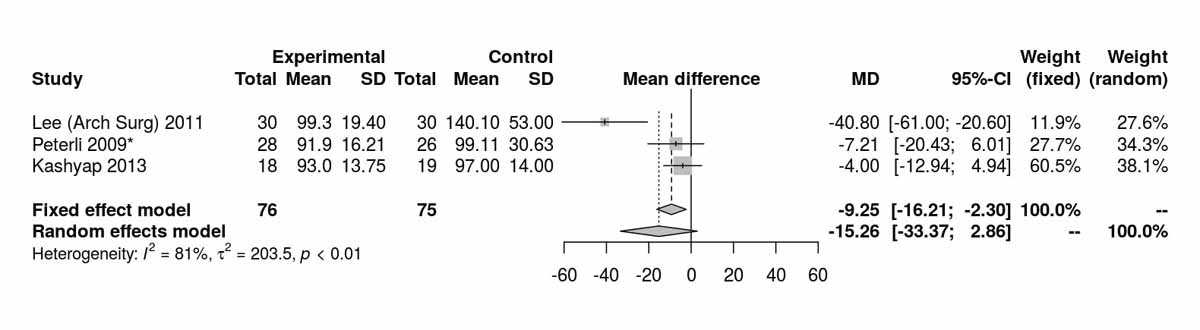
Figure 7b Fasting blood glucose at 24 months (analysis of studies including only patients with type 2 diabetes).
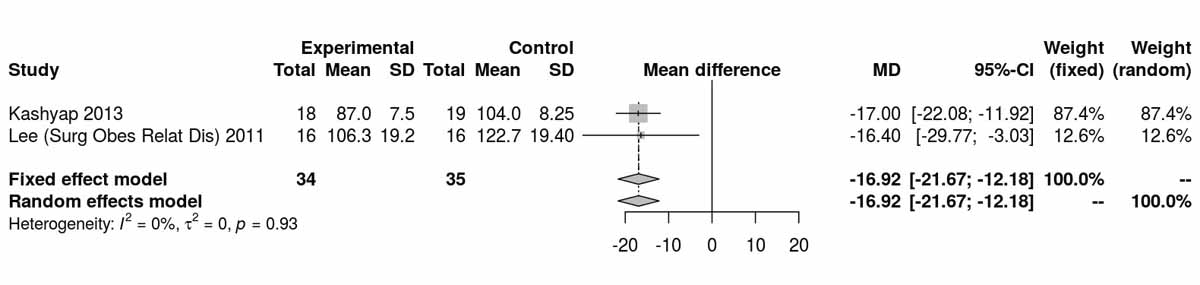
Figure 7c Fasting blood glucose at 36 months (analysis of studies including only patients with type 2 diabetes).
Fasting insulin values at baseline were reported only by Schauer et al. [12] and there were significantly higher levels in the SG group (MD 4.80 µU/ml, 95% CI 4.05to5.55; p <0.001). The only study reporting fasting insulin values 3 months postoperatively was that of Peterli et al. [16], which showed significantly lower levels in the RYGB group (MD −9.31 µU/ml, 95% CI −13.63 to −4.99; p <0.001). At 12 months, fasting insulin levels were no longer different between the RYGB and the SG groups (fig. S6e). The only study reporting results on fasting insulin at 52 months was the one from Lee et al [11], which also showed no significant difference between the two groups (MD −0.50 µU/ml, 95% CI −1.37 to 0.37; p = 0.260).
Baseline data on HbA1c were reported by four studies. There was no significant difference between the two groups (fig. S6f), although with high heterogeneity (I2 = 88%). Excluding the data of Peterli et al. 2009 [16] had no effect on the mean difference (−0.21 µU/ml, 95% CI −0.67 to 0.24) but without heterogeneity (I2 = 0%). We suspect a data reporting error (HbA1c at baseline for the SG group). HbA1c values at 12 months were reported by four studies and there was a significant difference in favour of the RYGB group. (MD −0.46 µU/ml, 95% CI −0.73 to −0.20; p <0.001; fig. 7d). Only one RCT (Lee et al. [10] with available data for mean and SD) reported HbA1c values at 24 months, and that showed a clear difference favouring the RYGB group (MD −1.50 µU/ml, 95% CI −2.14 to −0.86; p <0.001). At 36 months, another study from Lee et al. [11] showed no significant difference between the two groups (MD −0.30 µU/ml, 95% CI −0.82 to 0.22; p = 0.260). However, the same RCT [11] showed clearly significant differences favouring the RYGB group at 52 months of follow up (MD −1.00 µU/ml, 95% CI −1.50 to −0.50; p <0.001).
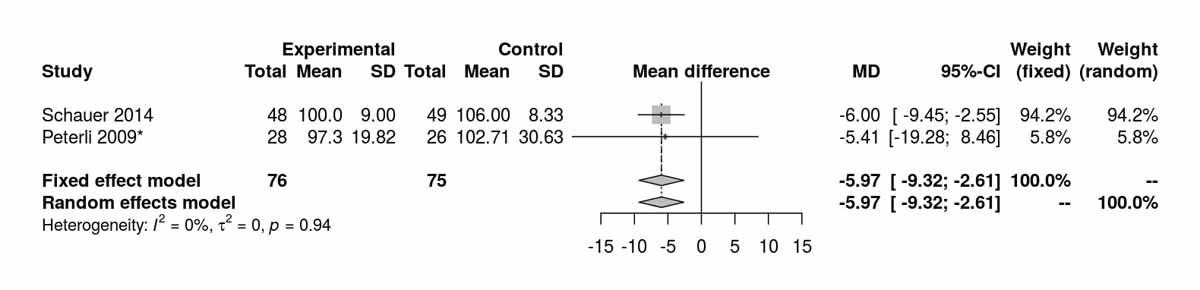
Figure 7d Glycated haemoglobin (HbA1c) at 12 months (analysis of studies including only patients with type 2 diabetes).
Baseline data on the HOMA index were reported by two studies and there was a significant difference between the two groups favouring the SG group due to the data of Schauer et al. [12] (fig. S6g). The two studies reporting the HOMA index at 12 months favoured the SG group (MD 0.09, 95% CI 0.01to0.18; p = 0.030) and this was again clearly due to the inclusion of the Schauer et al. data [12] (fig. S6h), as by excluding it from the analysis, the results were completely opposite, favouring the RYGB group [4] (MD −1.30 (−2.59 to −0.01; p = 0.050).
Three studies reported data on low-density lipoproteins at baseline and showed consistent differences between the two groups (MD −10.41 mg/dl, 95% CI −20.77 to −0.06; p = 0.050; fig. S6i in appendix 2) without any heterogeneity, and favouring the RYGB group. Data available on low-density lipoproteins at 12 months from two studies showed significant differences also favouring this group (MD −23.85 mg/dl, 95% CI −33.23 to −14.48; p <0.001; fig. S6j). Two studies reported low-density lipoproteins at 36 months, with no significant difference between the two groups (fig. S6k). The only study reporting long-term results on low-density lipoproteins, at 60 months postoperatively, was that of Lee et al. [11], which clearly favoured the RYGB group (MD −30.60 mg/dl, 95% CI −48.84 to −12.36; p = 0.001).
Three studies reported levels of high-density lipoprotein at baseline and there were no significant differences between the two groups (fig. S6l). Two studies reported high-density lipoprotein at 12 months and there was a significant difference favouring the SG group (MD 3.56 mg/dl, 95% CI 0.22 to 6.90; p = 0.039; fig. S6m) with low heterogeneity (I2 = 21%). Excluding Lee et al. [11] from the analysis shifted the mean difference to 0.55 mg/dl (95% CI −3.33 to 4.43 I2 = 0%). High-density lipoprotein data at 36 months were available from two studies and there was no longer a significant difference between the two groups (fig. S6n). Similarly, the only RCT (Lee et al. [11]) reporting long-term results at 60 months postoperatively showed no significant results between the two groups (MD −1.10 mg/dl, 95% CI −4.64 to 2.44; p = 0.540).
Two studies reported cholesterol at baseline and there was no significant difference between the two groups. Two studies reported data on cholesterol levels at 12 months and there was a significant difference between the two groups favouring the RYGB group (MD −21.56 mg/dl. 95% CI −33.98 to −9.14; p <0.001; fig. S6o). One study, from Kashyap et al. [14] and reporting data at 36 months postoperatively, showed significant results favouring the RYGB group (MD −23.20 mg/dl, 95% CI −42.29 to −4.11; p = 0.020). Similarly, the only study (Lee et al. [11]) reporting long term results on cholesterol, at 60 months postoperatively, showed a significant difference favouring the RYGB group (MD −43.30 mg/dl, 95% CI −61.10 to −25.50; p <0.001).
Two studies reported triglyceride levels at baseline, showing a significant difference favouring the SG group (MD 18.09 mg/dl, 95% CI 10.57to25.61; p <0.001; fig. S6p), again due to the inclusion of the data from Schauer et al. [13]. Despite the initial differences, the results at 12 months were completely opposite, favouring the RYGB group (MD −6.43 mg/dl, 95% CI −9.89 to −2.96; p <0.001; fig. S6q). The only RCT reporting long-term results at 52 months postoperatively was that of Lee et al. [11], which showed a clear difference in favour of the RYGB group (MD −36.60 mg/dl, 95% CI −48.46 to −24.74; p <0.001).
BMI at baseline was reported in four studies including only patients with T2DM (fig. S6a in appendix 2). There was no significant difference between the two groups at baseline. Four studies reported BMI after 12 months (fig. 7e) and there was a significant difference favouring RYGB group (MD −1.18 kg/m2, 95% CI −2.02 to −0.34; p = 0.006). At 24 months there were three studies reporting the BMI (fig. S6b) with only a trend favouring the RYGB group. The only RCT in diabetic patients reporting BMI at 52 months was that of Lee et al. [11], which clearly favoured the RYGB group (MD −1.80 kg/m2, 95% CI −2.92 to −0.68; p = 0.002).
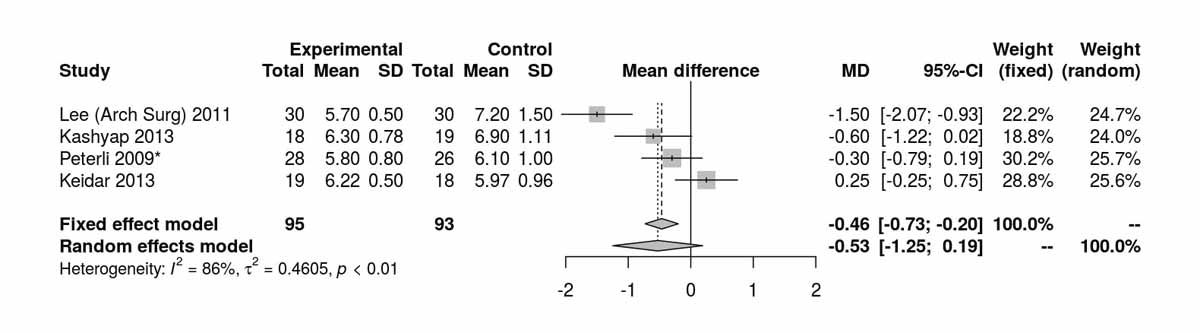
Figure 7e Body mass index (BMI) at 12 months (analysis of studies including only patients with type 2 diabetes).
The most commonly performed procedures for bariatric surgery are laparoscopic sleeve gastrectomy (SG) and roux-en-Y gastric bypass (RYGB). SG nowadays represents the most commonly performed bariatric operation worldwide, and both procedures together account for nearly 80% of all bariatric operations performed worldwide [2]. Despite a vast amount of literature, there are only three meta-analyses [23–25] comparing outcome parameters, including glycaemic control, T2DM, triglycerides and cholesterol, for these two procedures. However, all three studies included not only randomised controlled trials (RCTs), but also prospective and retrospective cohort studies. In this meta-analysis we included and analysed only RCTs, and report data derived from 16 RCTs comparing effects of RYGB with SG on metabolic outcomes such as fasting blood glucose, HbA1c levels, insulin resistance measured with the HOMA index, and low- and high-density lipoprotein, triglyceride and cholesterol levels.
Two analyses were performed, one including overweight and obese patients with or without T2DM, and a second including only patients with T2DM. For weight loss adjusted by the BMI, the latter analysis revealed a superiority of RYGB over SG at 12, 24 and 52 months for patients with T2DM. At 6 months, analysis revealed a superiority of RYGB over SG for weight loss in patients with and without T2DM. The former analysis further showed a similar BMI at 3 months for both groups. Interestingly, there was a lower BMI in the SG group 6 six months postoperatively, whereas patients in the RYGB group were found to have a lower BMI at 12 months, but the differences were not significant. As only one RCT reported BMI data at 52 months after surgery, a meta-analysis to compare long-term BMI changes could not be performed. However, a recent meta-analysis focusing on long-term weight loss revealed no difference between RYGB and SG [23].
In accordance with previous meta-analyses, RYGB was found to be superior in terms of fasting blood glucose at 24, 36 and 52 months postoperatively [23]. These results were obtained in both analyses. Only at 12 months was there no difference when patients with and without T2DM were analysed together. However, for diabetic patients only, RYGB was found to be superior in terms of fasting blood glucose at 12 months. Further, favourable HBA1c levels at 12 months were found in the RYGB group, and there was no difference in baseline HbA1c in both analyses, which is also concordant with previous reports [24]. However, there was no difference in HbA1c levels between the two groups 36 months postoperatively with only trends favouring the RYGB group.
Interestingly, there were significant differences in the baseline data for the HOMA index, fasting blood glucose, fasting insulin and triglycerides, which favoured the SG group; this difference was eliminated when one RCT was excluded from the analysis. This study evaluated the efficacy of intensive medical therapy alone versus medical therapy plus RYGB or SG and was not powered to detect differences between the two surgical procedures [12]. Given the randomised study design, it remains surprising that the HOMA index differed at baseline between the two groups in this study. This particular RCT did not report data on the HOMA index at early postoperative time points. However, in our analysis it was found that there was no difference in the HOMA index at 1 week postoperatively, whereas the RYGB group showed a significantly better HOMA index at 3 months postoperatively. In contrast, the SG group showed favourable HOMA indices at 12 months after the surgery when compared with the RYGB group in both types of analysis.
The present meta-analysis failed to detect a clear superiority of one procedure over the other in terms of the HOMA index, but other authors also did not find differences between RYGB and SG in the correction of insulin resistance [26]. In contrast, a recently published meta-analysis reported a significantly lower HOMA index after RYGB when compared with SG, but the analysis was based on the studies of Woelnerhanssen et al. 2011 [7] and Lee et al. 2011 [10], without including the study of Schauer et al. [12].
The effects of RYGB and SG on dyslipidaemia were also analysed. Here, a significant superiority of RYGB, with lower low-density lipoprotein levels 12 months after surgery, was found in both types of analysis. Differences were absent at 36 months after the surgery, which is in accordance with previous reports [27].
In contrast, baseline high-density lipoprotein levels significantly differed between the two groups, with higher levels in the SG group. Such baseline differences may indicate of problems in the randomisation process in the included studies. Alternatively, they may suggest presence of patient selection bias, as patients with a higher cardiovascular and thus surgical risk may be more likely to receive a SG, which many consider as a less invasive and potentially safer operation than RYGB. Differences between the groups were still detected at 12 months postoperatively, both groups showed similar high-density lipoprotein levels at 36 months after surgery. This was true both for both types of analysis.
In contrast to the high-density lipoprotein levels, cholesterol levels at baseline were similar between the two groups. Further, there was a significant trend towards superiority of the RYGB group at 12 months postoperatively if patients with and without T2DM were included in the analysis. If RCTs that only included patients with T2DM were analysed, the differences became significant, indicating superiority of the RYGB group.
Although there was a significant difference in triglyceride levels at baseline between the two groups, the analysis revealed a superiority of the RYGB group at 12 months after surgery when compared with the SG group in both types of analysis.
In summary, the data obtained from this meta-analysis indicate a superiority of RYGB over SG in short-, mid- and, in some instances, long-term metabolic outcome. However, most of the early differences were not analysed in the long term. Only BMI was reported at 52 months [11]. The underlying physiological mechanisms that could potentially explain the observed differences in metabolic efficacy of the two procedures remain unclear and are the object of intensive research efforts worldwide. They may be related to early, weight-loss independent differences in gastrointestinal hormone levels, gut microbiota or bile acid metabolism [28] [29]. In the longer term, however, the most important mechanism might be weight loss, which was favoured by RYGB.
Every meta-analysis heavily relies on the quality of the included studies. Here, one important limitation is the shortness follow-up in the included studies, with only a few [11, 13, 16] reporting 36-, 52- and 60-month follow-up data, which questions the durability of the observed differences. Further, differences in baseline data for key metabolic parameters might be indicative of a problematic randomisation process in some, but not all RCTs included in this meta-analysis, and not for all parameters. Unfortunately not all studies reported baseline-data and therefore we were unable to investigate this problem by calculating differences between baseline and follow-up in each arm. Moreover and unfortunately for general practitioners, we are unable to present absolute values because results in the included studies were not paired and no paired t-test statistics for mean differences were reported. Blinding of participants and personnel as well as blinding of outcome assessment were the major areas for risk of bias of the included RCTs. Overall, in our bias assessment the risk level in most areas remained unclear. Moreover, it remains unclear whether the observed superiority of RYGB over SG in improving glucose homeostasis translates into a reduced incidence of end-organ complications such as diabetic retinopathy, nephropathy and neuropathy. Similarly, our meta-analysis does not answer the question of whether the advantages of the RYGB in ameliorating dyslipidaemia translates into a mortality benefit over SG. Further clarification will require larger trials with longer follow-up.
This systematic review suggests that RYGB is more effective in short-, mid- to long-term metabolic outcome when compared with SG. Changes in body weight, lipid levels, and glucose homeostasis after RYGB were superior to those reported after SG. The superiority of RYGB over SG on hard clinical end-points, such as myocardial infarction, stroke, renal failure, blindness and death, as suggested in nonrandomised trials, can only be adequately assessed through larger, multicentre trials addressing these specific questions. Of note, data must be interpreted with caution as the follow-up period of most included RCT may be too short to justify long term conclusions. However, based on the currently available reported data, and contrary to the global trend, the authors prefer RYGB, unless contraindicated, over SG to treat patients with obesity and T2DM and/or dyslipidaemia.
This appendix is available as a separate file for downloading at https://smw.ch/en/article/doi/smw.2018.14633/.
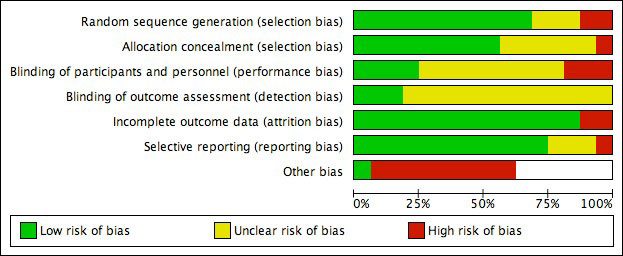
Figure S1a Bias assessment I.
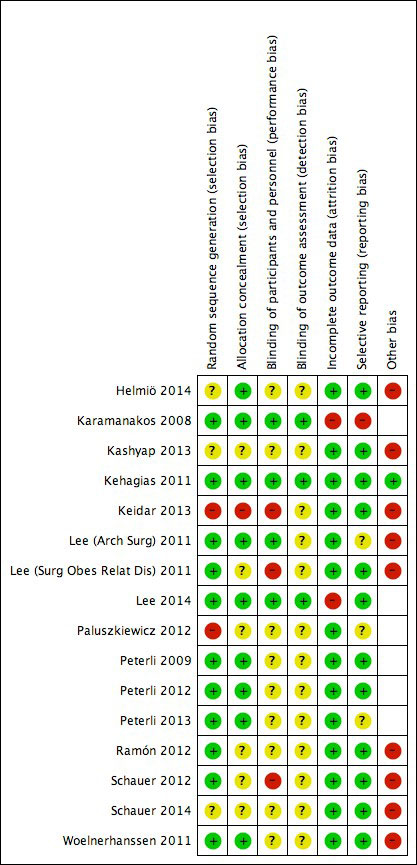
Figure S1b Bias assessment II.
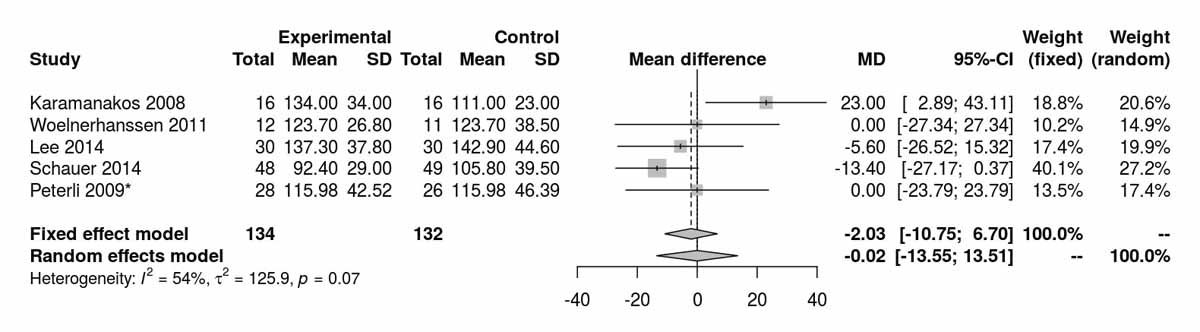
Figure S2a Low-density lipoprotein at baseline.
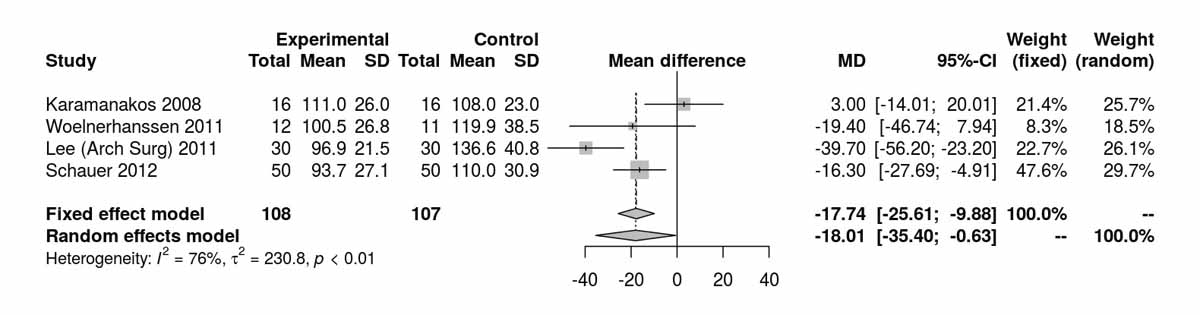
Figure S2b Low-density lipoprotein at 12 months.
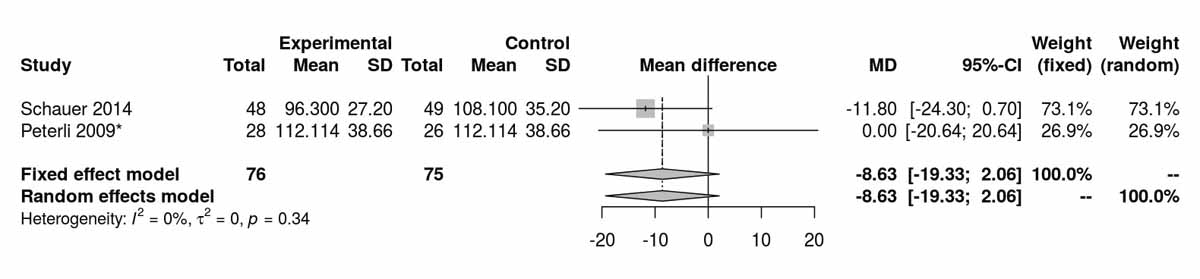
Figure S2c Low-density lipoprotein at 36 months.
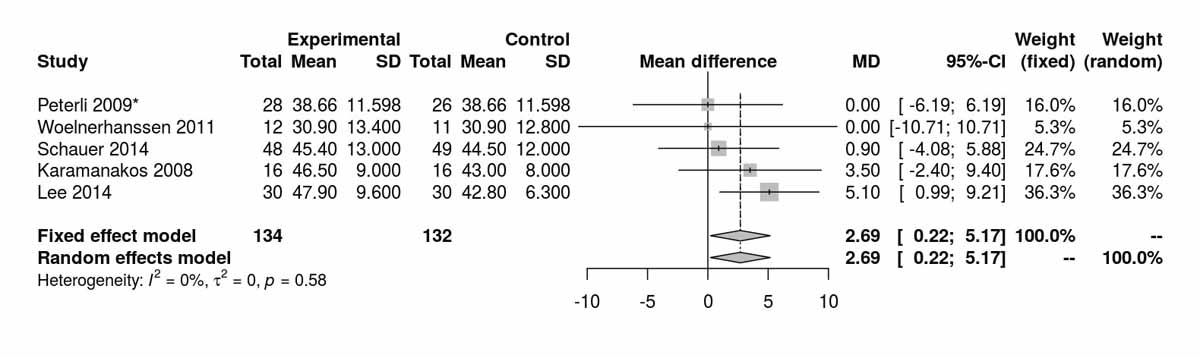
Figure S3a High-density lipoprotein at baseline.
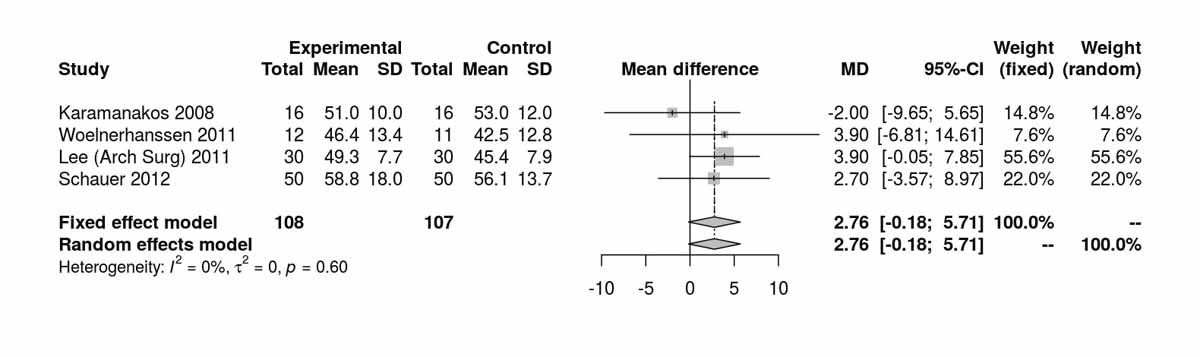
Figure S3b High-density lipoprotein at 12 months.
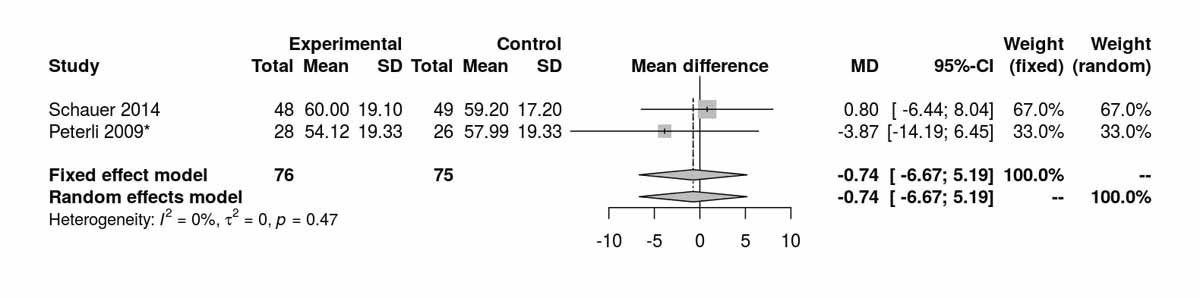
Figure S3c High-density lipoprotein at 36 months.
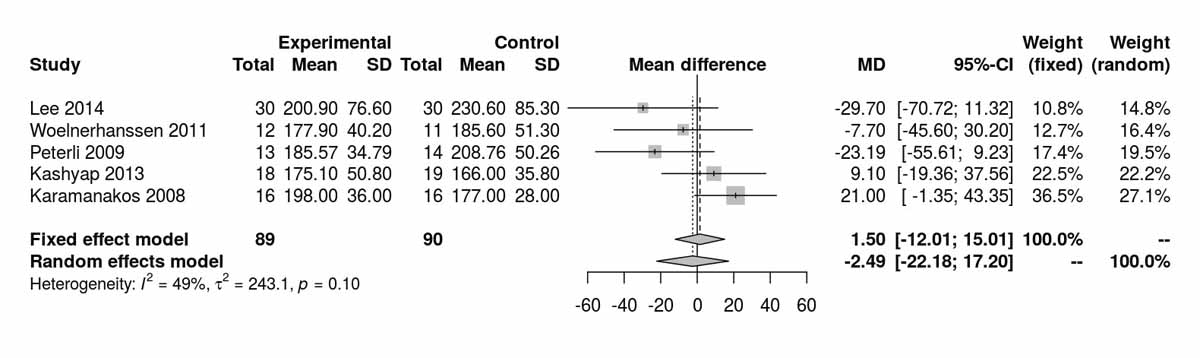
Figure S4a Cholesterol at baseline.
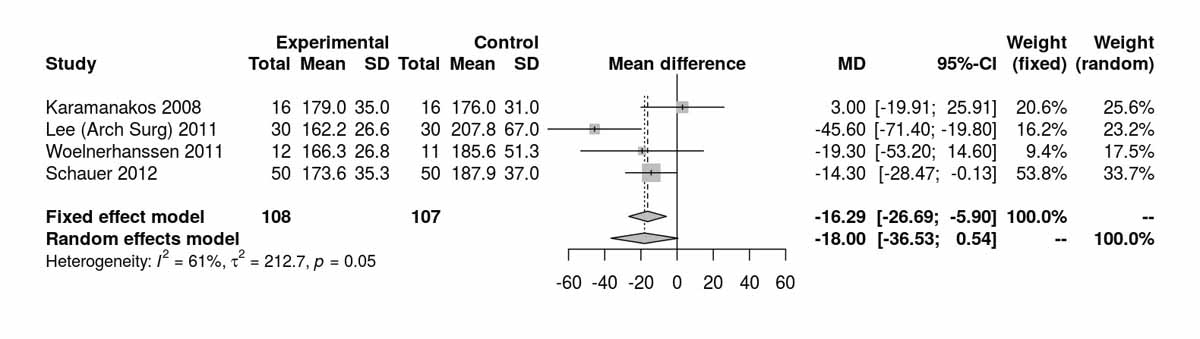
Figure S4b Cholesterol at 12 months.
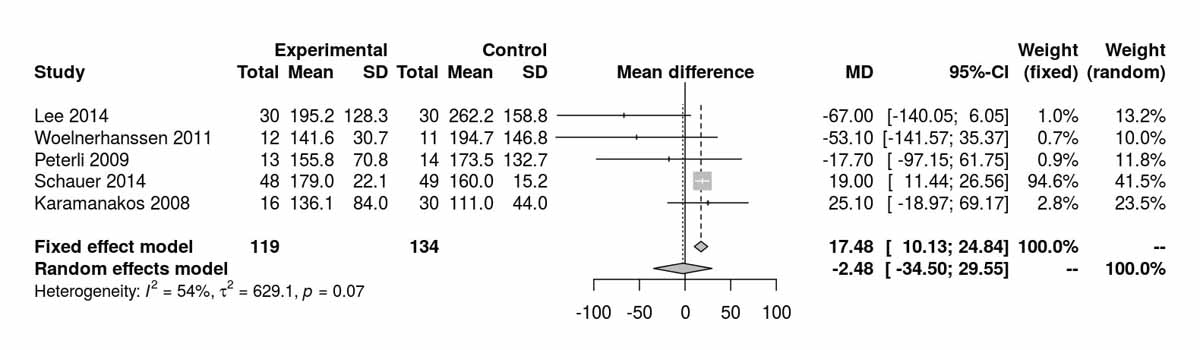
Figure S5a Triglycerides at baseline.
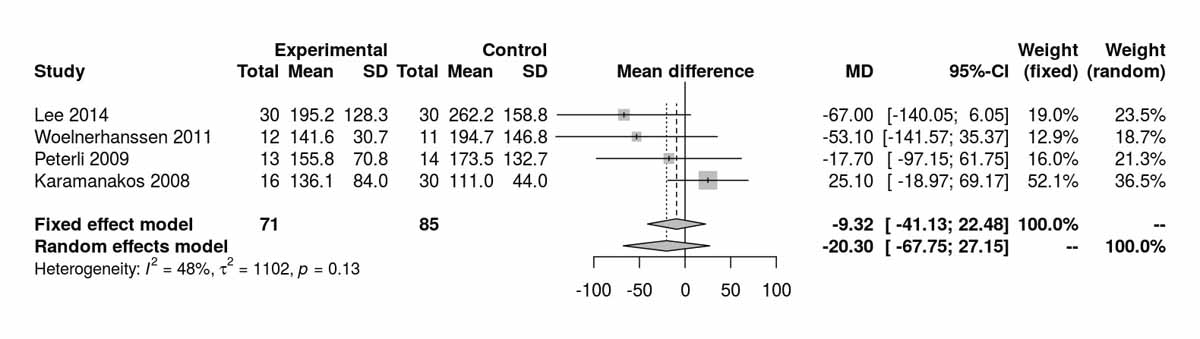
Figure S5b Triglycerides at baseline without Schauer et al. 2014 [13].
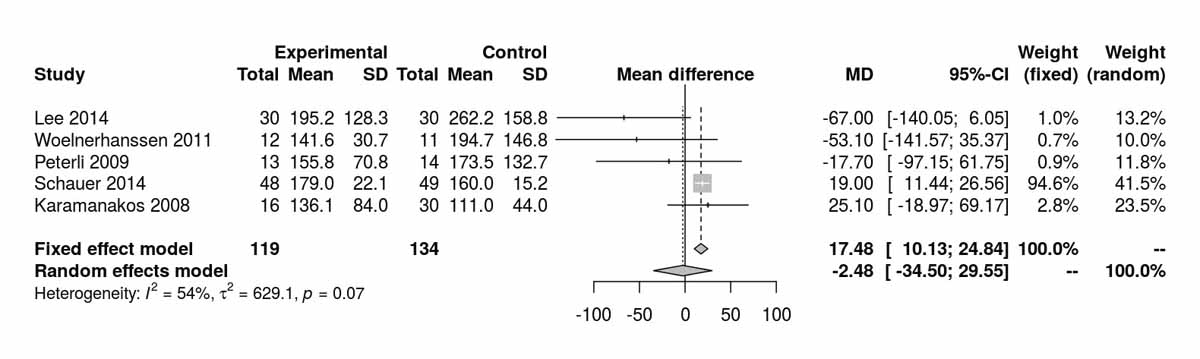
Figure S5c Triglycerides at 12 months.
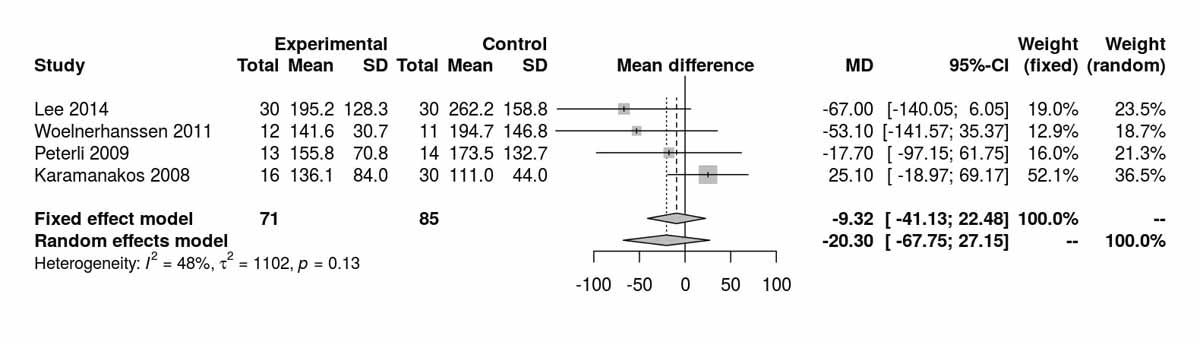
Figure S5d Triglycerides at 12 months without Schauer et al. 2014 [13].
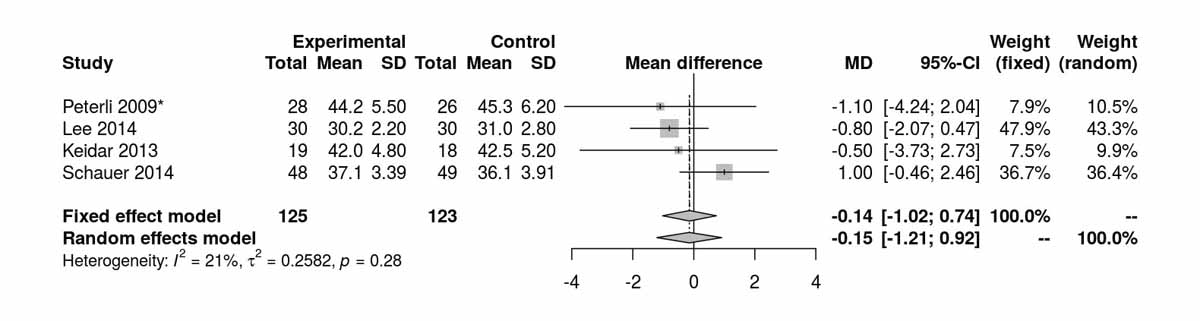
Figure S6a Body mass index (BMI) at baseline (analysis of studies including only patients with type 2 diabetes).
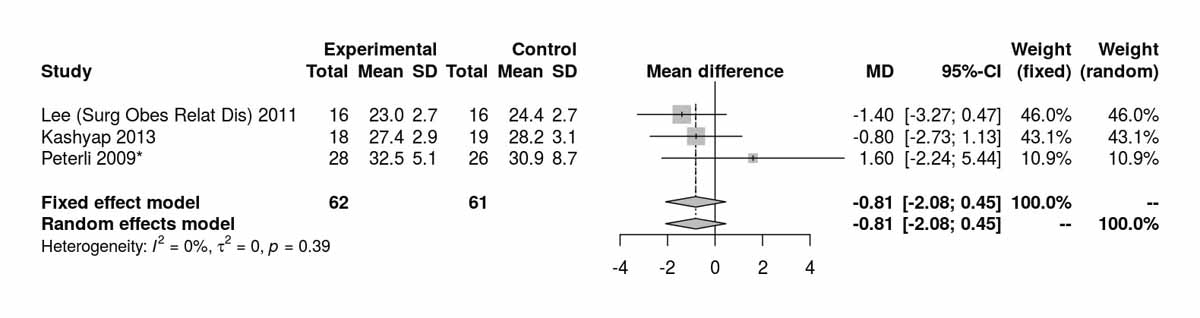
Figure S6b Body mass index (BMI) at 24 months (analysis of studies including only patients with type 2 diabetes).
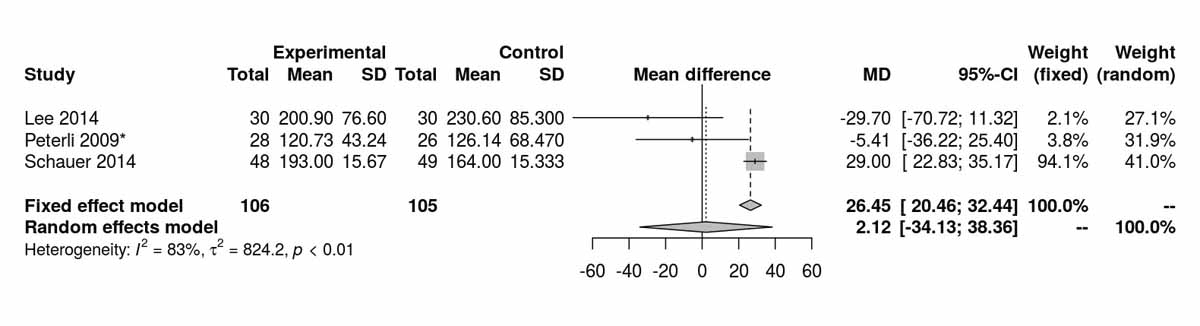
Figure S6c Fasting blood glucose at baseline (analysis of studies including only patients with type 2 diabetes).
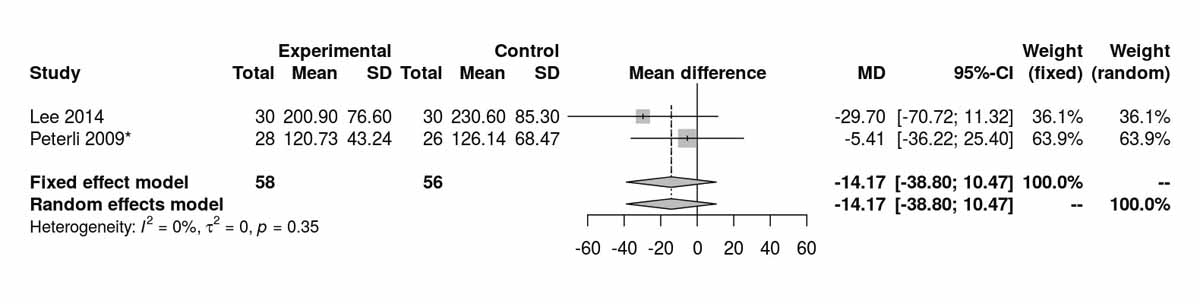
Figure S6d Fasting blood glucose at baseline without Schauer et al. 2014 [13] (analysis of studies including only patients with type 2 diabetes).
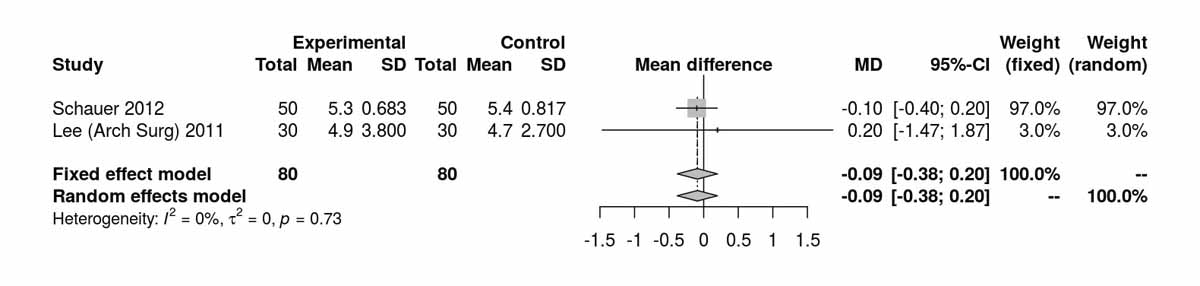
Figure S6e Insulin at 12 months (analysis of studies including only patients with type 2 diabetes).
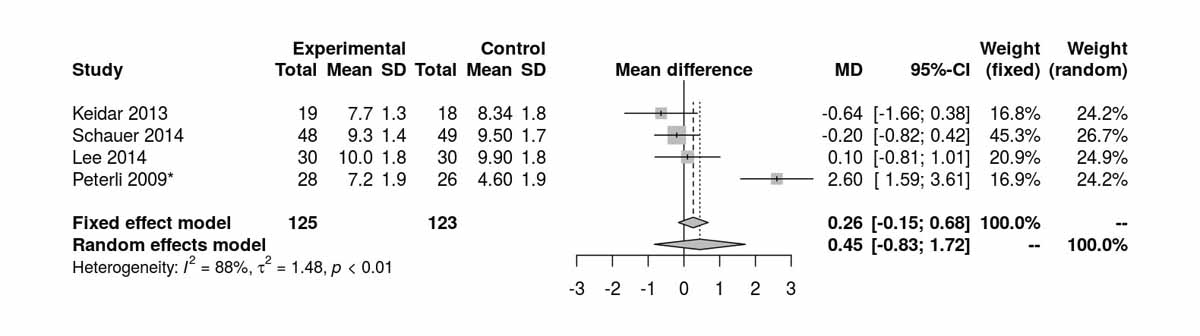
Figure S6f Glycated haemoglobin (HbA1c) at baseline (analysis of studies including only patients with type 2 diabetes).
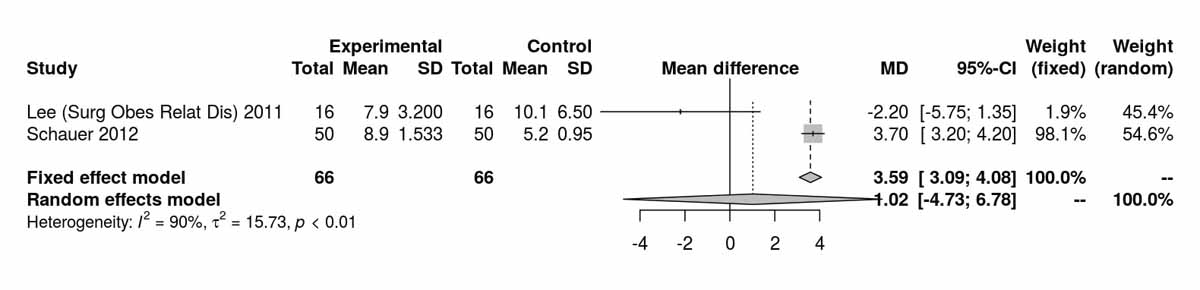
Figure S6g HOMA index at baseline (analysis of studies including only patients with type 2 diabetes).
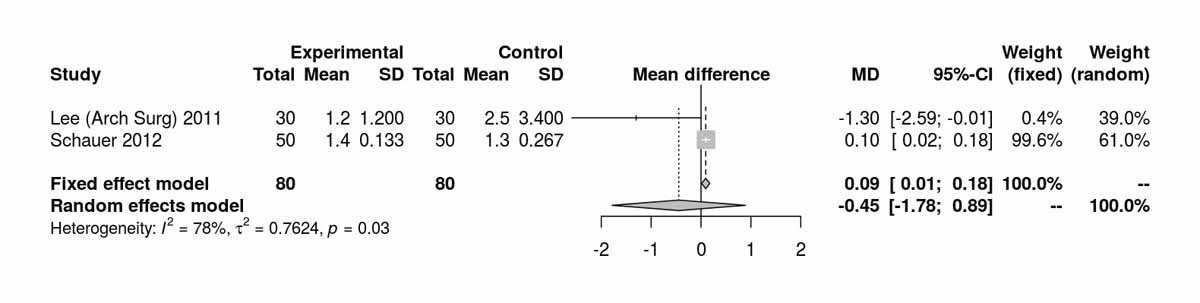
Figure S6h HOMA index at 12 months (analysis of studies including only patients with type 2 diabetes).
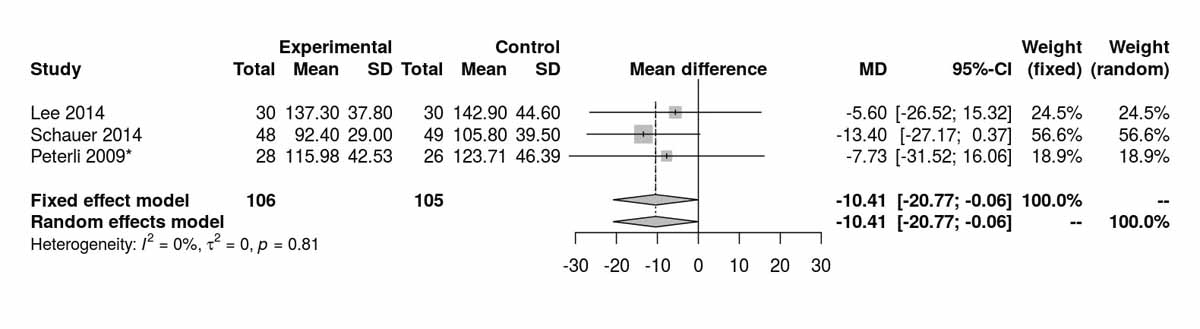
Figure S6i Low-density lipoprotein at baseline (analysis of studies including only patients with type 2 diabetes).
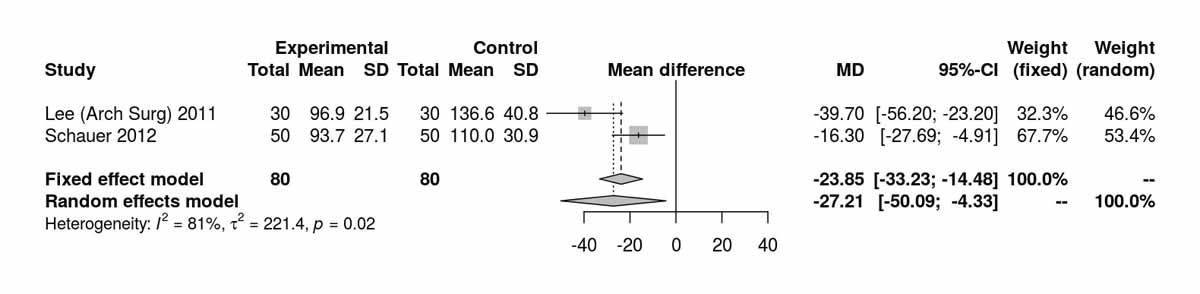
Figure S6j Low-density lipoprotein at 12 months (analysis of studies including only patients with type 2 diabetes).
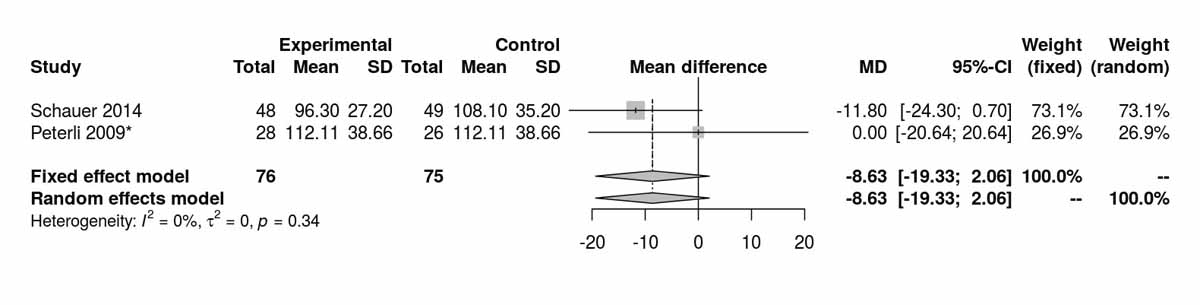
Figure S6k Low-density lipoprotein at 36 months (analysis of studies including only patients with type 2 diabetes).
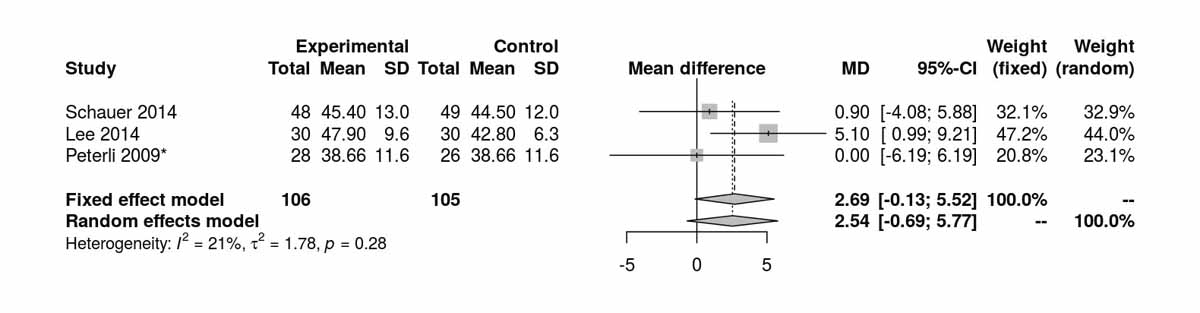
Figure S6l High-density lipoprotein at baseline (analysis of studies including only patients with type 2 diabetes).
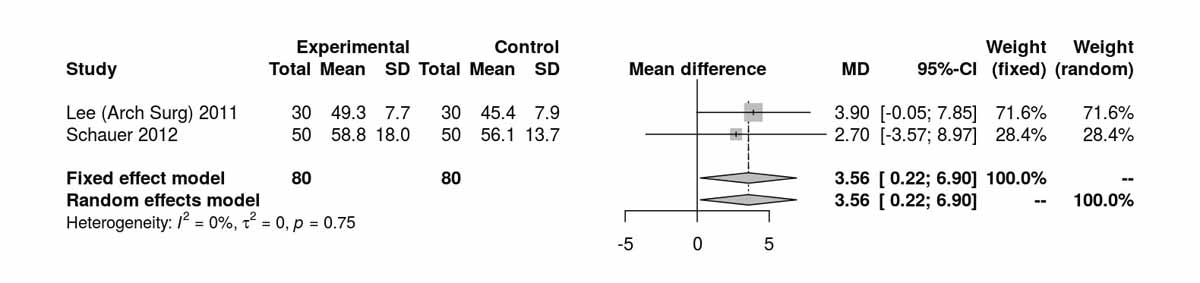
Figure S6m High-density lipoprotein at 12 months (analysis of studies including only patients with type 2 diabetes).
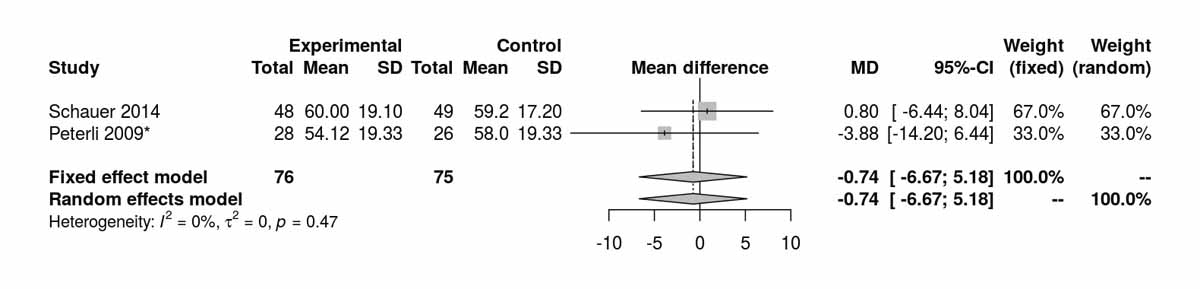
Figure S6n High-density lipoprotein at 36 months (analysis of studies including only patients with type 2 diabetes).
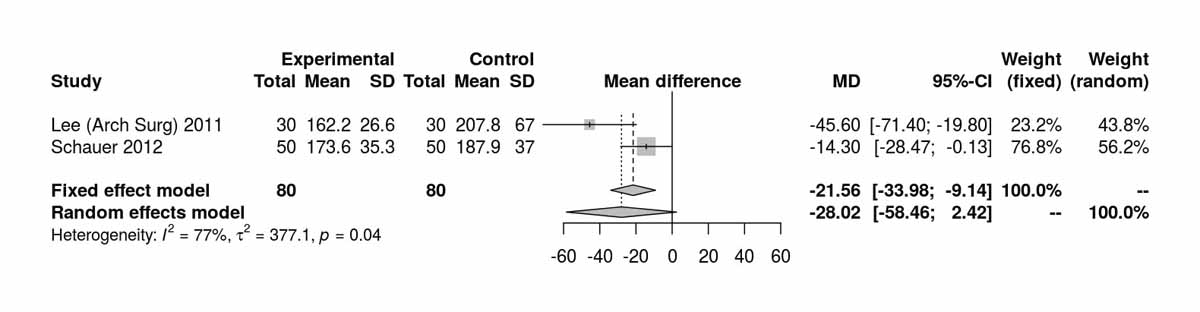
Figure S6o Cholesterol at 12 months (analysis of studies including only patients with type 2 diabetes).
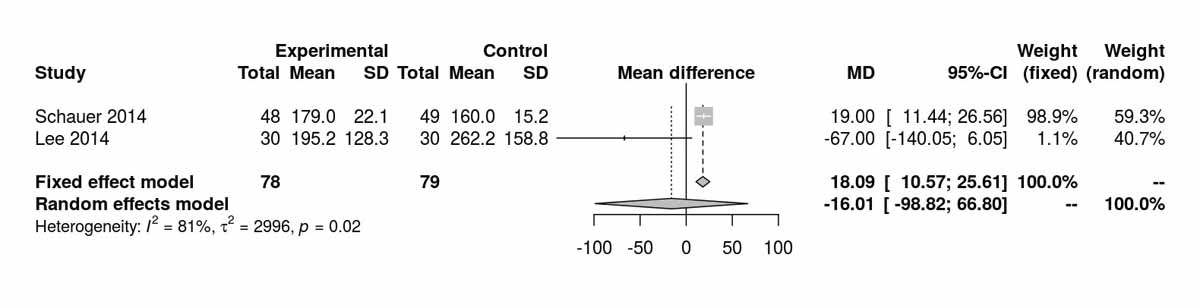
Figure S6p Triglycerides at baseline (analysis of studies including only patients with type 2 diabetes).

Figure S6q Triglycerides at 12 months (analysis of studies including only patients with type 2 diabetes).
We are very grateful to Dr Martina Gostelli for performing the literature search at the main library of the University of Zurich.
No financial support and no other potential conflict of interest relevant to this article was reported.
1 Colquitt J , Clegg A , Sidhu M , Royle P . Surgery for morbid obesity. Cochrane Database Syst Rev. 2003;(2):CD003641.
2 Angrisani L , Santonicola A , Iovino P , Formisano G , Buchwald H , Scopinaro N . Bariatric Surgery Worldwide 2013. Obes Surg. 2015;25(10):1822–32. doi:.https://doi.org/10.1007/s11695-015-1657-z
3 Mingrone G , Panunzi S , De Gaetano A , Guidone C , Iaconelli A , Nanni G , et al. Bariatric-metabolic surgery versus conventional medical treatment in obese patients with type 2 diabetes: 5 year follow-up of an open-label, single-centre, randomised controlled trial. Lancet. 2015;386(9997):964–73. doi:.https://doi.org/10.1016/S0140-6736(15)00075-6
4 Lee WJ , Chong K , Ser KH , Lee YC , Chen SC , Chen JC , et al. Gastric bypass vs sleeve gastrectomy for type 2 diabetes mellitus: a randomized controlled trial. Arch Surg. 2011;146(2):143–8. doi:.https://doi.org/10.1001/archsurg.2010.326
5 Hozo SP , Djulbegovic B , Hozo I . Estimating the mean and variance from the median, range, and the size of a sample. BMC Med Res Methodol. 2005;5(1):13. doi:.https://doi.org/10.1186/1471-2288-5-13
6 Raptis DA , Mettler T , Fischer MA , Patak M , Lesurtel M , Eshmuminov D , et al. Managing multicentre clinical trials with open source. Inform Health Soc Care. 2014;39(2):67–80. doi:.https://doi.org/10.3109/17538157.2013.812647
7 Woelnerhanssen B , Peterli R , Steinert RE , Peters T , Borbély Y , Beglinger C . Effects of postbariatric surgery weight loss on adipokines and metabolic parameters: comparison of laparoscopic Roux-en-Y gastric bypass and laparoscopic sleeve gastrectomy--a prospective randomized trial. Surg Obes Relat Dis. 2011;7(5):561–8. doi:.https://doi.org/10.1016/j.soard.2011.01.044
8 Peterli R , Steinert RE , Woelnerhanssen B , Peters T , Christoffel-Courtin C , Gass M , et al. Metabolic and hormonal changes after laparoscopic Roux-en-Y gastric bypass and sleeve gastrectomy: a randomized, prospective trial. Obes Surg. 2012;22(5):740–8. doi:.https://doi.org/10.1007/s11695-012-0622-3
9 Peterli R , Borbély Y , Kern B , Gass M , Peters T , Thurnheer M , et al. Early results of the Swiss Multicentre Bypass or Sleeve Study (SM-BOSS): a prospective randomized trial comparing laparoscopic sleeve gastrectomy and Roux-en-Y gastric bypass. Ann Surg. 2013;258(5):690–4, discussion 695. doi:.https://doi.org/10.1097/SLA.0b013e3182a67426
10 Lee WJ , Chen CY , Chong K , Lee YC , Chen SC , Lee SD . Changes in postprandial gut hormones after metabolic surgery: a comparison of gastric bypass and sleeve gastrectomy. Surg Obes Relat Dis. 2011;7(6):683–90. doi:.https://doi.org/10.1016/j.soard.2011.07.009
11 Lee WJ , Chong K , Lin YH , Wei JH , Chen SC . Laparoscopic sleeve gastrectomy versus single anastomosis (mini-) gastric bypass for the treatment of type 2 diabetes mellitus: 5-year results of a randomized trial and study of incretin effect. Obes Surg. 2014;24(9):1552–62. doi:.https://doi.org/10.1007/s11695-014-1344-5
12 Schauer PR , Kashyap SR , Wolski K , Brethauer SA , Kirwan JP , Pothier CE , et al. Bariatric surgery versus intensive medical therapy in obese patients with diabetes. N Engl J Med. 2012;366(17):1567–76. doi:.https://doi.org/10.1056/NEJMoa1200225
13 Schauer PR , Bhatt DL , Kirwan JP , Wolski K , Brethauer SA , Navaneethan SD , et al.; STAMPEDE Investigators. Bariatric surgery versus intensive medical therapy for diabetes--3-year outcomes. N Engl J Med. 2014;370(21):2002–13. doi:.https://doi.org/10.1056/NEJMoa1401329
14 Kashyap SR , Bhatt DL , Wolski K , Watanabe RM , Abdul-Ghani M , Abood B , et al. Metabolic effects of bariatric surgery in patients with moderate obesity and type 2 diabetes: analysis of a randomized control trial comparing surgery with intensive medical treatment. Diabetes Care. 2013;36(8):2175–82. doi:.https://doi.org/10.2337/dc12-1596
15 Karamanakos SN , Vagenas K , Kalfarentzos F , Alexandrides TK . Weight loss, appetite suppression, and changes in fasting and postprandial ghrelin and peptide-YY levels after Roux-en-Y gastric bypass and sleeve gastrectomy: a prospective, double blind study. Ann Surg. 2008;247(3):401–7. doi:.https://doi.org/10.1097/SLA.0b013e318156f012
16 Peterli R , Wölnerhanssen B , Peters T , Devaux N , Kern B , Christoffel-Courtin C , et al. Improvement in glucose metabolism after bariatric surgery: comparison of laparoscopic Roux-en-Y gastric bypass and laparoscopic sleeve gastrectomy: a prospective randomized trial. Ann Surg. 2009;250(2):234–41. doi:.https://doi.org/10.1097/SLA.0b013e3181ae32e3
17 Kehagias I , Karamanakos SN , Argentou M , Kalfarentzos F . Randomized clinical trial of laparoscopic Roux-en-Y gastric bypass versus laparoscopic sleeve gastrectomy for the management of patients with BMI < 50 kg/m2. Obes Surg. 2011;21(11):1650–6. doi:.https://doi.org/10.1007/s11695-011-0479-x
18 Paluszkiewicz R , Kalinowski P , Wróblewski T , Bartoszewicz Z , Białobrzeska-Paluszkiewicz J , Ziarkiewicz-Wróblewska B , et al. Prospective randomized clinical trial of laparoscopic sleeve gastrectomy versus open Roux-en-Y gastric bypass for the management of patients with morbid obesity. Wideochir Inne Tech Malo Inwazyjne. 2012;7(4):225–32. doi:.https://doi.org/10.5114/wiitm.2012.32384
19 Ramón JM , Salvans S , Crous X , Puig S , Goday A , Benaiges D , et al. Effect of Roux-en-Y gastric bypass vs sleeve gastrectomy on glucose and gut hormones: a prospective randomised trial. J Gastrointest Surg. 2012;16(6):1116–22. doi:.https://doi.org/10.1007/s11605-012-1855-0
20 Keidar A , Hershkop KJ , Marko L , Schweiger C , Hecht L , Bartov N , et al. Roux-en-Y gastric bypass vs sleeve gastrectomy for obese patients with type 2 diabetes: a randomised trial. Diabetologia. 2013;56(9):1914–8. doi:.https://doi.org/10.1007/s00125-013-2965-2
21 Helmiö M , Victorzon M , Ovaska J , Leivonen M , Juuti A , Peromaa-Haavisto P , et al. Comparison of short-term outcome of laparoscopic sleeve gastrectomy and gastric bypass in the treatment of morbid obesity: A prospective randomized controlled multicenter SLEEVEPASS study with 6-month follow-up. Scand J Surg. 2014;103(3):175–81. doi:.https://doi.org/10.1177/1457496913509984
22 Higgins JP , Altman DG , Gøtzsche PC , Jüni P , Moher D , Oxman AD , et al.; Cochrane Bias Methods Group; Cochrane Statistical Methods Group. The Cochrane Collaboration’s tool for assessing risk of bias in randomised trials. BMJ. 2011;343(oct18 2):d5928. doi:.https://doi.org/10.1136/bmj.d5928
23 Li JF , Lai DD , Lin ZH , Jiang TY , Zhang AM , Dai JF . Comparison of the long-term results of Roux-en-Y gastric bypass and sleeve gastrectomy for morbid obesity: a systematic review and meta-analysis of randomized and nonrandomized trials. Surg Laparosc Endosc Percutan Tech. 2014;24(1):1–11. doi:.https://doi.org/10.1097/SLE.0000000000000041
24 Yip S , Plank LD , Murphy R . Gastric bypass and sleeve gastrectomy for type 2 diabetes: a systematic review and meta-analysis of outcomes. Obes Surg. 2013;23(12):1994–2003. doi:.https://doi.org/10.1007/s11695-013-1030-z
25 Li JF , Lai DD , Ni B , Sun KX . Comparison of laparoscopic Roux-en-Y gastric bypass with laparoscopic sleeve gastrectomy for morbid obesity or type 2 diabetes mellitus: a meta-analysis of randomized controlled trials. Can J Surg. 2013;56(6):E158–64. doi:.https://doi.org/10.1503/cjs.026912
26 Benaiges D , Flores Le-Roux JA , Pedro-Botet J , Chillarón JJ , Renard M , Parri A , et al. Sleeve gastrectomy and Roux-en-Y gastric bypass are equally effective in correcting insulin resistance. Int J Surg. 2013;11(4):309–13. doi:.https://doi.org/10.1016/j.ijsu.2013.02.007
27 Milone M , Lupoli R , Maietta P , Di Minno A , Bianco P , Ambrosino P , et al. Lipid profile changes in patients undergoing bariatric surgery: a comparative study between sleeve gastrectomy and mini-gastric bypass. Int J Surg. 2015;14:28–32. doi:.https://doi.org/10.1016/j.ijsu.2014.12.025
28 Lutz TA , Bueter M . The physiology underlying Roux-en-Y gastric bypass: a status report. Am J Physiol Regul Integr Comp Physiol. 2014;307(11):R1275–91. doi:.https://doi.org/10.1152/ajpregu.00185.2014
29 le Roux CW , Aylwin SJ , Batterham RL , Borg CM , Coyle F , Prasad V , et al. Gut hormone profiles following bariatric surgery favor an anorectic state, facilitate weight loss, and improve metabolic parameters. Ann Surg. 2006;243(1):108–14. doi:.https://doi.org/10.1097/01.sla.0000183349.16877.84
CH and TH share first authorship
No financial support and no other potential conflict of interest relevant to this article was reported.