Figure 1 Patient recruitment and assignment of controls.
DOI: https://doi.org/10.4414/smw.2018.14624
The elderly (people over 75 years of age or those over 65 with comorbidities) are at high risk of potentially avoidable hospital readmission. A potentially avoidable readmission is an unplanned readmission caused by known morbidities and occurring within 30 days of discharge [1]. About 20% of elderly inpatients are subject to potentially avoidable readmission [2]. As there is no consensus on a classification of avoidable readmissions [3, 4], all unplanned readmissions are considered. These readmissions are deleterious for the elderly: a readmission increases the risk of dependence and functional or psychosocial decline [5]. Moreover, they increase the risk of decompensation of other comorbid conditions, thus increasing the frailty of elderly patients [6]. In the United States, costs associated with these readmissions amount to 17.5 billion dollars [7]; it is therefore, a public health priority to reduce readmission rates of the elderly.
According to the French Ministry of Health, it is neither “necessary nor efficient to intervene for every patient” aged 75 and over to reduce the readmission rate [8]. Therefore, it is crucial to develop and apply tools to identify patients at risk of readmission and then to set up interventions. Clinical scores are tools that make it possible to identify elderly inpatients at risk of readmission.
In the literature, there are many scores that identify elderly inpatients at risk of readmission [9]. Among these, the LACE index, created in 2010 [10], the HOSPITAL score, 2010 [11] or the Triage Risk Screening Tool (TRST), 2003 [12] can easily be calculated from data in medical records and are widely used. The purpose of this study was to implement the chosen score in the hospital’s medical software, in order to generate an automatic alert on high-risk patients.
In 2015, Alassaad et al. constructed a clinical score including iatrogenic factors (prescription of drugs for peptic ulcer, opioid drugs or non-tricyclic antidepressants) [13]. This focus on iatrogenic factors is interesting, as 10 to 30% of readmissions are drug-related [14], and iatrogenic factors can be eliminated by adjusting the prescription. This “80+ score”, which focuses on iatrogenic factors, must be compared with already existing scores focusing on demographic and sociological factors or comorbidities: the LACE index [10], the HOSPITAL score [11] and the TRST [12].
Clinical scores require internal and external validation. Internal validation means testing the score in the population used to create it. It describes the performance of the score (calibration and discrimination). Then, prior to general application, the score has to be externally validated – tested in a new population that ensures the reproducibility of the score. According to the TRIPOD statement [15], external validation may use types of participants different from the development population. Thus, we choose to externally validate the LACE and HOSPITAL scores, which were developed in general adult population, on an elderly population.
Unlike the LACE index [10], the HOSPITAL score [11] and the TRST [12], the 80+ score has not been externally validated to date.
The main objective of this study was to carry out an external validation of the 80+ score and to compare it with the three other scores.
We used the patient data from a monocentric, retrospective, matched, case-control study using the clinical data warehouse [16] of a French university hospital, the Hôpital européen Georges Pompidou. This is a teaching hospital of 795 beds with 24 clinical departments (15 medical wards and 9 surgical units). The clinical information system is coupled with a clinical data warehouse, which makes reuse of healthcare data and clinical research possible. The main objective of the first study was to research iatrogenic risk factors for unplanned readmissions.
Elderly patients are people over 75 years of age or those over 65 with comorbidities; in order to avoid the inclusion of patients between 65 and 75 years old without comorbidities, we included only patients over 75 years old. Patients were admitted to hospital, in a medical or surgical ward, between 1 October 2014 and 30 September 2015. Cases were elderly patients who experienced an unscheduled readmission within 30 days after the index discharge. Readmissions had to be via the accident and emergency department (AED) to be considered unscheduled. The patients were either discharged after the AED visit or hospitalised. The control group consisted of elderly patients who had not had any unscheduled readmissions during the 30 days after the index discharge. All controls who died during the index hospitalisation were excluded. Cases and controls were randomly matched for sex and age. We excluded all patients lost to follow-up who were potentially dead after the index admission.
The sample size of our study was calculating according to Collins et al. [17]. They suggested that, to externally validate prognostic models, a minimum of 100 events and ideally 200 (or more) events are required.
Table 1 Items comprising each of the four scores.
| Score 80+ | LACE index | HOSPITAL | TRST |
|---|---|---|---|
| Estimated glomerular filtration rate (eGFR) | Lengths of hospitalisation | Haemoglobin level at discharge | History of cognitive impairment |
| Level of social support | Acuteness of the admission | Discharge from an Oncology unit | Difficulty walking/transferring or recent falls |
| Pulmonary disease (asthma or chronic obstruction pulmonary disease) | Sodium level at discharge | ||
| Malignant disease | Comorbidities of patients | Procedures during hospital stay | Taking five or more medications |
| Prescription of a drug for peptic ulcer or gastro-oesophageal reflux disease | Index admission type | ||
| Prescription of an opioid drug | AED admissions | Number of hospital admissions during the previous year | AED use in previous 30 days or hospitalisation in previous 90 days |
| Prescription of an antidepressant drug (except tricyclic antidepressant) | Length of hospitalisation |
AED = accident and emergency department; TRST = Triage Risk Screening Tool
A clinical score is a tool that can be used by hospital practitioners to guide medical interventions. They are built with a series of variables corresponding to medical background, and sociological, biological or clinical observations. For each variable, the patient is attributed a number of points. Points are added up, giving the final value of the score. The scoring system ranges from a minimum to a maximum, where the likelihood of readmission increases with the calculated value of the score.
The 80+ score [13] is a point score system used for risk estimation that was developed at the Uppsala University Hospital in 2015. It includes seven variables and ranges from −2 to 10. A patient with a score greater than 3 has an 80% risk of readmission. The 80+ score was internally validated in a prospective randomised control trial [13] and showed good performances, with a c-statistic of 0.72 (95% confidence interval [CI] 0.66–0.77) and a good calibration. However, to our knowledge, this score has never been externally validated, unlike the other three scores.
The LACE index [10] is a point score initially conceived in Ontario, Canada in 2010. It ranges from 0 to 44. A patient with a score greater than 10 is considered at high risk for unplanned hospital readmission. This score was derived and validated in a prospective cohort study. This internal validation showed good discrimination, with a c-statistic of 0.684 [10].
The HOSPITAL score [18], developed in Massachusetts, USA in 2013, is a score built with seven variables forming the acronym HOSPITAL. The score ranges from 0 to 13. A patient is considered at high risk of readmission when he or she has a score equal or greater than 7. The HOSPITAL score was internally validated in a retrospective cohort study [18] and showed good performances with a c-statistic of 0.71.
The TRST [12] is a five-item clinical prediction, a rule designed for rapid administration by the triage nurse in an AED after minimal training; it was developed in Cleveland, USA in 2003. The score ranges from 0 to 5. A patient is at high risk of readmission if the score is greater than 2. The TRST was internally validated in a prospective cohort study [12] and showed a good performances with an area under the receiver operating characteristic curve (AUC of the ROC curve) of 0.72 for readmissions at 30 days.
The table 2 shows the differences between the development data and our validation data in setting, eligibility criteria and outcome.
Table 2 Differences between development data and validation data.
| Criteria | Development data | Validation data | |||
|---|---|---|---|---|---|
| Score 80+ | LACE | HOSPITAL | TRST | ||
| Setting | Internal medicine wards in University Hospital, Sweden | Medical or surgical services of 11 hospitals, Canada | Medical wards of two hospitals, USA | Two urban, academic AED | Medical or surgical wards of an university hospital, France |
| Eligibility criteria | Patients aged 80 years and older, acutely admitted | Adult patients discharged to the community | Adult inpatients (length of stay of more than 24 hours) | Patients aged 65 years and older, with AED visit, discharged home | Patients aged 75 years and older, discharged home |
| Outcome | Unplanned readmission (AED visit or readmission) or death during the 12-month follow-up period | Unplanned readmission to hospital or death within 30 days of discharge | 30 day potentially avoidable readmission | AED visit, hospital admission or nursing home admission at 30 and 120 days | Unplanned readmission (AED visit or readmission) within 30 days of discharge |
AED = accident and emergency department; TRST = Triage Risk Screening Tool
All patient data and medical history records were retrieved using the clinical data warehouse. An ethics committee approved the study protocol (CERHUPO, CDW_2015_0023).
For biological data (estimated glomerular filtration rate [eGFR], haemoglobin and sodium levels), the last available analyses before discharge were chosen. For medication data (drug for peptic ulcer, opioid, non-tricyclic antidepressant and polypharmacy), we used the prescription at discharge.
For other data, all available medical records were analysed to find the patient’s medical background (pulmonary and malignant disease, Charlson index and history of hospital admission), mental and physical state of the patient (cognition, falls, staff recommendation) and procedures performed during the hospitalisation.
Medical records are completed by healthcare professionals. It is recognised that in medical records, doctors enumerate comorbidities and do not always record specific data that are unknown. We therefore considered that the absence of a specific piece of information (such as asthma, cancer history) in the medical report meant the absence of the condition.
For data management, the outliers were corrected after a second check of the medical record: when an outlier was detected, the medical record was read to confirm the variable. The missing data of qualitative variables were imputed according to the context. For example, elderly patients usually live at home, and not in a nursing home. Thus, if it was not mentioned that the patient lived in a nursing home, he or she was assumed to be living at home. The data were then corrected. The quantitative variables were imputed by the median (less than 20% of missing data) or by multiple imputation (more than 20% of missing data).
All scores were calculated by adding the points of each given variable. Cases and controls were analysed for each variable of each score. The qualitative variables were compared using Pearson’s χ2 test. A univariate analysis was performed with a t-test to compare scores between the two groups.
Discrimination is the ability of the score to separate cases from control groups. To determine the discriminatory ability of the scores, the c-statistic was calculated. The c-statistic gives the probability that a randomly selected patient has a higher score than a patient not -readmitted. A value below 0.5 indicates that the score has poor discriminatory ability. A score has a good discrimination when the c-statistic ranges from 0.7 to 1. It has fair discrimination when ranging from 0.5 to 0.7. The graphic representation of the c-statistic is the receiving operating characteristic (ROC) curve. The ROC curves of the four scores were drawn, and the areas under the curve (AUCs) were calculated.
Calibration shows the ability of the model to generate probabilities that match the observed rates. We used the Hosmer-Lemeshow χ2 test to assess the calibration of the selected scores. If the p-value is greater than 0.05, the score has a good calibration.
We then estimated the sensitivity, the specificity, the positive predictive value, the negative predictive value, the positive likelihood ratio and the negative likelihood ratio.
Analyses were performed with the R software (R version 3.3.2), with a significance level of α = 0.05.
From 1 September 2014 to 31 October 2015, 6574 elderly patients meeting our criteria were admitted to the hospital. Within 30 days after discharge of the index admission, 456 patients (6.4%) were readmitted, and 6118 were not. These 456 patients were randomly matched with 456 controls among the 6118 patients, creating 456 case-control pairs. Of those 456 pairs, 237 controls were lost during follow-up, resulting in a final pool of 219 pairs. The flow of participants is described in figure 1.
Figure 1 Patient recruitment and assignment of controls.
A total of 438 patients were included, whom 52% were women. The mean age was 84.4 years (standard deviation [SD] 5.90). On admission, 46% of the patients were in a relationship, 51% were single (3% missing values). The patients' baseline characteristics are listed in table 3.
Table 3 Patient characteristics.
| Variables | n (100%) or mean (±SD) | % missing values |
|---|---|---|
| Age (year) | 84.4 (±5.9) | 0 |
| Gender | 0 | |
| Female | 229 (52%) | |
| Male | 209 (48%) | |
| Marital status | 3% | |
| Single | 225 (51%) | |
| In a relationship | 201 (46%) | |
| Living situation | 4% | |
| Living alone | 169 (39%) | |
| Living with someone | 248 (57%) | |
| Place of residence | 1% | |
| Nursing home | 33 (8%) | |
| Private home | 397 (91%) | |
| Charlson index | 2.64 (±1.92) | 2% |
| Length of stay (days) | 8.49 (±7.5) | 0 |
| Admission type | 0 | |
| Planned | 287 (66%) | |
| Unplanned | 151 (34%) | |
| Ward type | 0 | |
| Medical ward | 286 (65%) | |
| Surgical ward | 152 (35%) | |
| Discharge | 1% | |
| Discharge home | 316 (72%) | |
| Transfer | 120 (27%) | |
| Primary diagnosis at discharge | 0 | |
| Cardiovascular | 120 (27%) | |
| Oncological | 64 (15%) | |
| Respiratory | 41 (9%) | |
| Gastrointestinal | 38 (9%) | |
| Kidney/Urological | 35 (8%) | |
| Other | 140 (32%) | |
| Number of medications at discharge | 7.5 (±3.8) | 2% |
Using a t-test, the means of the scores were compared between cases and controls (table 4). The 80+ score, the LACE index and the HOSPITAL score had p-values of 0.87, 0.24 and 0.60, respectively, meaning that there was no significant difference between cases and controls. In contrast, for the TRST, the mean score of the cases was significantly different from the mean score of the controls (p <0.001).
Table 4 Score results.
|
Variables
n = 438 |
Cases
– readmission n (%) |
Controls
– no readmission n (%) |
p-value | |
|---|---|---|---|---|
| 80+ score | ||||
| eGFR | ||||
| >90 ml/min | 37 (44) | 47 (56) | 0.28 | |
| 60–89 ml/min | 70 (50.4) | 69 (49.6) | 0.93 | |
| 30-59 ml/min | 85 (52.5) | 77 (47.5) | 0.53 | |
| <30 ml/min | 27 (50.9) | 26 (49.1) | 0.89 | |
| Social support | ||||
| Living alone or with spouse | 196 (48.2) | 211 (51.8) | 0.46 | |
| Nursing home | 23 (74.2) | 8 (25.8) | 0.007 | |
| Pulmonary disease (yes) | 32 (43.2) | 42 (56.8) | 0.24 | |
| Malignant disease (yes) | 93 (51.1) | 89 (48.9) | 0.77 | |
| Drug for peptic ulcer or GORD | 96 (46.6) | 110 (53.4) | 0.36 | |
| Opioid drug | 41 (58.6) | 29 (41.4) | 0.15 | |
| Non-TCA-antidepressant drug | 43 (59.7) | 29 (40.3) | 0.10 | |
| Total, mean (SD) | 2.83 (1.69) | 2.80 (1.75) | 0.650 | |
| LACE index | ||||
| Length of stay | ||||
| 1 day | 17 (58.6) | 12 (41.4) | 0.35 | |
| 2 days | 48 (54.5) | 40 (45.5) | 0.39 | |
| 3 days | 21 (43.8) | 27 (56.2) | 0.39 | |
| 4–6 days | 48 (48.5) | 51 (51.5) | 0.76 | |
| 7–13 days | 58 (50) | 58 (50) | 1 | |
| ≥14 days | 27 (46.6) | 31 (53.4) | 0.60 | |
| Admitted via AED | 138 (47.9) | 150 (52.1) | 0.48 | |
| Charlson index, mean (SD) | 16.3 (1.29) | 16.06 (1.31) | 0.072 | |
| No. of AED visits | ||||
| 0 | 73 (44.8) | 90 (55.2) | 0.18 | |
| 1 | 177 (52.7) | 69 (47.3) | 0.51 | |
| 2 | 22 (44) | 28 (56) | 0.40 | |
| 3 | 16 (55.2) | 13 (44.8) | 0.58 | |
| ≥4 | 31 (62) | 19 (38) | 0.09 | |
| Total, mean (SD) | 11.92 (4.16) | 11.45 (4.3) | 0.240 | |
| HOSPITAL score | ||||
| Low haemoglobin level at discharge | 133 (50.6) | 130 (49.4) | 0.85 | |
| Discharge from an oncology service | 22 (45.8) | 26 (54.2) | 0.56 | |
| Low sodium level at discharge | 39 (52) | 36 (48) | 0.73 | |
| Procedure during hospital stay | 97 (47.5) | 107 (52.5) | 0.48 | |
| Index admission type (urgent) | 137 (47.6) | 151 (52.4) | 0.41 | |
| No. of hospital admissions during the previous year | ||||
| 0–1 | 97 (44.2) | 123 (55.9) | 0.08 | |
| 2–5 | 101 (56.1) | 79 (43.9) | 0.10 | |
| >5 | 21 (55.3) | 17 (44.7) | 0.52 | |
| Length of stay ≥5 days | 112 (48.7) | 118 (51.3) | 0.69 | |
| Total, mean (SD) | 4.48 (2.37) | 4.36 (2.45) | 0.606 | |
| TRST | ||||
| Cognitive impairment | 44 (60.3) | 29 (39.7) | 0.08 | |
| Difficulty walking, falls | 54 (61.4) | 34 (38.6) | 0.03 | |
| Polymedication | 174 (51.9) | 161 (48.1) | 0.48 | |
| History of AED visit or hospitalisation | 72 (52.9) | 64 (47.1) | 0.49 | |
| AED staff recommendations | 123 (54.9) | 101 (45.1) | 0.14 | |
| Total, mean (SD) | 2.13 (1.11) | 1.78 (1.11) | 0.00086** | |
AED = accident and emergency department; eGFR = estimated glomerular filtration rate; GORD = gastro-oesophageal reflux disease; SD = standard deviation; TCA = tricyclic antidepressant; TRST = Triage Risk Screening Tool ** p <0.001
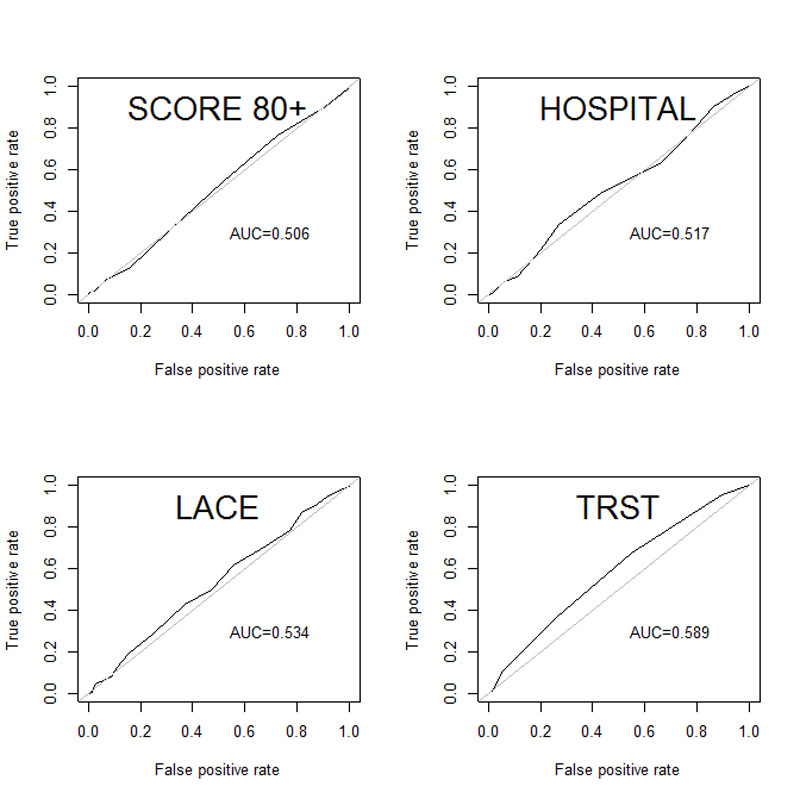
The discrimination was calculated with the AUC of the ROC curve (table 5). The 80+ score had the lowest AUC (0.506) and TRST had the highest (0.589; fig. 2).
Table 5 Discriminatory ability of the four scores analysed with c-statistics.
| Score | AUC |
|---|---|
| 80+ score | 0.506 (0.413–0.546) |
| LACE index | 0.534 (0.459–0.591) |
| HOSPITAL score | 0.517 (0.466–0.598) |
| TRST | 0.589 (0.524–0.654) |
AUC = area under the receiver operating characteristic curve; TRST = Triage Risk Screening Tool

Figure 2 Receiver operating characteristic curves.
The calibration was estimated with the Hosmer-Lemeshow χ2 test (table 6).
Table 6 Calibration of the four scores analysed with the Hosmer-Lemeshow χ2 test.
| Score | χ2 | Degrees of freedom | p-value |
|---|---|---|---|
| 80+ score | 7.89 | 8 | 0.44 |
| LACE index | 23.56 | 23 | 0.43 |
| HOSPITAL score | 15.75 | 10 | 0.11 |
| TRST | 3.44 | 4 | 0.49 |
TRST = Triage Risk Screening Tool
The LACE index had the highest sensitivity (61%, 95% CI 55–68%) and the HOSPITAL score had the lowest sensitivity (21%, 95% CI 16-27%). The HOSPITAL score had the highest specificity (80%, 95% CI 75–85%) and the LACE index had the lowest specificity (44%, 95% CI 38–51%; table 7).
Table 7 Metrological characteristics.
| 80+ score | LACE index | HOSPITAL score | TRST | |
|---|---|---|---|---|
| Cut-off | >3 | >10 | >6 | >2 |
| Sensitivity | 0.31 (0.24–0.37) | 0.61 (0.55–0.68) | 0.21 (0.16–0.27) | 0.37 (0.31–0.43) |
| Specificity | 0.69 (0.63–0.75) | 0.44 (0.38–0.51) | 0.80 (0.75–0.85) | 0.74 (0.68–0.80) |
| PPV | 0.50 (0.41–0.58) | 0.52 (0.46–0.58) | 0.52 (0.41–0.62) | 0.59 (0.50–0.67) |
| NPV | 0.50 (0.44–0.55) | 0.54 (0.46–0.61) | 0.50 (0.45–0.56) | 0.54 (0.48–0.60) |
| LR-P | 0.99 (0.74–1.30) | 1.1 (0.94–1.29) | 1.07 (0.74–1.54) | 1.42 (1.07–1.88) |
| LR-N | 1.01 (0.89–1.14) | 0.87 (0.70–1.09) | 0.98 (0.89–1.08) | 0.85 (0.75–0.97) |
PPV = positive predictive value; NPV = negative predictive value; LR-P = likelihood ratio-positive; LR-N = likelihood ratio negative
In our study, the new 80+ score showed an AUC of the ROC curve of 0.506. Thus it has not demonstrated better discrimination than the three other scores.
The TRST performed best in identifying elderly patients at risk for readmission within 30 days of discharge. Even though they showed fair calibration, the 80+ score, the HOSPITAL score and the LACE index had not strong enough discriminatory power. The four scores had all previously been internally validated. In our study we observed that the calibration and validation of these four scores were not as good as had been reported in the internal validation studies. One of the possible reasons for this difference was the selection of our patients, who were all alive 30 days after discharge, whereas most of these other studies also included deaths, meaning that patients in our study were in a better health. Indeed, in a validation study of the LACE index, performed at the Department of Medicine for the Elderly Cambridge University Hospital [19], the LACE index also showed poor performances in predicting readmission, but better performance in predicting death. This supports the hypothesis that these scores perform better at identifying both patients at risk of readmission and at risk of dying.
The HOSPITAL score, an easy-to-use score, was externally validated in a large international (USA, Canada, Switzerland, Israel) retrospective cohort study [11] of 121,136 patients, and showed very good calibration and discrimination. Our study included only 219 control-case pairs, and therefore probably did not have the same statistical power. The HOSPITAL score was also validated in a Swiss population of patients aged 50 years old and older [20]. In this second validation study, with a population more similar to ours, showed very good calibration (p = 0.89) and discrimination (c-statistic = 0.72). It was a prospective cohort study and the first outcome was either death or unplanned readmission within 30 days, whereas our primary outcome was only unplanned readmission within 30 days after discharge. As we had an older population (inpatients 75 years and older vs 50 years and older for Aubert et al. [20]), the death rate might have been higher. Moreover, Cooksley et al. [21] have shown that the discriminatory power of HOSPITAL and LACE scores decreased with increasing age.
The 80+ score is a recent clinical score identifying elderly patients at risk of readmission. Its strength is that it takes into account medication. Thus, if the prescription is adjusted during the hospitalisation, the risk of readmission is decreased. The same applies to the TRST, which takes into account the number of drugs, so that the prescription can also be adjusted according to the benefit-risk balance of the treatment. Conversely, the LACE index and the HOSPITAL score do not take into account prescriptions. They focus on admission characteristics (index admission type, length of stay and history of hospitalisation). In a recent systematic review, Pedersen et al. identified length of stay and comorbid conditions as risk factors for readmission [22]. Thus, some drugs have an impact on the benefit-risk ratio, in favour of risk, when administered to elderly patients. There are lists of potentially inappropriate medications (PIMs) [23–25], although the results of studies on PIMs and readmissions are conflicting. A study showed that the prescription of PIMs had no effect on readmission [26], but another study showed that the prescription of benzodiazepines, some of which (long-acting benzodiazepines) are listed as PIMs, was associated with a higher readmission risk (odds ratio 1.23) [27]. This might explain the lower performance of the 80+ score.
When the 80+ score was internally validated, it showed better discriminatory ability than in our study. This difference may be due to the difference of population in the two studies. Alassaad et al. [13] included patients aged 80 years and older and acutely admitted to an internal medicine ward at a university hospital, whereas we included patients aged 75 years and older admitted (acutely or not) to medical and surgical wards.
We acknowledge that our study has limitations. It was a single-centre retrospective case-control study. Sex and age were matched in order to select the controls and obtain a relatively homogeneous population. Matching on length of stay or comorbidities, which are items of the LACE and HOSPITAL scores, would not have improved the power of the study. All the data were retrieved from an electronic database and we made the assumption that if a specific condition was not in the medical record, it was absent. Therefore, it is less powerful than a prospective study with a questionnaire where each variable of the score would be filled in with either a negative or positive answer. In the same way, we excluded elderly under 75 years old, i.e., we ignored patients aged 65 to 75 years with comorbidities. Deaths within 30 days and patients lost to follow-up were not included. Another limitation due to the use of an electronic database is that we did not consider readmissions that did not originate from an AED visit or that occurred in another hospital. It could explain why the readmission rate was relatively low (6.4%).
In the cohort of this study, the 80+ score showed poorer discrimination than the three other scores. All the four scores analysed showed less ability to identify potentially avoidable readmission of elderly patients than in other studies found in the literature. One of the perspectives of this study would be to identify patients at risk of readmission using the TRST and then set a medication reconciliation protocol with case and control groups and finally assess the efficiency of such interventions in a population at risk.
No financial support and no other potential conflict of interest relevant to this article was reported.
1 Halfon P , Eggli Y , van Melle G , Chevalier J , Wasserfallen JB , Burnand B . Measuring potentially avoidable hospital readmissions. J Clin Epidemiol. 2002;55(6):573–87. doi:.https://doi.org/10.1016/S0895-4356(01)00521-2
2 Khan A , Malone ML , Pagel P , Vollbrecht M , Baumgardner DJ . An electronic medical record-derived real-time assessment scale for hospital readmission in the elderly. WMJ. 2012;111(3):119–23.
3 van Galen LS , Brabrand M , Cooksley T , van de Ven PM , Merten H , So RK , et al.; Safer@home consortium. Patients’ and providers’ perceptions of the preventability of hospital readmission: a prospective, observational study in four European countries. BMJ Qual Saf. 2017;26(12):958–69. doi:.https://doi.org/10.1136/bmjqs-2017-006645
4 van Walraven C , Bennett C , Jennings A , Austin PC , Forster AJ . Proportion of hospital readmissions deemed avoidable: a systematic review. CMAJ. 2011;183(7):E391–402. doi:.https://doi.org/10.1503/cmaj.101860
5 Arendts G , Fitzhardinge S , Pronk K , Donaldson M , Hutton M , Nagree Y . The impact of early emergency department allied health intervention on admission rates in older people: a non-randomized clinical study. BMC Geriatr. 2012;12(1):8. doi:.https://doi.org/10.1186/1471-2318-12-8
6 Sager MA , Franke T , Inouye SK , Landefeld CS , Morgan TM , Rudberg MA , et al. Functional outcomes of acute medical illness and hospitalization in older persons. Arch Intern Med. 1996;156(6):645–52. doi:.https://doi.org/10.1001/archinte.1996.00440060067008
7 Cloonan P , Wood J , Riley JB . Reducing 30-day readmissions: health literacy strategies. J Nurs Adm. 2013;43(7-8):382–7. doi:.https://doi.org/10.1097/NNA.0b013e31829d6082
8Haute Autorité de Santé. Comment réduire le risque de réhospitalisations évitables des personnes âgées? 2013. Available from: https://www.has-sante.fr/portail/jcms/c_1602735/fr/comment-reduire-les-rehospitalisations-evitables-des-personnes-agees.
9 Kansagara D , Englander H , Salanitro A , Kagen D , Theobald C , Freeman M , et al. Risk prediction models for hospital readmission: a systematic review. JAMA. 2011;306(15):1688–98. doi:.https://doi.org/10.1001/jama.2011.1515
10 van Walraven C , Dhalla IA , Bell C , Etchells E , Stiell IG , Zarnke K , et al. Derivation and validation of an index to predict early death or unplanned readmission after discharge from hospital to the community. CMAJ. 2010;182(6):551–7. doi:.https://doi.org/10.1503/cmaj.091117
11 Donzé JD , Williams MV , Robinson EJ , Zimlichman E , Aujesky D , Vasilevskis EE , et al. International Validity of the HOSPITAL Score to Predict 30-Day Potentially Avoidable Hospital Readmissions. JAMA Intern Med. 2016;176(4):496–502. doi:.https://doi.org/10.1001/jamainternmed.2015.8462
12 Meldon SW , Mion LC , Palmer RM , Drew BL , Connor JT , Lewicki LJ , et al. A brief risk-stratification tool to predict repeat emergency department visits and hospitalizations in older patients discharged from the emergency department. Acad Emerg Med. 2003;10(3):224–32. doi:.https://doi.org/10.1111/j.1553-2712.2003.tb01996.x
13 Alassaad A , Melhus H , Hammarlund-Udenaes M , Bertilsson M , Gillespie U , Sundström J . A tool for prediction of risk of rehospitalisation and mortality in the hospitalised elderly: secondary analysis of clinical trial data. BMJ Open. 2015;5(2):e007259. doi:.https://doi.org/10.1136/bmjopen-2014-007259
14 Bonnet-Zamponi D , d’Arailh L , Konrat C , Delpierre S , Lieberherr D , Lemaire A , et al.; Optimization of Medication in AGEd study group. Drug-related readmissions to medical units of older adults discharged from acute geriatric units: results of the Optimization of Medication in AGEd multicenter randomized controlled trial. J Am Geriatr Soc. 2013;61(1):113–21. doi:.https://doi.org/10.1111/jgs.12037
15 Collins GS , Reitsma JB , Altman DG , Moons KGM . Transparent reporting of a multivariable prediction model for individual prognosis or diagnosis (TRIPOD): the TRIPOD statement. BMJ. 2015;350(jan07 4):g7594. doi:.https://doi.org/10.1136/bmj.g7594
16 Schwab C , Korb-Savoldelli V , Escudie JB , Fernandez C , Durieux P , Saint-Jean O , et al. Iatrogenic risk factors associated with hospital readmission of elderly patients: A matched case-control study using a clinical data warehouse. J Clin Pharm Ther. 2018. doi:.https://doi.org/10.1111/jcpt.12670
17 Collins GS , Ogundimu EO , Altman DG . Sample size considerations for the external validation of a multivariable prognostic model: a resampling study. Stat Med. 2016;35(2):214–26. doi:.https://doi.org/10.1002/sim.6787
18 Donzé J , Aujesky D , Williams D , Schnipper JL . Potentially avoidable 30-day hospital readmissions in medical patients: derivation and validation of a prediction model. JAMA Intern Med. 2013;173(8):632–8. doi:.https://doi.org/10.1001/jamainternmed.2013.3023
19 Cotter PE , Bhalla VK , Wallis SJ , Biram RWS . Predicting readmissions: poor performance of the LACE index in an older UK population. Age Ageing. 2012;41(6):784–9. doi:.https://doi.org/10.1093/ageing/afs073
20 Aubert CE , Folly A , Mancinetti M , Hayoz D , Donzé J . Prospective validation and adaptation of the HOSPITAL score to predict high risk of unplanned readmission of medical patients. Swiss Med Wkly. 2016;146:w14335.
21 Cooksley T , Nanayakkara PWB , Nickel CH , Subbe CP , Kellett J , Kidney R , et al.; safer@home consortium. Readmissions of medical patients: an external validation of two existing prediction scores. QJM. 2016;109(4):245–8. doi:.https://doi.org/10.1093/qjmed/hcv130
22 Pedersen MK , Meyer G , Uhrenfeldt L . Risk factors for acute care hospital readmission in older persons in Western countries: a systematic review. JBI Database Syst Rev Implement Reports. 2017;15(2):454–85.
23 Laroche M-L , Bouthier F , Merle L , Charmes J-P . Médicaments potentiellement inappropriés aux personnes âgées : intérêt d’une liste adaptée à la pratique médicale française [Potentially inappropriate medications in the elderly: a list adapted to French medical practice]. Rev Med Interne. 2009;30(7):592–601. doi:.https://doi.org/10.1016/j.revmed.2008.08.010
24 Pohl-Dernick K , Meier F , Maas R , Schöffski O , Emmert M . Potentially inappropriate medication in the elderly in Germany: an economic appraisal of the PRISCUS list. BMC Health Serv Res. 2016;16(1):109. doi:.https://doi.org/10.1186/s12913-016-1366-x
25 American Geriatrics Society 2015 Beers Criteria Update Expert Panel. American Geriatrics Society 2015 Updated Beers Criteria for Potentially Inappropriate Medication Use in Older Adults. J Am Geriatr Soc. 2015;63(11):2227–46. doi:.https://doi.org/10.1111/jgs.13702
26 Hagstrom K , Nailor M , Lindberg M , Hobbs L , Sobieraj DM . Association between potentially inappropriate medication use in elderly adults and hospital-related outcomes. J Am Geriatr Soc. 2015;63(1):185–6. doi:.https://doi.org/10.1111/jgs.13229
27 Pavon JM , Zhao Y , McConnell E , Hastings SN . Identifying risk of readmission in hospitalized elderly adults through inpatient medication exposure. J Am Geriatr Soc. 2014;62(6):1116–21. doi:.https://doi.org/10.1111/jgs.12829
No financial support and no other potential conflict of interest relevant to this article was reported.