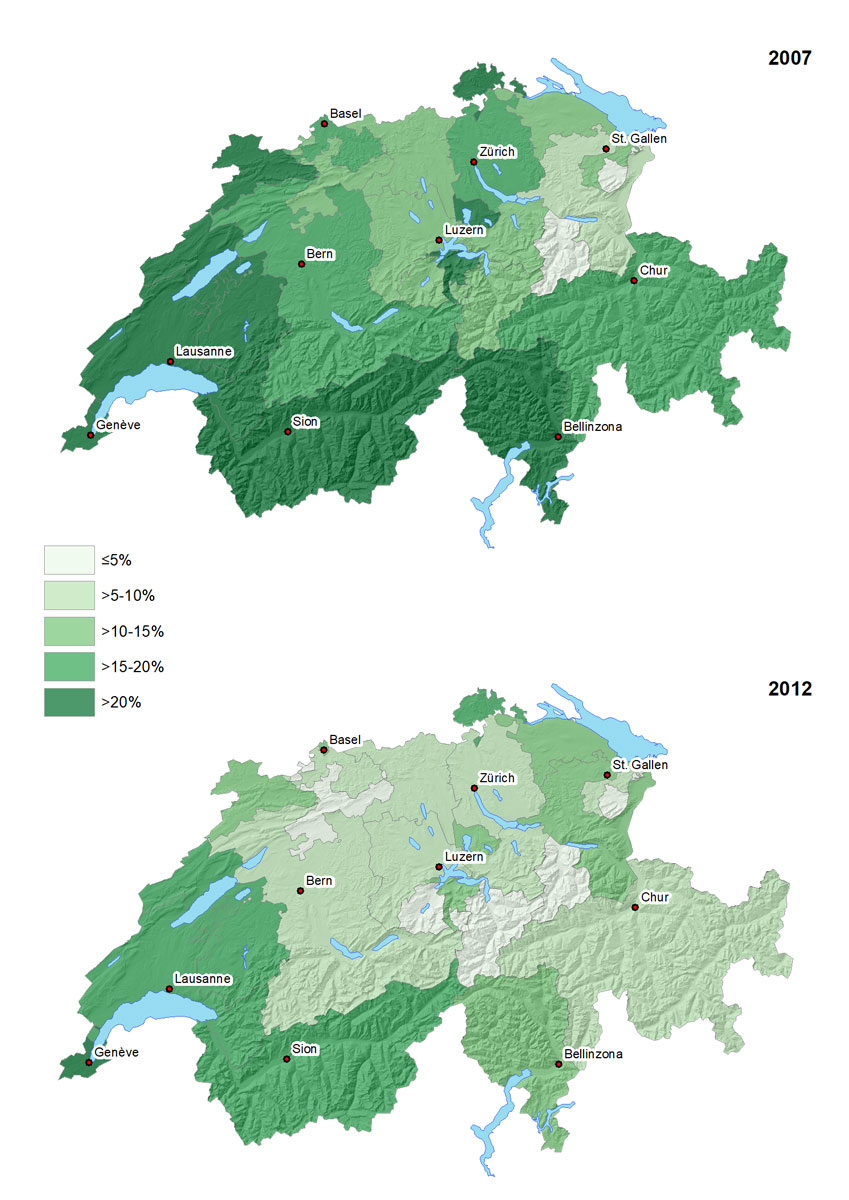
Figure 1 Geographical distribution of self-reported mammography in the last 12 months (percentage of population) in women aged 40-79 years in Switzerland, 2007 and 2012.
DOI: https://doi.org/10.4414/smw.2018.14603
Breast cancer in women is among the malignancies with the highest incidence and mortality in high-income countries such Switzerland [1]. More than 5700 women are affected in Switzerland each year, and 1400 die from breast cancer each year [1]. It is therefore a major public health problem. European and international associations recommend mammography screening of women aged 50 to 70 years for early detection of breast cancer [2]. Screening aims at detecting cancer or its precursor lesions early, when they are in a curable state. However, the value of screening programmes is a matter of debate because of the limited effect on mortality, false-positive findings requiring diagnostic workup and possible overdiagnosis and overtreatment [3–7]. In Switzerland, screening attendance is higher in the French-speaking area (mainly screening programmes) than in the German-speaking (mainly opportunistic screening) [8, 9], and this difference does not appear to be explained by sociodemographic or health-related factors [9]. Uptake of breast cancer screening has also been reported to be increased in women with higher incomes [10].
In 1995, the Swiss Federal Office of Public Health and the Swiss Cancer League adopted a national strategy for prevention, screening and care for breast cancer. Although a national screening programme has repeatedly been suggested in subsequent national strategy reports, a national programme has not been established [11], and Swiss cantons may or may not put a programme in place. Swiss compulsory basic health insurance reimburses mammography screening without access payments for women aged 50 to 70 years (at average risk), if carried out within a cantonal screening programme with systematic invitation of women and quality control of the screening process. Breast cancer screening attendance was expected to change after cantonal mammography programmes were expanded over time. Up to 2012, 9 out of 26 cantons introduced mammography screening, 5 after 2005 [1].
We aimed to study time trends and associations of sociodemographic characteristics and health-related factors with the changes of breast cancer screening in Switzerland between 2007 and 2012, using data from the nationwide representative health surveys.
The Swiss Health Interview Survey (SHIS) is a cross-sectional survey conducted every five years since 1992 by the Swiss Federal Statistical Office (SFSO). A random multistage probability sample is drawn from all residents in Switzerland, as previously reported [8, 12, 13]. The health survey collects data through computer-assisted telephone interviews (oral) and self-administered questionnaires (written). The interviews are conducted in the three official languages (German, French and Italian). In this study, we analysed the two most recent available data sets (from 2007 and 2012). We included 11,292 female respondents aged 40 to 79 years who responded to a written questionnaire, 5123 in 2007 and 6169 in 2012.
The main questions on breast cancer detection were:
Additional data collected included sociodemographic, socioeconomic and health-related information, citizenship, screening for colon cancer (Haemoccult, endoscopy), and type of hospital stay insurance (basic, semiprivate, private, other). Regional availability of breast cancer screening programmes during the study period was defined as follows: cantons with long-standing programmes established before 2005, cantons who introduced a programme after 2005 and cantons without a programme [14].
For each survey year 2007 and 2012, we calculated the proportions of the female population reporting having mammography in the last 12 months, the proportion of mammography as part of a screening programme (programmatic mammography) and the proportion of screening mammography initiated by the woman or a physician (opportunistic mammography). We used univariate and multivariate logistic regression models to calculate unadjusted and adjusted odds ratios (aORs), with the following outcome variables: mammography in the last 12 months versus not done, programmatic versus non-programmatic mammography (last mammography), and opportunistic vs. all other mammography (last mammography). An interaction term with the year of survey and the variable of interest was also included. In all analyses, we used the survey weights provided by the SFSO, and reported all proportions and ORs with the corresponding 95% confidence intervals (95% CI). All analyses were performed in Stata version 15.1 (College Station, Texas, USA).
The geographical distribution of the population reporting on mammography examinations were visualized at the cantonal level (see supplementary fig. S1 in appendix 1) using ArcGIS version 10.5 (Redlands, CA, USA).
Data were de-identified before analysis. We obtained permission to analyse and publish the data through a contract with the SFSO (Ref. 624.110-1).
The frequency of women reporting any mammography in the past 12 months decreased from 19.1% (95% CI 17.7–20.5%) in 2007 to 11.6 (10.7–12.7%) in 2012 (table 1, p <0.001). The decline in self-reported mammography was more pronounced in regions with either a long-standing or no cantonal screening programme (aOR 0.5, 95% CI 0.4–0.6, and 0.5, 95% CI 0.4-0.6; supplementary table S1 in appendix 1), but remained relatively stable in regions with a recently introduced screening programme (aOR 0.9, 95% CI 0.6–1.3, p-value from test for interaction 0.01). The decline was not associated with age, regions, urban/rural setting, citizenship, education level, and hospital stay insurance (p >0.05; table S1). When the analysis was restricted to the age group of 50 to 69 years for whom breast cancer screening is recommended [14], the proportion of self-reported screening mammography (opportunistic and programmatic) was 21.2% (19.3–23.3%) in 2007 and 13.3% (12.0–14.8%) in 2012 (overall: 17.1%, 95% CI 15.9–18.3%).
Table 1 Percent of women (with 95% confidence intervals) aged 40 to 79 years reporting having undergone different types of mammography in the last 12 months in Switzerland, 2007 and 2012.
| Characteristic | 2007 | 2012 | ||||
|---|---|---|---|---|---|---|
| Any mammography | Opportunistic mammography | Programmatic mammography | Any mammography | Opportunistic mammography | Programmatic mammography | |
| Total | 19.05 (17.68–20.49) | 12.00 (10.85–13.24) | 3.10 (2.56–3.75) | 11.61 (10.65–12.64) | 6.15 (5.46–6.92) | 3.10 (2.62–3.65) |
| Age group, years | ||||||
| 40–49 | 10.97 (8.95–13.37) | 7.50 (5.74–9.74) | 0.38 (0.13–1.06) | 7.22 (5.84–8.88) | 4.23 (3.20–5.56) | 0.57 (0.32–1.02) |
| 50–59 | 24.67 (21.81–27.78) | 15.00 (12.66–17.69) | 5.65 (4.29–7.42) | 16.44 (14.26–18.88) | 7.53 (6.10–9.27) | 5.77 (4.54–7.31) |
| 60–69 | 27.61 (24.63–30.80) | 17.02 (14.57–19.79) | 5.70 (4.25–7.62) | 15.82 (13.73–18.17) | 8.74 (7.24–10.53) | 5.22 (3.96–6.87) |
| 70–79 | 14.84 (12.09–18.08) | 9.50 (7.32–12.24) | 1.04 (0.55–1.99) | 7.77 (6.08–9.87) | 4.60 (3.31–6.35) | 1.41 (0.81–2.43) |
| BMI group | ||||||
| Underweight | 17.43 (12.18–24.31) | 11.78 (7.37–18.30) | 3.81 (1.90–7.48) | 13.23 (8.39–20.25) | 7.38 (4.15–12.79) | 4.31 (1.55–11.41) |
| Normal | 18.44 (16.70–20.32) | 12.02 (10.52–13.70) | 2.65 (2.10–3.35) | 10.66 (9.54–11.91) | 5.93 (5.07–6.92) | 2.72 (2.19–3.39) |
| Overweight | 20.88 (18.12–23.95) | 12.51 (10.31–15.10) | 3.57 (2.37–5.35) | 12.73 (10.78–14.98) | 6.55 (5.18–8.25) | 3.56 (2.66–4.74) |
| Obese | 18.97 (14.83–23.94) | 10.15 (7.41–13.76) | 4.62 (2.55–8.21) | 13.13 (9.99–17.06) | 5.85 (4.12–8.23) | 3.39 (1.95–5.83) |
| Cantonal mammography screening programme* | ||||||
| None | 16.67 (15.02–18.46) | 11.87 (10.46–13.45) | 0.58 (0.25–1.31) | 8.67 (7.61–9.87) | 5.56 (4.75–6.51) | 0.46 (0.27–0.77) |
| Recently introduced | 14.08 (11.31–17.39) | 10.00 (7.58–13.07) | 1.59 (0.96–2.63) | 12.90 (10.37–15.94) | 5.13 (3.58–7.31) | 6.63 (4.81–9.06) |
| Long-standing | 29.75 (26.39–33.35) | 13.67 (11.13–16.68) | 12.05 (9.92–14.56) | 18.86 (16.54–21.43) | 8.38 (6.82–10.25) | 8.18 (6.65–10.02) |
| Setting | ||||||
| Urban | 20.13 (18.47–21.90) | 12.90 (11.51–14.44) | 3.14 (2.48–3.96) | 11.94 (10.80–13.19) | 6.54 (5.70–7.49) | 2.75 (2.24–3.36) |
| Rural | 15.89 (13.72–18.34) | 9.37 (7.62–11.46) | 3.00 (2.23–4.03) | 10.69 (9.05–12.58) | 5.09 (4.04–6.40) | 4.06 (3.02–5.43) |
| Citizenship | ||||||
| Swiss | 18.82 (17.51–20.21) | 11.94 (10.83–13.15) | 2.90 (2.47–3.41) | 11.27 (10.34–12.28) | 5.97 (5.29–6.74) | 3.25 (2.75–3.84) |
| Non–Swiss | 20.44 (15.43–26.56) | 12.37 (8.43–17.78) | 4.29 (2.12–8.48) | 13.18 (10.18–16.90) | 6.98 (4.96–9.75) | 2.39 (1.30–4.34) |
| Education level | ||||||
| Primary | 19.34 (15.95–23.25) | 11.02 (8.55–14.09) | 4.55 (2.71–7.53) | 12.81 (10.23–15.92) | 6.37 (4.71–8.56) | 3.55 (2.41–5.20) |
| Profession | 18.28 (16.61–20.07) | 11.63 (10.22–13.22) | 2.76 (2.20–3.45) | 11.29 (10.09–12.61) | 6.65 (5.72–7.73) | 2.66 (2.11–3.36) |
| Secondary | 25.05 (17.52–34–47) | 16.02 (9.68–25.34) | 4.94 (2.54–9.41) | 13.91 (10.46–18.27) | 6.04 (3.94–9.13) | 5.08 (3.01–8.43) |
| Tertiary | 20.12 (16.93–23.74) | 13.21 (10.55–16.42) | 2.64 (1.69–4.11) | 10.53 (8.63–12.78) | 4.92 (3.66–6.59) | 2.95 (2.07–4.17) |
| Smoking | ||||||
| Never smoked | 19.33 (17.42–21.40) | 12.25 (10.67–14.03) | 3.32 (2.50–4.40) | 10.33 (9.13–11.66) | 5.51 (4.66–6.52) | 2.80 (2.21–3.53) |
| Past smoker | 20.86 (18.17–23.83) | 12.17 (10.01–14.72) | 3.71 (2.82–4.88) | 14.72 (12.50–17.26) | 7.46 (5.98–9.28) | 3.66 (2.62–5.11) |
| Current smoker | 16.16 (13.64–19.05) | 11.10 (8.91–13.75) | 1.79 (1.20–2.67) | 11.53 (9.62–13.75) | 6.36 (4.93–8.18) | 3.24 (2.31–4.53) |
| Self–reported health status | ||||||
| Very good | 18.14 (15.17–21.54) | 12.78 (10.22–15.86) | 2.50 (1.72–3.61) | 11.01 (9.46–12.78) | 6.80 (5.59–8.25) | 2.61 (1.88–3.62) |
| Good | 18.47 (16.81–20.24) | 11.86 (10.46–13.42) | 3.11 (2.48–3.89) | 10.26 (9.04–11.64) | 5.57 (4.64–6.67) | 2.72 (2.17–3.40) |
| Moderate | 20.00 (16.28–24.33) | 10.43 (7.86–13.72) | 4.05 (2.18–7.43) | 14.59 (11.87–17.80) | 6.12 (4.58–8.14) | 4.67 (3.18–6.80) |
| Bad | 24.93 (17.11–34.82) | 13.53 (7.55–23.07) | 1.73 (0.56–5.25) | 18.60 (12.78–26.26) | 9.27 (5.14–16.15) | 5.10 (2.48–10.18) |
| Very bad | 61.76 (36.00–82.26) | 32.64 (10.32–67.10) | 8.54 (1.98–30.14) | 23.55 (7.85–52.71) | 0 | 2.73 (0.65–10.80) |
| Haemoccult screening† | ||||||
| Yes | 20.60 (18.05–23.41) | 14.33 (12.07–16.94) | 2.67 (1.93–3.69) | 13.75 (11.75–16.04) | 7.25 (5.89–8.90) | 3.53 (2.53–4.91) |
| No | 18.34 (16.74–20.07) | 10.96 (9.67–12.40) | 3.27 (2.59–4.13) | 10.92 (9.83–12.11) | 5.79 (5.00–6.69) | 2.97 (2.44–3.60) |
| Endoscopy screening† | ||||||
| Yes | 24.42 (21.55–27.53) | 15.44 (13.04–18.18) | 3.73 (2.76–5.03) | 14.94 (13.07–17.03) | 8.05 (6.71–9.64) | 3.63 (2.70–4.87) |
| No | 17.42 (15.88–19.08) | 10.95 (9.67–12.38) | 2.92 (2.29–3.70) | 9.95 (8.88–11.13) | 5.20 (4.44–6.08) | 2.84 (2.33–3.46) |
| Hospital stay insurance | ||||||
| Basic | 16.78 (15.05–18.66) | 9.79 (8.40–11.38) | 3.35 (2.59–4.33) | 10.84 (9.66–12.14) | 5.29 (4.50–6.22) | 3.28 (2.66–4.04) |
| Semiprivate | 20.25 (17.67–23.10) | 13.84 (11.63–16.39) | 2.20 (1.45–3.32) | 14.10 (12.02–16.46) | 8.25 (6.64–10.20) | 2.74 (2.00–3.75) |
| Private | 26.36 (22.30–30.86) | 17.44 (14.08–21.40) | 3.99 (2.65–5.96) | 11.63 (8.98–14.93) | 7.09 (5.18–9.63) | 2.90 (1.56–5.32) |
| Other | 22.06 (10.04–41.78) | 11.84 (4.13–29.50) | 2.56 (0.62–9.97) | 6.47 (3.18–12.71) | 4.07 (1.72–9.34) | 1.11 (0.28–4.40) |
BMI = body mass index; OR = odds ratio Any mammography: mammography in the last 12 months; opportunistic mammography: screening mammography without clinical symptoms; programmatic mammography: mammography initiated by a systematic cancer screening programme. The category “mammography for other reasons” (diagnostic workup, follow-up) is not shown. * Recently introduced programmes: Neuchatel, Jura, Thurgau, St. Gallen, Graubünden; long-standing programmes: Fribourg, Waadt, Wallis, Genf † Ever in life
Both in 2007 and 2012, the proportion of women with any self-reported mammography was higher in the age group of 50 to 70 years, in women with secondary/tertiary education, past smokers, women with a bad / very bad self-reported health status, women who also had a screening for colorectal cancer (Haemoccult and endoscopy), and women with private/semiprivate hospital stay insurance (table 1). We also observed regional differences: the French-speaking area and the southern part of Switzerland had a higher rate of self-reported mammography, as did regions with a long-standing cantonal screening programme. A lower rate of self-reported mammography was observed in the German-speaking area of Switzerland and in regions with no or recently introduced screening programmes. The regional differences in the use of any mammography in the last 12 months are shown in figure 1, and the use of opportunistic and programmatic mammography in supplementary figure S2.
Figure 1 Geographical distribution of self-reported mammography in the last 12 months (percentage of population) in women aged 40-79 years in Switzerland, 2007 and 2012.
Opportunistic screening mammography in the last 12 months dropped from 12.0% (95% CI 10.9–13.2%) in 2007 to 6.2% (95% CI 5.5–6.9%; p<0.001) in 2012, whereas the use of programmatic screening mammography remained stable (3.1 and 3.1%, p = 0.99; table 1). The use of mammography for other reasons (diagnostic workup, follow-up) decreased slightly, from 4.0% (95% CI 3.3–4.7%) in 2007 to 2.4% (95% CI 1.9–2.9%; p <0.001). Opportunistic and programmatic mammography were mainly performed in the age group 50 to 70 years, and in regions with a long-standing breast cancer screening programme in place.
The decline in opportunistic screening was similar in regions with or without a screening programme, but programmatic screening declined in regions with a long-standing programme (aOR 0.6, 95% CI 2.4–8.4) and increased in regions with a recently introduced programme (aOR 4.5, 95% CI 2.6–15.7; supplementary table S1 in appendix 1). The decline in opportunistic and programmatic mammography was not associated with patient or health system-relevant factors (p-value from test for interaction >0.1).
The proportion of opportunistic screening mammography among all self-reported mammography decreased between 2007 and 2012 (from 63.0 to 53.0%), whereas the proportion of programmatic mammography increased (from 16.3 to 26.7%); the proportion of mammography for other reasons remained stable (20.7 and 20.3% in 2007 and 2012, respectively).
As shown in table 2, having undergone any mammography in the last 12 months was associated with the age group 50 to 69 years, very bad self-reported health status, having undergone colorectal cancer screening with endoscopy, private and semiprivate hospital stay insurance. Use of mammography was also less likely in 2012 (aOR 0.5, 95% CI 0.5–0.6) than in 2007. There was no association with non-Swiss citizenship or educational level (table 2).
Table 2 Associations of having undergone mammography in the last 12 months with sociodemographic characteristics and health-related factors (as compared with no mammography performed) in women aged 40 to 79 years in Switzerland, 2007 and 2012.
| Characteristic | Mammography vs no mammography in the last 12 months | |||
|---|---|---|---|---|
|
Unadjusted OR
(95% CI) |
p-value |
Adjusted OR
(95% CI) |
p-value | |
| Year of survey | <0.001 | <0.001 | ||
| 2007 | 1 | 1 | ||
| 2012 | 0.56 (0.49–0.64) | 0.52 (0.45–0.60) | ||
| Age group, years | <0.001 | <0.001 | ||
| 40–49 | 0.39 (0.32–0.47) | 0.42 (0.35–0.52) | ||
| 50–59 | 1 | 1 | ||
| 60–69 | 1.07 (0.91–1.25) | 0.99 (0.83–1.17) | ||
| 70–79 | 0.48 (0.39–0.59) | 0.44 (0.35–0.55) | ||
| BMI group | 0.25 | 0.16 | ||
| Underweight | 1.06 (0.76–1.49) | 1.08 (0.76–1.55) | ||
| Normal | 1 | 1 | ||
| Overweight | 1.17 (1.00–1.37) | 1.17 (0.99–1.38) | ||
| Obese | 1.09 (0.87–1.38) | 1.11 (0.87–1.41) | ||
| Cantonal mammography screening programme* | <0.001 | <0.001 | ||
| None | 1 | 1 | ||
| Recently introduced | 1.09 (0.89–1.33) | 1.21 (0.98–1.49) | ||
| Long-standing | 2.17 (1.88–2.52) | 2.27 (1.93–2.66) | ||
| Setting | 0.003 | 0.080 | ||
| Urban | 1 | 1 | ||
| Rural | 0.80 (0.69–0.93) | 0.87 (074–1.02) | ||
| Citizenship | 0.39 | 0.39 | ||
| Swiss | 1 | 1 | ||
| Non-Swiss | 1.11 (0.88–1.40) | 1.12 (0.86–1.45) | ||
| Education level | 0.68 | 0.79 | ||
| Primary | 1 | 1 | ||
| Profession | 0.93 (0.77–1.13) | 1.00 (0.82–1.24) | ||
| Secondary | 0.93 (0.77–1.13) | 1.13 (0.81–1.58) | ||
| Tertiary | 0.92 (0.73–1.16) | 0.96 (0.75–1.24) | ||
| Smoking | 0.003 | 0.12 | ||
| Never smoked | 1 | 1 | ||
| Past smoker | 1.25 (1.07–1.47) | 1.11 (0.94–1.31) | ||
| Current smoker | 0.92 (0.78–1.09) | 0.93 (0.75–1.08) | ||
| Self-reported health status | <0.001 | 0.008 | ||
| Very good | 1 | 1 | ||
| Good | 1.14 (0.98–1.34) | 0.96 (0.81–1.15) | ||
| Moderate | 1.32 (1.06–1.64) | 1.16 (0.91–1.47) | ||
| Bad | 1.82 (1.28–2.59) | 1.49 (1.02–2.18) | ||
| Very bad | 4.13 (1.83–9.30) | 2.93 (1.28–6.71) | ||
| Haemoccult screening† | 0.003 | 0.34 | ||
| Yes | 1.25 (1.07–1.44) | 1.08 (0.92–1.27) | ||
| No | 1 | 1 | ||
| Endoscopy screening† | <0.001 | <0.001 | ||
| Yes | 1.44 (1.25–1.65) | 1.36 (1.17–1.59) | ||
| No | 1 | 1 | ||
| Hospital stay insurance | <0.001 | 0.007 | ||
| Basic | 1 | 1 | ||
| Semiprivate | 1.34 (1.15–1.56) | 1.25 (1.06–1.47) | ||
| Private | 1.53 (1.26–1.86) | 1.36 (1.10–1.67) | ||
| Other | 0.84 (0.45–1.56) | 0.99 (0.53–1.87) | ||
95% CI = 95% confidence interval; BMI = body mass index; OR = odds ratio Model adjusted for all variables included in the table. * Recently introduced programmes: Neuchatel, Jura, Thurgau, St. Gallen, Graubünden; long-standing programmes: Fribourg, Waadt, Wallis, Genf † Screening for colon cancer ever in life
Supplementary table S2 (appendix 1) shows the factors associated with the use of programmatic mammography. The use of programmatic mammography was more likely in regions with a recently introduced screening programme (aOR 9.3, 95% CI 5.1–17.1), and regions with a long-standing programme (aOR 24.1, 95% CI 13.4–43.5) than in other regions. Programmatic mammography was more likely in the age groups 50-69 years, and in women with a basic hospital stay insurance. Year of survey, citizenship, educational level, and having undergone a colorectal cancer screening were all not associated with programmatic mammography (table S2). A similar pattern was observed for the use of opportunistic mammography (table S3).
We analysed data from two representative, nationwide health surveys in Switzerland. We found that the self-reported use of mammography among women aged 40 to 79 years in Switzerland declined from 19% in 2007 to 12% in 2012. The use of opportunistic mammography in the last 12 months dropped from 12.0 to 6.2%, whereas the use of programmatic screening mammography remained stable at 3.1%. Proportionally, the use of programmatic screening increased. There were also regional differences in the use of mammography.
In Switzerland and other countries, mammography screening is recommended for women aged between 50 and 69 years every 2 years [2]. The reported use of mammography in the last 12 months by approximately 20% of women aged 50 to 69 years would correspond to around 40% in the recommended time interval of 2 years. This is relatively low compared with other European countries, where screening rates range from 23% in the Slovak Republic to over 80% in Portugal, Denmark, Finland and Slovenia in 2014 [15]. The European Guidelines suggest a target screening rate of >75% among eligible women aged 50 to 70 years [2]. We also found that overall the use of mammography declined from 19% in 2007 to 12% in 2012. This decline might reflect the ongoing debate about the benefits (mortality) and harms (false-positive results requiring diagnostic workup, overdiagnosis, overtreatment) of breast cancer screening [3, 5–7, 16], and the increasing emphasis that is put on ensuring informed decision making [4]. It has been shown that the level of information of the public appears to strongly influence willingness to participate in screening programmes [17]. Indeed, the positive effects of breast cancer screening were initially overestimated by women in Switzerland and elsewhere [18], but this may have changed over time to a more critical public view on breast cancer screening.
In absolute numbers, opportunistic screening mammography in the last 12 months halved between 2007 and 2012 (12 to 6%), while programmatic screening remained stable at a low level (3%) overall, but tended to decrease in regions with a long-standing programme and increase in regions with a recently introduced programme. Proportionally, programmatic screening mammography increased during the study period, while opportunistic screening decreased. These findings suggest at least a temporarily positive effect of the established cantonal screening programmes, particularly in more recently introduced programmes, but also suggests a shift from individual screening to cantonal programmes. Screening programmes as a public health measure have been established in Switzerland since 1999, starting in the cantons of Geneva, Lausanne and Valais [14]. These screening programmes were initiated on the basis of evidence from the literature, but also evaluations of systematic screening programmes in countries such as Sweden and The Netherlands [19, 20]. Potential advantages of systematic programmes over individualised opportunistic screening include better information of women about the possible benefits and harms of screening, quality control of mammography and monitoring of the diagnostic workup of suspicious mammography findings [6]. Another important advantage is that organised screening programmes in principle ensure equal access for all women. In our study, lower education level was not associated with lower participation in breast cancer screening, in contrast to a previous study using the SHIS data of 2002 [10]. This could suggest that inequities in access may have levelled off. On the other hand, women attending other cancer screening programmes and women with a private hospital stay insurance, had a higher uptake of mammography, possibly reflecting individuals with a higher health awareness [10].
In Switzerland, uptake of breast cancer screening was higher in regions with long-standing screening programmes, lower in regions where screening programmes have been recently introduced, and lowest in regions where no programme exists. Eleven cantonal screening programmes had been established up to 2012, the time of the latest survey, and these programmes covered 37% of the eligible population [14]. The regions with long-standing screening programmes correspond to the French-speaking area of the country, where a high uptake has previously been demonstrated [8, 9], whereas opportunistic screening dominates in the German-speaking area. This difference did not seem to be influenced by sociodemographic or health-related factors [9], but appears to be driven by public promotion of screening, recommendations by healthcare providers, and cultural factors, including different beliefs and attitudes. Interestingly, the decrease in the use of mammography observed in our study was more pronounced in regions with a generally higher uptake. Despite the drop in self-reported mammography screening, breast cancer mortality in Switzerland continues to decrease, probably because of improvements in treatment, as well as changes in cause-of-death coding [1, 6].
Our study is limited by the fact that self-reported mammography may not reflect the number of screened women, and the distinction between opportunistic, programmatic and diagnostic mammography might not always be accurate. However, a study from Israel showed reasonable agreement between self-reported and registered mammography [21], and a study of post-treatment mammography surveillance showed a high congruence, particularly for results in the past 7 to 12 months [22]. Moreover, a validation study from colon cancer screening also showed a good agreement between self-reporting and patient charts [23]. Finally, the SHIS is a nationwide, representative survey, and analyses were weighted and adjusted for a wide range of important sociodemographic and health-related factors.
In conclusion, uptake of breast cancer screening is low in Swiss women and decreased between 2007 and 2012. Many factors may have contributed to this decline. The ongoing debates on the usefulness of screening programmes in Switzerland [4, 7, 24, 25] and the limited evidence for breast cancer mortality reduction by screening [6], especially when uptake of mammography is low, are likely to have influenced the trend in mammography attendance and the public willingness to accept screening tests in Switzerland. The next survey round of 2017 (data available end of 2018) might show further trends. Future surveys should include additional questions to better distinguish between diagnostic, opportunistic, and programmatic mammography, as well as questions on the willingness to participate in screening programs. Our findings should be taken into consideration for future adaption of public information and implementation of cancer screening programs such as systematic screening for colorectal cancers with substantial and long-lasting benefits [26–28].
Table S1 Factors associated with the temporal change in self-reported mammography in the last 12 months in women (age 40 to 79 years) in Switzerland, 2007 and 2012.
|
Characteristic
(groups) |
Any mammography | Opportunistic screening | Programmatic screening | |||
|---|---|---|---|---|---|---|
|
Adjusted OR
(95% CI) |
p-value* |
Adjusted OR
(95% CI) |
p-value* |
Adjusted OR
(95% CI) |
p-value* | |
| Age (four age groups) | – | 0.32 | – | 0.93 | – | 0.69 |
| Setting (urban/rural) | – | 0.36 | – | 0.60 | – | 0.14 |
| Citizenship (Swiss/non-Swiss) | – | 0.51 | – | 0.46 | – | 0.22 |
| Education level (primary to tertiary) | – | 0.48 | – | 0.16 | – | 0.95 |
| Hospital stay insurance (general, semiprivate/private) | – | 0.055 | – | 0.34 | – | 0.80 |
| Cantonal mammography screening programme† | 0.012 | 0.38 | <0.001 | |||
| None | 0.47 (0.39–0.57) | – | 0.91 (0.30–2.76) | |||
| Recently introduced | 0.87 (0.61–1.26) | – | 4.50 (2.41–8.41 | |||
| Long-standing | 0.50 (0.39–0.64) | – | 0.57 (0.42–0.79) | |||
CI = confidence interval; OR = odds ratio * p-values from interaction tests † Recently introduced programmes: Neuchatel, Jura, Thurgau, St. Gallen, Graubünden; long-standing programmes: Fribourg, Waadt, Wallis, Genf Estimates derived from regression models adjusted for year of survey, age, body mass index group, setting, citizenship, education level, smoking, self-reported health status, Haemoccult/endoscopy screening, hospital stay insurance, and participation in cantonal screening program for breast cancer. An interaction with the year of survey and the variable of interest was included.
Table S2 Associations of programmatic mammography (within a systematic screening programme) with sociodemographic characteristics and health-related factors compared with all other women aged 40–79 years in Switzerland, 2007 and 2012.
| Characteristic | Women reporting programmatic mammography compared with all others | |||
|---|---|---|---|---|
|
Unadjusted OR
(95% CI) |
p–value |
Adjusted OR
(95% CI) |
p-value | |
| Year of survey | 0.99 | 0.41 | ||
| 2007 | 1 | 1 | ||
| 2012 | 1.00 (0.77–1.30) | 0.89 (0.67–1.18) | ||
| Age group, years | <0.001 | <0.001 | ||
| 40–49 | 0.08 (0.05–0.14) | 0.06 (0.03–0.12) | ||
| 50–59 | 1 | 1 | ||
| 60–69 | 0.95 (0.71–1.27) | 0.82 (0.60–1.12) | ||
| 70–79 | 0.21 (0.13–0.33) | 0.18 (0.11–0.31) | ||
| BMI group | 0.11 | 0.30 | ||
| Underweight | 1.54 (0.77–3.09) | 1.96 (0.99–3.88) | ||
| Normal | 1 | 1 | ||
| Overweight | 1.34 (0.99–1.81) | 1.19 (0.87–1.63) | ||
| Obese | 1.47 (0.94–2.30) | 1.34 (0.85–2.12) | ||
| Cantonal mammography screening programme* | <0.001 | <0.001 | ||
| None | 1 | 1 | ||
| Recently introduced | 8.73 (4.89–15.58) | 9.32 (5.09–17.06) | ||
| Long-standing | 21.16 (12.53–35.73) | 24.13 (13.39–43.50) | ||
| Setting | 0.14 | 0.53 | ||
| Urban | 1 | 1 | ||
| Rural | 1.23 (0.93–1.62) | 1.10 (0.82–1.46) | ||
| Citizenship | 0.91 | 0.82 | ||
| Swiss | 1 | 1 | ||
| Non-Swiss | 1.03 (0.62–1.71) | 1.07 (0.61–1.85) | ||
| Education level | 0.016 | 0.082 | ||
| Primary | 1 | 1 | ||
| Profession | 0.67 (0.46–0.97) | 0.93 (0.63–1.36) | ||
| Secondary | 1.28 (0.73–2.22) | 1.70 (0.97–2.97) | ||
| Tertiary | 0.70 (0.45–1.08) | 0.84 (0.53–1.34) | ||
| Smoking | 0.13 | 0.18 | ||
| Never smoked | 1 | 1 | ||
| Past smoker | 1.22 (0.91–1.64) | 0.93 (0.68–1.25) | ||
| Current smoker | 0.85 (0.61–1.19) | 0.71 (0.50–1.02) | ||
| Self-reported health status | 0.10 | 0.44 | ||
| Very good | 1 | 1 | ||
| Good | 1.14 (0.84–1.56) | 1.21 (0.87–1.68) | ||
| Moderate | 1.75 (1.14–2.70) | 1.47 (0.94–2.30) | ||
| Bad | 1.35 (0.68–2.67) | 0.91 (0.43–1.90) | ||
| Very bad | 2.00 (0.64–6.21) | 0.99 (0.25–3.92) | ||
| Haemoccult screening† | 0.99 | 0.37 | ||
| Yes | 1.00 (0.75–1.33) | 1.16 (0.84–1.62) | ||
| No | 1 | 1 | ||
| Endoscopy screening† | 0.075 | 0.88 | ||
| Yes | 1.28 (0.98–1.69) | 1.02 (0.75–1.39) | ||
| No | 1 | 1 | ||
| Hospital stay insurance | 0.12 | 0.14 | ||
| Basic | 1 | 1 | ||
| Semiprivate | 0.74 (0.54–1.00) | 0.68 (0.48–0.95) | ||
| Private | 1.05 (0.70–1.56) | 0.95 (0.61–1.47) | ||
| Other | 0.47 (0.17–1.30) | 0.66 (0.22–2.01) | ||
BMI = body mass index; CI = confidence interval; OR = odds ratio Model adjusted for all variables included in the table. * Recently introduced programmes: Neuchatel, Jura, Thurgau, St. Gallen, Graubünden; long-standing programmes: Fribourg, Waadt, Wallis, Genf † Screening for colon cancer ever in life
Table S3 Associations of opportunistic mammography (screening without clinical symptoms) with sociodemographic characteristics and health-related factors compared with all other women aged 40–79 years in Switzerland, 2007 and 2012.
| Characteristic | Women reporting opportunistic mammography compared with all others | |||
|---|---|---|---|---|
|
Unadjusted OR
(95% CI) |
p-value |
Adjusted OR
(95% CI) |
p-value | |
| Year of survey | <0.001 | <0.001 | ||
| 2007 | 1 | 1 | ||
| 2012 | 0.48 (0.41–0.57) | 0.48 (0.40–0.58) | ||
| Age group, years | <0.001 | <0.001 | ||
| 40–49 | 0.49 (0.38–0.63) | 0.55 (0.43–0.71) | ||
| 50–59 | 1 | 1 | ||
| 60–69 | 1.16 (0.95–1.43) | 1.10 (0.89–1.36) | ||
| 70–79 | 0.58 (0.45–0.76) | 0.53 (0.40–0.71) | ||
| BMI group | 0.55 | 0.53 | ||
| Underweight | 1.07 (0.71–1.61) | 1.04 (0.67–1.60) | ||
| Normal | 1 | 1 | ||
| Overweight | 1.05 (0.86–1.28) | 1.10 (0.89–1.36) | ||
| Obese | 0.85 (0.65–1.12) | 0.93 (0.69–1.27) | ||
| Cantonal mammography screening programme* | 0.008 | 0.042 | ||
| None | 1 | 1 | ||
| Recently introduced | 0.85 (0.65–1.10) | 0.94 (0.72–1.24) | ||
| Long-standing | 1.28 (1.05–1.56) | 1.28 (1.04–1.58) | ||
| Setting | 0.001 | 0.045 | ||
| Urban | 1 | 1 | ||
| Rural | 0.72 (0.59–0.87) | 0.81 (0.67–1.0) | ||
| Citizenship | 0.73 | 0.58 | ||
| Swiss | 1 | 1 | ||
| Non-Swiss | 1.05 (0.78–1.42) | 1.10 (0.79–1.54) | ||
| Education level | 0.81 | 0.65 | ||
| Primary | 1 | 1 | ||
| Profession | 1.10 (0.86–1.39) | 1.0 (0.77–1.31) | ||
| Secondary | 1.01 (0.67–1.53) | 0.82 (0.53–1.26) | ||
| Tertiary | 1.01 (0.76–1.35) | 0.90 (0.65–1.25) | ||
| Smoking | 0.40 | 0.99 | ||
| Never smoked | 1 | 1 | ||
| Past smoker | 1.13 (0.92–1.38) | 1.0 (0.82–1.23) | ||
| Current smoker | 0.97 (0.78–1.20) | 1.0 (0.79–1.26) | ||
| Self-reported health status | 0.46 | 0.30 | ||
| Very good | 1 | 1 | ||
| Good | 1.06 (0.87–1.29) | 0.84 (0.68–1.04) | ||
| Moderate | 0.90 (0.68–1.17) | 0.78 (0.57–1.07) | ||
| Bad | 1.35 (0.83–2.20) | 1.13 (0.68–1.90) | ||
| Very bad | 1.56 (0.40–6.07) | 1.27 (0.36–4.54) | ||
| Haemoccult screening† | 0.001 | 0.22 | ||
| Yes | 1.37 (1.14–1.65) | 1.14 (0.93–1.39) | ||
| No | 1 | 1 | ||
| Endoscopy screening† | <0.001 | 0.001 | ||
| Yes | 1.39 (1.17–1.66) | 1.39 (1.15–1.68) | ||
| No | 1 | 1 | ||
| Hospital stay insurance | <0.001 | <0.001 | ||
| Basic | 1 | 1 | ||
| Semiprivate | 1.59 (1.31–1.93) | 1.43 (1.17–1.74) | ||
| Private | 1.81 (1.43–2.29) | 1.54 (1.21–1.97) | ||
| Other | 0.90 (0.42–1.91) | 1.03 (0.49–2.18) | ||
BMI = body mass index; CI = confidence interval; OR = odds ratio Model adjusted for all variables included in the table. * Recently introduced programmes: Neuchatel, Jura, Thurgau, St. Gallen, Graubünden; long-standing programmes: Fribourg, Waadt, Wallis, Genf † Screening for colon cancer ever in life
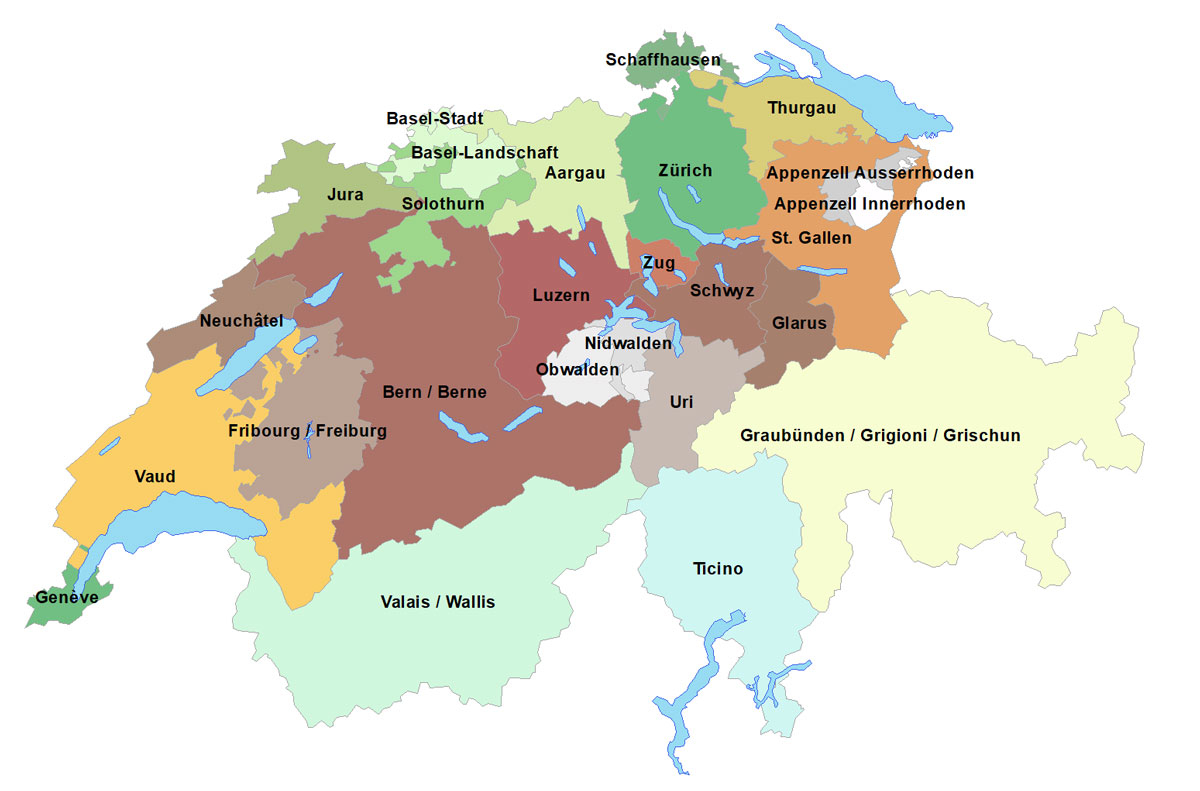
Figure S1 Geographical distribution of the cantons in Switzerland.
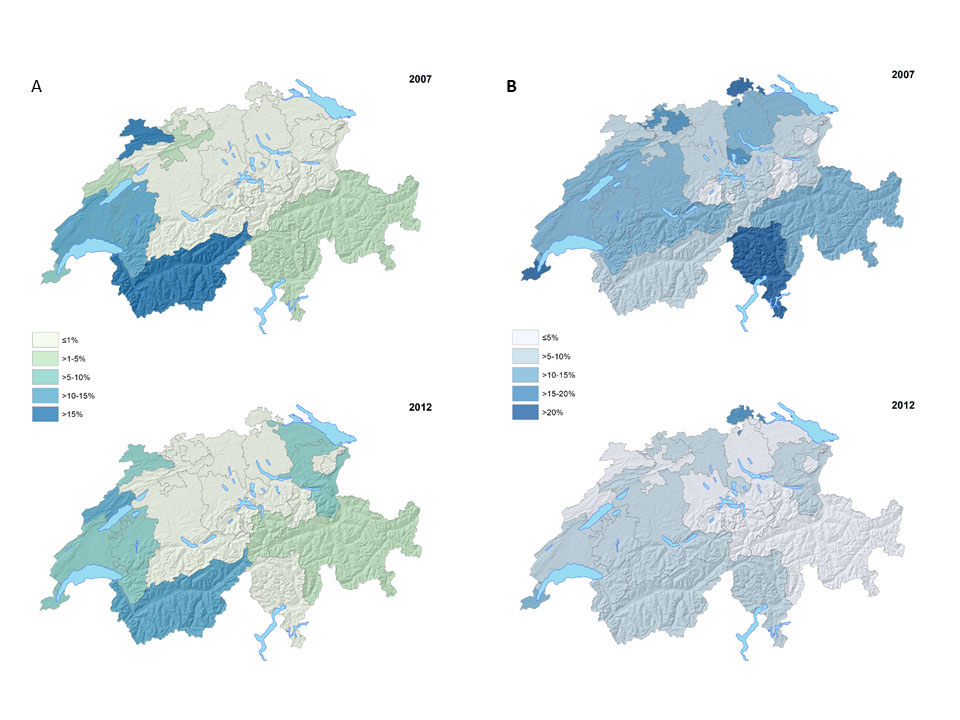
Figure S2 Geographical distribution of self-reported mammography in the last 12 months in women aged 40–79 years in Switzerland, 2007 and 2012. A. Programmatic mammography within a systematic cancer screening programme). B. Opportunistic mammography (screening mammography without clinical symptoms).
We thank the Swiss Federal Statistical Office for providing the data of the Swiss Health Survey 2007 and 2012, and the women who participated in the surveys.
No financial support and no other potential conflict of interest relevant to this article was reported.
1Office FS. Schweizerischer Krebsbericht 2015: Stand und Entwicklungen. Swiss Federal Statistical Office Available at: https://wwwbfsadminch/bfsstatic/dam/assets/350143/master. 2015.
2Perry N, Broeders M, de Wolf C, Tornberg S, Holland R, von Karsa L. European guidelines for quality assurance in breast cancer screening and diagnosis. Fourth edition--summary document. Ann Oncol. 2008;19(4):614-22.
3 Biller-Andorno N , Jüni P . Abolishing mammography screening programs? A view from the Swiss Medical Board. N Engl J Med. 2014;370(21):1965–7. doi:.https://doi.org/10.1056/NEJMp1401875
4 Vassilakos P , Catarino R , Boulvain M , Petignat P . Controversies in the mammography screening programme in Switzerland. Swiss Med Wkly. 2014;144:w13969.
5 Jüni P , Zwahlen M . It is time to initiate another breast cancer screening trial. Ann Intern Med. 2014;160(12):864–6. doi:.https://doi.org/10.7326/M14-0569
6 Zwahlen M , Bopp M , Probst-Hensch NM . Mammography screening in Switzerland: limited evidence from limited data. Swiss Med Wkly. 2004;134(21-22):295–306.
7Swiss Medical Board. Systematic mammography screening. Swiss Medical Board Reports Available at: http://wwwmedical-boardch/fileadmin/docs/public/mb/Fachberichte/2013-12-15_Bericht_Mammographie_Final_Kurzfassung_epdf. 2013.
8 Wanner P , Raymond L , Bouchardy C . Geographical disparities in self-reported use of mammography and breast self-examination according to the Swiss Health Survey. Ann Oncol. 2001;12(4):573–4. doi:.https://doi.org/10.1023/A:1011147027410
9 Eichholzer M , Richard A , Rohrmann S , Schmid SM , Leo C , Huang DJ , et al. Breast cancer screening attendance in two Swiss regions dominated by opportunistic or organized screening. BMC Health Serv Res. 2016;16(1):519. doi:.https://doi.org/10.1186/s12913-016-1760-4
10 Fontana M , Bischoff A . Uptake of breast cancer screening measures among immigrant and Swiss women in Switzerland. Swiss Med Wkly. 2008;138(49-50):752–8.
11Kramis K, Ruckstuhl B, Wyler M. "Nationale Strategie gegen Krebs 2014 –2017". Available at: https://wwwkrebsligach/ueber-uns/netzwerk/die-nationale-strategie-gegen-krebs-nsk/-dl-/fileadmin/images/ueber-uns/bericht-nationale-strategie-gegen-krebspdf. 2013.
12 Burton-Jeangros C , Cullati S , Manor O , Courvoisier DS , Bouchardy C , Guessous I . Cervical cancer screening in Switzerland: cross-sectional trends (1992-2012) in social inequalities. Eur J Public Health. 2017;27(1):167–73.
13 Spaeth A , Zwahlen M . Use of lower gastrointestinal endoscopy and fecal occult blood test in the 2007 Swiss Health Interview Survey respondents aged 50 years and older. Endoscopy. 2013;45(7):560–6. doi:.https://doi.org/10.1055/s-0032-1326636
14Screening SC. Monitoring Report 2012 der Schweizer Brustkrebsfrüherkennungsprogramme – eine kurze Bilanz. Available at: https://wwwswisscancerscreeningch/fileadmin/user_upload/Documents/SwissCancerScreening/WWW/Editors/Downloads/Brustkrebs/Downloads_Fachinformationen_Brustkrebs/Monitoring/160317_Monitoring-Report_2012_d_Gesamtdokumentpdf. 2012.
15OECD. Screening, survival and mortality for breast cancer. in: Health at a Glance: Europe 2012, OECD Publishing. 2012.
16 Zwahlen M , Low N , Borisch B , Egger M , Künzli N , Obrist R , et al. Population based screening - the difficulty of how to do more good than harm and how to achieve it. Swiss Med Wkly. 2010;140:w13061. doi:10.4414/smw.2010.13061.
17 Domenighetti G , Grilli R , Maggi JR . Does provision of an evidence-based information change public willingness to accept screening tests? Health Expect. 2000;3(2):145–50. doi:.https://doi.org/10.1046/j.1369-6513.2000.00081.x
18 Domenighetti G , D’Avanzo B , Egger M , Berrino F , Perneger T , Mosconi P , et al. Women’s perception of the benefits of mammography screening: population-based survey in four countries. Int J Epidemiol. 2003;32(5):816–21. doi:.https://doi.org/10.1093/ije/dyg257
19 Independent UK Panel on Breast Cancer Screening. The benefits and harms of breast cancer screening: an independent review. Lancet. 2012;380(9855):1778–86. doi:.https://doi.org/10.1016/S0140-6736(12)61611-0
20 Otten JD , Broeders MJ , Fracheboud J , Otto SJ , de Koning HJ , Verbeek AL . Impressive time-related influence of the Dutch screening programme on breast cancer incidence and mortality, 1975-2006. Int J Cancer. 2008;123(8):1929–34. doi:.https://doi.org/10.1002/ijc.23736
21 Baron-Epel O , Friedman N , Lernau O . Validity of self-reported mammography in a multicultural population in Israel. Prev Med. 2008;46(6):489–91. doi:.https://doi.org/10.1016/j.ypmed.2008.03.003
22 Tiro JA , Sanders JM , Shay LA , Murphy CC , A Hamann H , Bartholomew LK , et al. Validation of self-reported post-treatment mammography surveillance among breast cancer survivors by electronic medical record extraction method. Breast Cancer Res Treat. 2015;151(2):427–34.
23 Dodou D , de Winter JC . Agreement between self-reported and registered colorectal cancer screening: a meta-analysis. Eur J Cancer Care (Engl). 2015;24(3):286–98. doi:.https://doi.org/10.1111/ecc.12204
24 Marmot MG , Altman DG , Cameron DA , Dewar JA , Thompson SG , Wilcox M . The benefits and harms of breast cancer screening: an independent review. Br J Cancer. 2013;108(11):2205–40. doi:.https://doi.org/10.1038/bjc.2013.177
25 Bouchardy C , Raymond L , de Wolf C , Abel T , Ackermann-Liebrich U , Goldhirsch A , et al. Stellungnahme zur Wirksamkeit des Mammographiescreenings in der Schweiz. Schweiz Arzteztg. 2001;83(13):655–61. doi:https://doi.emh.ch/10.4414/saez.2001.08071.
26 Atkin W , Kralj-Hans I , Wardle J , Duffy S . Colorectal cancer screening. Randomised trials of flexible sigmoidoscopy. BMJ. 2010;341(aug24 3):c4618. doi:.https://doi.org/10.1136/bmj.c4618
27 Atkin WS , Edwards R , Kralj-Hans I , Wooldrage K , Hart AR , Northover JM , et al.; UK Flexible Sigmoidoscopy Trial Investigators. Once-only flexible sigmoidoscopy screening in prevention of colorectal cancer: a multicentre randomised controlled trial. Lancet. 2010;375(9726):1624–33. doi:.https://doi.org/10.1016/S0140-6736(10)60551-X
28 Marbet UA , Bauerfeind P , Brunner J , Dorta G , Valloton JJ , Delcò F . Colonoscopy is the preferred colorectal cancer screening method in a population-based program. Endoscopy. 2008;40(8):650–5. doi:.https://doi.org/10.1055/s-2008-1077350
No financial support and no other potential conflict of interest relevant to this article was reported.