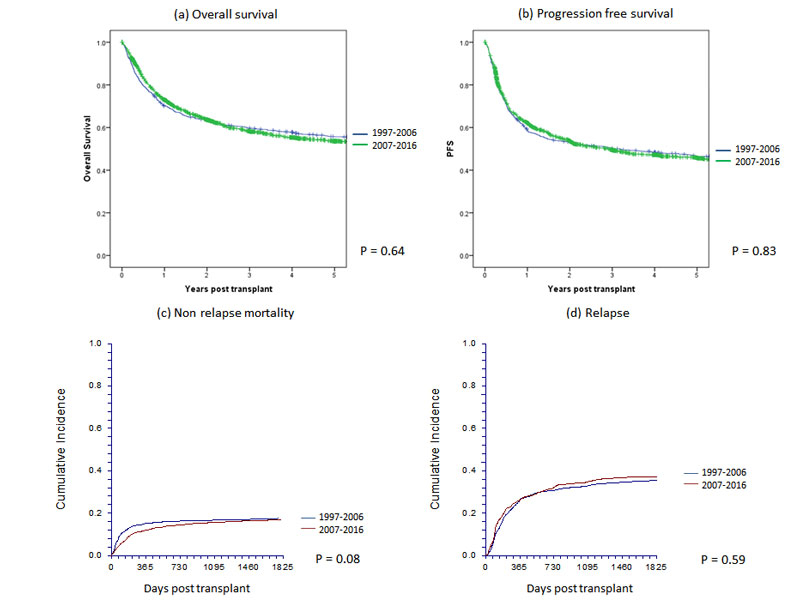
Figure 1 Main outcomes of 2781 patients with allogeneic haematopoietic cell transplants by year group in Switzerland between 1997 and 2016: (a) overall survival, (b) progression-free survival, (c) nonrelapse mortality and (d) relapse.
DOI: https://doi.org/10.4414/smw.2018.14589
Transplantation of haematopoietic stem cells (HCT) is today an established therapy and has expanded rapidly over recent decades. It is used for many severe acquired or congenital disorders of the haematopoietic system and for chemo, radio or immunosensitive malignancies. Stem cells from bone marrow, peripheral blood or cord blood are used, and may be derived from the patients themselves for autologous HCT or from siblings, other family members or unrelated donors for allogeneic HCT [1–6]. The goals of HCT are manifold. HCT can restore bone marrow function in patients with congenital deficiencies or acquired malfunction. Autologous transplants can be used to shorten the period of severe pancytopenia in the context of high-dose chemo-/radiotherapy. Allogeneic HCT provides a powerful targeted antitumour effect in the form of a graft-versus-host or graft-versus-tumour reaction in the treatment of haematological or nonhaematological malignancies. HCT can induce tolerance to donor tissue in solid organ transplantation and, last but not least, HCT can reset the ontogeny of the immune system in the treatment of autoimmune diseases [7]. HCT has a long history in Switzerland [8, 9].
HCT is a complex and cost-intensive therapeutic procedure. In Switzerland, costs of the procedure are covered by health insurance, based on the guidance of the Federal Office for Social Insurance. In this guidance diseases are listed as “established”, “in evaluation with full payment”, “in evaluation without payment” or “not established”. On the occasion of a prior revision (2002), the Federal Office requested an analysis of this therapeutic instrument and asked for an evaluation registry. In anticipation of this requirement, in 1997 the Swiss Blood Stem Cell Transplantation Group (SBST) established a central registry for all HCTs in Switzerland. As reporting is mandatory, this report includes all patients receiving an autologous or allogeneic HCT in Switzerland over the past 20 years (1997–2016) and describes changes in patient characteristics and treatment outcomes over time.
Table 1 a: Demographic characteristics and transplant technology for allogeneic haematopoietic cell transplants by decade for the years 1997–2016.
| 1997–2006 | 2007–2016 | Total | p-value | ||||
|---|---|---|---|---|---|---|---|
| n | % | n | % | n | % | ||
| Patients (first allograft) | |||||||
| No. 1st. allograft | 997 | 88.8 | 1784 | 91.8 | 2781 | 90.7 | |
| No. not 1st allograft | 126 | 11.2 | 160 | 8.2 | 286 | 9.3 | |
| Centre | 0.01 | ||||||
| 1 | 427 | 42.8 | 654 | 36.7 | 1081 | 38.9 | |
| 2 | 233 | 23.4 | 456 | 25.6 | 689 | 24.8 | |
| 3 | 236 | 23.7 | 488 | 27.4 | 724 | 26 | |
| 4 | 101 | 10.1 | 186 | 10.4 | 287 | 10.3 | |
| Disease | <0.0001 | ||||||
| Acute myeloid leukaemia | 314 | 31.5 | 651 | 36.5 | 965 | 34.7 | |
| Acute lymphoid leukaemia | 163 | 16.3 | 272 | 15.2 | 435 | 15.6 | |
| Chronic lymphocytic leukaemia | 23 | 2.3 | 54 | 3 | 77 | 2.8 | |
| Chronic myeloid leukaemia | 152 | 15.2 | 59 | 3.3 | 211 | 7.6 | |
| Combined myelodysplastic/myeloproliferative | 85 | 8.5 | 215 | 12.1 | 300 | 10.8 | |
| Myeloproliferative neoplasms | 22 | 2.2 | 93 | 5.2 | 115 | 4.1 | |
| Hodgkin’s lymphoma | 21 | 2.1 | 35 | 2 | 56 | 2 | |
| Non-Hodgkin’s lymphoma | 57 | 5.7 | 122 | 6.8 | 179 | 6.4 | |
| Plasma cell disorder | 54 | 5.4 | 113 | 6.3 | 167 | 6 | |
| Solid tumours | 8 | 0.8 | 2 | 0.1 | 10 | 0.4 | |
| Bone marrow failure | 51 | 5.1 | 59 | 3.3 | 110 | 4 | |
| Inherited disorders of metabolism | 6 | 0.6 | 17 | 1 | 23 | 0.8 | |
| Primary immune disorders | 29 | 2.9 | 57 | 3.2 | 86 | 3.1 | |
| Haemoglobinopathy | 9 | 0.9 | 18 | 1 | 27 | 1 | |
| Histiocytic disorders | 3 | 0.3 | 14 | 0.8 | 17 | 0.6 | |
| Others | 0 | 0 | 3 | 0.2 | 3 | 0.1 | |
| Disease stage at transplant | <0.0001 | ||||||
| Early | 526 | 52.8 | 919 | 51.5 | 1445 | 52 | |
| Intermediate | 229 | 23 | 530 | 29.7 | 759 | 27.3 | |
| Late | 242 | 24.3 | 335 | 18.8 | 577 | 20.7 | |
| Gender | 0.30 | ||||||
| Male | 584 | 58.6 | 1081 | 60.6 | 1665 | 59.9 | |
| Female | 413 | 41.4 | 703 | 39.4 | 1116 | 40.1 | |
| Age group | <0.0001 | ||||||
| 0–20 years | 229 | 23 | 289 | 16.2 | 518 | 18.6 | |
| 20–40 years | 300 | 30.1 | 344 | 19.3 | 644 | 23.2 | |
| 40–60 years | 413 | 41.1 | 786 | 44.1 | 1199 | 43.1 | |
| 60–70 years | 55 | 5.5 | 343 | 19.2 | 398 | 14.3 | |
| >70 years | 0 | 0 | 22 | 1.2 | 22 | 0.8 | |
| Median age (years) | 38.4 | 48.3 | 44.3 | ||||
| Age range (years | 0.15–68.7 | 0.24–74.2 | 0.15–74.2 | ||||
| Donor | <0.0001 | ||||||
| HLA identical sibling | 586 | 58.8 | 653 | 36.6 | 1239 | 44.6 | |
| Twin | 17 | 1.7 | 9 | 0.5 | 26 | 0.9 | |
| Other relative | 93 | 9.3 | 120 | 6.7 | 213 | 7.7 | |
| Unrelated | 301 | 30.2 | 1002 | 56.2 | 1303 | 46.9 | |
| Stem cell source | <0.0001 | ||||||
| Bone marrow | 304 | 30.5 | 302 | 16.9 | 606 | 21.8 | |
| Peripheral blood | 679 | 68.1 | 1417 | 79.4 | 2096 | 75.4 | |
| Cord blood | 14 | 1.4 | 65 | 3.6 | 79 | 2.8 | |
| Risk score | <0.0001 | ||||||
| 0–1 | 158 | 15.8 | 166 | 9.3 | 324 | 11.7 | |
| 2–3 | 471 | 47.2 | 810 | 45.4 | 1281 | 46.1 | |
| 4–5 | 326 | 32.7 | 676 | 37.9 | 1002 | 36 | |
| 6–7 | 42 | 4.2 | 132 | 7.4 | 174 | 6.3 | |
| Comorbidities | |||||||
| Yes | Data not collected | – | 631 | 35.4 | 631 | 35.4 | |
| No | – | 601 | 33.7 | 601 | 33.7 | ||
| Missing | – | 552 | 30.9 | 552 | 30.9 | ||
| Cytomegalovirus status (donor-recipient) | 0.16 | ||||||
| Neg-neg | 201 | 34.4 | 555 | 32.4 | 756 | 32.9 | |
| Pos-neg | 87 | 14.9 | 215 | 12.5 | 302 | 13.1 | |
| Pos-pos | 195 | 33.4 | 588 | 34.3 | 783 | 34.1 | |
| Neg-pos | 101 | 17.3 | 357 | 20.8 | 458 | 19.9 | |
| Sex match (donor-recipient) | 0.74 | ||||||
| Male-male | 366 | 36.9 | 684 | 38.4 | 1050 | 37.8 | |
| Female-male | 217 | 21.9 | 396 | 64.6 | 613 | 22.1 | |
| Male-female | 212 | 21.3 | 352 | 19.7 | 564 | 20.3 | |
| Female-female | 198 | 19.9 | 351 | 19.7 | 549 | 19.8 | |
| Conditioning | <0.0001 | ||||||
| Non-myeloablative | 214 | 26.1 | 704 | 39.6 | 918 | 35.3 | |
| Myeloablative | 607 | 73.9 | 1075 | 60.4 | 1682 | 64.7 | |
| Total body irradiation | <0.0001 | ||||||
| No | 382 | 39.1 | 1151 | 64.7 | 1533 | 55.6 | |
| Yes | 595 | 60.9 | 629 | 35.3 | 1224 | 44.4 | |
| T-cell depletion (in vivo or in vitro) | <0.0001 | ||||||
| No | 683 | 68.5 | 651 | 36.5 | 1334 | 48 | |
| Yes | 314 | 31.5 | 1133 | 63.5 | 1447 | 52 | |
Table 1b Demographic characteristics and transplant technology for autologous haematopoietic cell transplants by decade for the years 1997–2016.
| 1997-2006 | 2007-2016 | Total | p-value | ||||
|---|---|---|---|---|---|---|---|
| n | % | n | % | n | % | ||
| Patients (first autograft) | |||||||
| No. 1st autograft | 2042 | 75.9 | 3076 | 81.8 | 5118 | 79.4 | |
| No. not 1st autograft | 647 | 24.1 | 683 | 18.2 | 1330 | 20.6 | |
| Centre | <0.0001 | ||||||
| 1 | 170 | 8.3 | 251 | 8.2 | 421 | 8.2 | |
| 2 | 217 | 10.6 | 306 | 9.98 | 523 | 10.2 | |
| 3 | 124 | 6.1 | 142 | 4.6 | 266 | 5.2 | |
| 4 | 347 | 17 | 861 | 28 | 1208 | 23.6 | |
| 5 | 18 | 0.9 | 1 | 0 | 19 | 0.4 | |
| 6 | 575 | 28.2 | 592 | 19.2 | 1167 | 22.8 | |
| 7 | 135 | 6.6 | 206 | 6.7 | 341 | 6.7 | |
| 8 | 418 | 20.5 | 651 | 21.2 | 1069 | 20.9 | |
| 9 | 38 | 1.9 | 36 | 1.2 | 74 | 1.4 | |
| 10 | 0 | 0 | 30 | 1 | 30 | 0.6 | |
| Disease | <0.0001 | ||||||
| Acute myeloid leukaemia | 145 | 7.1 | 182 | 5.9 | 327 | 6.4 | |
| Acute lymphoid leukaemia | 55 | 2.7 | 18 | 0.6 | 73 | 1.4 | |
| Chronic lymphocytic leukaemia | 18 | 0.9 | 4 | 0.1 | 22 | 0.4 | |
| Chronic myeloid leukaemia | 12 | 0.6 | 0 | 0 | 12 | 0.2 | |
| Combined myelodysplastic/myeloproliferative | 15 | 0.7 | 5 | 0.2 | 20 | 0.4 | |
| Hodgkin’s lymphoma | 179 | 8.8 | 166 | 5.4 | 345 | 6.7 | |
| Non-Hodgkin’s lymphoma | 577 | 28.3 | 963 | 31.3 | 1540 | 30.1 | |
| Plasma cell disorder | 704 | 34.5 | 1486 | 48.3 | 2190 | 42.8 | |
| Solid tumours | 328 | 16.1 | 237 | 7.7 | 565 | 11 | |
| Autoimmune disorders | 9 | 0.4 | 15 | 0.5 | 24 | 0.4 | |
| Disease stage at transplant | <0.0001 | ||||||
| Early | 862 | 42.2 | 1433 | 46.6 | 2295 | 44.8 | |
| Intermediate | 448 | 21.9 | 1137 | 37 | 1585 | 31 | |
| Late | 732 | 35.8 | 506 | 16.4 | 1238 | 24.2 | |
| Gender | 0.25 | ||||||
| Male | 1254 | 61.4 | 1938 | 63 | 3192 | 62.4 | |
| Female | 788 | 38.6 | 1138 | 37 | 1926 | 37.9 | |
| Age group | <0.0001 | ||||||
| 0–20 years | 147 | 7.2 | 154 | 5 | 301 | 5.9 | |
| 20–40 years | 427 | 20.9 | 356 | 11.6 | 783 | 15.3 | |
| 40–60 years | 1083 | 53 | 1425 | 46.3 | 2508 | 49 | |
| 60–70 years | 371 | 18.2 | 1052 | 34.2 | 1423 | 27.8 | |
| >70 years | 14 | 0.7 | 89 | 2.9 | 103 | 2 | |
| Median age (years) | 50.8 | 56.4 | 54.3 | ||||
| Age range (years | 0.65–76.5 | 0.64–77.5 | 0.64–77.5 | ||||
| Stem cell source | 0.02 | ||||||
| Bone marrow | 14 | 0.7 | 8 | 0.3 | 22 | 0.4 | |
| Peripheral blood | 2028 | 99.3 | 3068 | 99.7 | 5096 | 99.6 | |
| Cord blood | 0 | 0 | 0 | 0 | 0 | 0 | |
| Risk score | <0.0001 | ||||||
| 0–1 | 99 | 4.8 | 119 | 3.9 | 218 | 4.3 | |
| 2–3 | 1249 | 61.2 | 2295 | 74.6 | 3544 | 69.2 | |
| 4–5 | 694 | 34 | 662 | 21.5 | 1356 | 26.5 | |
| Comorbidities | |||||||
| Yes | Data not collected | – | 209 | 6.8 | 209 | 6.8 | |
| No | – | 361 | 11.7 | 361 | 11.7 | ||
| Missing | – | 2506 | 81.5 | 2506 | 81.5 | ||
In accordance with and in preparation for the Swiss transplant law, from 1997 data relating to all HCTs performed in Switzerland were collected. Data collection is based on the Minimal Essential Data sets (Med-A) of the European Society for Blood and Marrow Transplantation (EBMT). Patient data are updated annually. All patients receiving a transplant between 1 January 1997 and 31 December 2016 were included in this analysis. The data cut-off date was 31 July 2017, giving a minimum follow up of 6 months for all patients. Median follow-up for all allograft recipients was 4.4 years (quartiles 1.6–9.2) and for autografts was 3.7 years (1.1–7.4).
HCT was defined according to the criteria of the EBMT [10]. An HCT is the infusion of haematopoietic stem cells given with the intention to replace the pretransplant haematopoietic system of the recipient. Patient-related outcomes are reported. Some patients received more than one transplant and these are described for characteristics where the focus is on procedures.
A retransplant was defined as HCT given after a previous (either autologous or allogeneic) HCT, for the treatment of relapse or rejection. Multiple transplants are defined as subsequent infusions of stem cells in the context of planned double or triple transplant protocols.
HCT was performed during the defined observation period in Aarau (Kantonsspital), Basel (University Hospitals), Bellinzona (Kantonsspital), Berne (University Hospital), Geneva (University Hospital), Lausanne (University Hospital), St. Gallen (Kantonsspital) and Zurich (University Hospital, University Children’s Hospital and the Hirslanden Clinic). Allogeneic HCTs were restricted to Basel, Geneva, Zurich University Hospital and Zurich University Children’s Hospital; autologous transplants were performed at all centres. Since 1997, autologous HCTs in the French-speaking part of Switzerland were performed primarily in Lausanne, allogeneic HCTs primarily in Geneva. Paediatric transplants were performed in Basel (allogeneic and autologous), Berne (autologous), Geneva (allogeneic and autologous), Lausanne (autologous) and Zurich (allogeneic and autologous).
All teams were required to have ethics committee approval of data collection, and all patients or their legal representatives gave written informed consent before the transplant.
Descriptive statistics included median and range for continuous variables and frequencies for categorical variables. As the observation period covered 20 years, we used the first and second decade of the registry to compare changes in the use of technology, indications and outcomes over time. Comparison among groups was by use of the Kruskal-Wallis test for continuous variables and the chi-squared test for categorical variables. Transplant rates were calculated as number of allogeneic and autologous HCTs corrected per 1 million inhabitants per year for each of the decades, accounting for population growth in Switzerland.
Outcomes measured were overall survival and progression-free survival, determined as the Kaplan-Meier estimates, and nonrelapse mortality and relapse incidence determined from cumulative incidence curves adjusted for competing risks as appropriate. For overall survival, death was the event, for progression-free survival it was time to relapse of the original disease or death measured from the time of transplant. Nonrelapse mortality was defined as death without relapse. Groups were compared using the log-rank test for the Kaplan-Meier estimates and Fine and Gray for cumulative incidence. A p-value of ≤0.05 was considered to be statistically significant.
Multivariate models were constructed using the Cox regression model or the competing risk model as appropriate [11]. All variables detailed in tables 1 and 2 (see “Results”) were included in the model and removed by backward selection. Only variables with p ≤0.05 were retained. Decade was the variable of interest and therefore forced into each of the models. A Cox regression model was used for overall and progression-free survival, whereas the model of Fine and Gray was used, because of competing risks, for nonrelapse mortality and relapse. Models of allogeneic HCT were stratified by centre because of a significant centre effect (not the objective of this analysis). Comorbid conditions were those conditions that are likely to affect the outcome of the transplant but may not be directly related to the indication for transplant. This information was not available for the majority of patients and is therefore not included in the models. None of the variables tested violated the proportionality assumption, and there were no first-order interactions.
Table 2 a: Univariate analysis of overall and progression-free survival for allogeneic haematopoietic cell transplants by decade for the years 1997–2016.
| 1997–2006 | 2007–2016 | |||||||
|---|---|---|---|---|---|---|---|---|
| Overall survival at 5 years | p-value | Progression-free survival at 5 years | p-value | Overall survival at 5 years | p-value | Progression-free survival at 5 years | p-value | |
| Patients receiving first allograft (n) | 997 | 997 | 1784 | 1784 | ||||
| 56% (53–59%) | 47% (44–50%) | 54% (51–57%) | 46% (43–49%) | |||||
| Disease | <0.0001 | <0.0001 | <0.0001 | <0.0001 | ||||
| Acute myeloid leukaemia | 48% (42–54%) | 46% (40–52%) | 47% (42–52%) | 45% (44–58%) | ||||
| Acute lymphoid leukaemia | 47% (39–55%) | 42% (34–50%) | 64% (57–71%) | 51% (34–50%) | ||||
| Chronic lymphocytic leukaemia | 65% (45–85%) | 57% (37–77%) | 56% (40–72%) | 42% (28–56%) | ||||
| Chronic myeloid leukaemia | 76% (69–83%) | 55% (47–63%) | 61% (46–76%) | 51% (35–67%) | ||||
| Combined myelodysplastic/myeloproliferative | 41% (30–52%) | 35% (25–45%) | 50% (42–58%) | 41% (33–49%) | ||||
| Myeloproliferative neoplasms | 59% (38–80%) | 46% (25–67%) | 61% (48–74%) | 49% (36–62%) | ||||
| Hodgkin’s lymphoma | 55% (33–77%) | 21% (2–40%) | 42% (22–62%) | 33% (14–52%) | ||||
| Non-Hodgkin’s lymphoma | 63% (50–76%) | 49% (36–62%) | 56% (46–66%) | 46% (35–57%) | ||||
| Plasma cell disorder | 48% (34–62%) | 28% 16–40%) | 34% (24–44%) | 19% (11–27%) | ||||
| Solid tumours | 0% | 0% | 50% (0–100%) | 0% | ||||
| Bone marrow failure | 77% (65–89%) | 77% (65–89%) | 68% (54–82%) | 69% (55–83%) | ||||
| Inherited disorders of metabolism | 100% | 50% (10–90%) | 83% (63–100%) | 75% (50–100%) | ||||
| Primary immune disorders | 79% (64–94%) | 70% (57–87%) | 83% (70–96%) | 71% (55–87%) | ||||
| Haemoglobinopathy | 89% (69–100%) | 89% (69–100%) | 100% | 94% (82–100%) | ||||
| Histiocytic disorders | 67% (13–100%) | 67% (13–100%) | 91% (74–100%) | 91% (74–100%) | ||||
| Others | – | – | 100% | 100% | ||||
| Disease stage at transplant | <0.0001 | <0.0001 | <0.0001 | <0.0001 | ||||
| Early | 70% (66–74%) | 60% (56–64%) | 65% (61–69%) | 57% (53–61%) | ||||
| Intermediate | 50% (43–57%) | 41% (34–48%) | 50% (45–55%) | 41% (36–46%) | ||||
| Late | 31% (25–37%) | 23% (18–28%) | 31% (25–37%) | 24% (19–29%) | ||||
| Age group | <0.0001 | <0.0001 | <0.0001 | <0.0001 | ||||
| 0–20 years | 63% (57–69%) | 57% (50–64%) | 73% (67–79%) | 67% (60–74%) | ||||
| 20–40 years | 61% (55–67%) | 51% (45–57%) | 55% (49–61%) | 45% (39–51%) | ||||
| 40–60 years | 52% (47–57%) | 40% (35–45%) | 51% (47–55%) | 42% (38–46%) | ||||
| 60–70 years | 30% (18–42%) | 27% (15–39%) | 45% (38–42%) | 40% (34–46%) | ||||
| >70 years | – | – | 26% (0–55%) | 15% (0–41%) | ||||
| Donor | <0.0001 | <0.0001 | <0.0001 | 0.001 | ||||
| HLA identical sibling | 63% (59–67%) | 52% (48–56%) | 61% (57–65%) | 51% (46–56%) | ||||
| Twin | 59% (35–83%) | 29% (7–51%) | 76% (46–100%) | 64% (29–98%) | ||||
| Other relative / haploidentical | 44% (34–54%) | 33% (23–43%) | 35% (22–48%) | 33% (20–46%) | ||||
| Unrelated | 45% (39–51%) | 41% (35–47%) | 50% (46–54%) | 43% (39–47%) | ||||
| Stem cell source | 0.03 | <0.0001 | 0.02 | 0.001 | ||||
| Bone marrow | 63% (57–69%) | 58% (52–64%) | 66% (59–73%) | 56% (49–63%) | ||||
| Peripheral blood | 52% (48–56%) | 41% (37–45%) | 51% (48–55%) | 44% (41–47%) | ||||
| Cord blood | 57% 31–83%) | 57% (31–83%) | 56% (43–69%) | 46% (33–59%) | ||||
| Risk score | <0.0001 | <0.0001 | <0.0001 | <0.0001 | ||||
| 0–1 | 78% (71–85%) | 68% (61–75%) | 83% (76–90%) | 72% (64–80%) | ||||
| 2–3 | 63% (59–67%) | 54% (49–59%) | 60% (56–64%) | 52% (48–56%) | ||||
| 4–5 | 39% (34–44%) | 28% (23–33%) | 45% (40–50%) | 37% (33–41%) | ||||
| 6–7 | 26% (12–40%) | 24% (11–35%) | 30% (20–40%) | 25% (16–34%) | ||||
| Conditioning | 0.002 | <0.0001 | 0.03 | 0.03 | ||||
| Non-myeloablative | 48% (41–55%) | 36% (29–43%) | 48% (43–53%) | 42% (37–47%) | ||||
| Myeloablative | 59% (55–63%) | 50% (46–55%) | 57% (53–61%) | 48% (44–52%) | ||||
| T-cell depletion (in vivo or in vitro) | 0.32 | 0.01 | 0.01 | <0.0001 | ||||
| No | 57% (53–61%) | 51% (47–55%) | 50% (45–55%) | 40% (36–44%) | ||||
| Yes | 53% (47–59%) | 38% (33–43%) | 57% (53–61%) | 50% (46–54%) | ||||
There were in total 9515 transplants over the 20-year period, 3067 (32%) allogeneic and 6448 (68%) autologous. As some patients received more than one transplant, the total numbers of allogeneic and autologous HCT recipients were 2781 and 5118, respectively. Of the allogeneic HCTs, 286 were repeated transplants, mostly due to relapse. Of the autologous HCTs, 1330 were repeated transplants, either due to relapse or as part of a planned sequential transplant protocol. Of the 3067 allogeneic HCTs, 1123 (37%) were performed in the first decade (1997–2006) and 1944 (63%) in the second decade (2007–2016). Corresponding numbers of autologous HCTs were 2689 (42%) in the first decade and 3759 (58%) in the second decade, showing an increase in transplant activity by 73% for allogeneic HCT and 40% for autologous HCT. Transplant rates, and therefore use of HCT technology, increased in allogeneic HCT from 14 to 21.8 HCTs per 1 million inhabitants per year from the first to the second decade. Likewise, autologous HCT increased from 24.8 to 37.2, annually corrected for population growth.
Table 1 shows demographic characteristics and transplant technology separately for allogeneic (Table 1a) and autologous (Table 1b) HCT.
Table 1a shows that the number of patients receiving an allogeneic HCT increased from 997 to 1784 when comparing the first (1997–2006) and second (2007–2016) decades. The main indications for allogeneic HCT were acute and chronic leukaemia, with the most notable change in chronic myeloid leukaemia, which decreased from 15.2 to 3.3% during the period of observation owing to the development of potent kinase inhibitor drugs. Most other indications showed a proportional increase. The median age increased from 38 to 48 years from 1997 to 2016 and the proportion of unrelated donors increased dramatically. There were changes in the stem cell source (less bone marrow) and use of T-cell depletion (massive increase of in vitro or in vivo T-cell depletion strategies) and, more recently, patients had higher EBMT risk scores (the EBMT risk score includes variables associated with mortality after HCT and is referenced in [4] and [15].
Table 1b shows autologous HCT over the two decades; the number of patients receiving an autologous HCT increased from 2042 to 3076. Indications were mainly lymphoid neoplasia, with the most impressive increases in plasma cell disorders (704 to 1486) and non-Hodgkin’s lymphoma (577 to 963). Median age increased from 50.8 to 56.4 years. For autologous HCT, the stem cell source was almost exclusively peripheral blood.
Univariate analyses of overall and progression-free survival in the first and second decade are shown in table 2a and figure 1 for allogeneic HCT (without significant difference between decades) and for autologous HCT in table 2b and figure 2. Figure 1 also shows nonrelapse mortality and relapse incidence per decade; nonrelapse mortality was lower in more recent years, but the unadjusted difference is minor (p = 0.08 in univariate and p = 0.002 in multivariate analysis). Figures 1 and 2 (and tables 2a and 2b ) show that OS at 5 years after allogeneic and autologous HCT is around 55 and 60%, respectively, for all patients transplanted in Switzerland. Figure 3 shows overall survival by EBMT risk score; the score was not used for multivariate analysis as all the elements contributing to the score were analysed as separate variables. It is nevertheless of interest to see how risk score affected survival with little change between the decades. Univariate outcomes for autologous HCT are shown in table 2b.
Figure 1 Main outcomes of 2781 patients with allogeneic haematopoietic cell transplants by year group in Switzerland between 1997 and 2016: (a) overall survival, (b) progression-free survival, (c) nonrelapse mortality and (d) relapse.
Table 2b Univariate analysis of overall and progression-free survival for autologous haematopoietic cell transplants by decade for the years 1997–2016.
| 1997–2006 | 2007–2016 | |||||||||
|---|---|---|---|---|---|---|---|---|---|---|
| Overall survival at 5 years | p-value | Progression-free survival at 5 years | p-value | Overall survival at 5 years | p-values | Progression-free survival at 5 years | p-values | |||
| Patients receiving first autograft (n) | 2042 | 2042 | 3076 | 3076 | ||||||
| 59% (57–61%) | 39% (37–41%) | 61% (59–63%) | 35% (33–37%) | |||||||
| Disease | <0.0001 | <0.0001 | <0.0001 | <0.0001 | ||||||
| Acute myeloid leukaemia | 44% (36–52%) | 39% (31–47%) | 51% (42–60%) | 43% (35–51%) | ||||||
| Acute lymphoid leukaemia | 55% (41–69%) | 44% (30–58%) | 39% (12–66%) | 44% (18–70%) | ||||||
| Chronic lymphocytic leukaemia | 82% (64–100%) | 56% (33–79%) | 33% (0–87%) | 33% (0–87%) | ||||||
| Chronic myeloid leukaemia | 25% (0–50%) | 25% (0–50%) | – | – | ||||||
| Combined myelodysplastic/myeloproliferative | 33% (9–57%) | 29% (5–53%) | 40% (0–100%) | 40% (0–100%) | ||||||
| Hodgkin’s lymphoma | 77% (70–84%) | 62% (55–69%) | 82% (75–89%) | 63% (54–72%) | ||||||
| Non-Hodgkin’s lymphoma | 62% (66–58%) | 49% (45–53%) | 61% (57–65%) | 45% (41–49%) | ||||||
| Plasma cell disorder | 60% (56–64%) | 23% (20–26%) | 63% (59–67%) | 22% (19–25%) | ||||||
| Solid tumours | 50% (44–56%) | 41% (36–46%) | 46% (38–54%) | 41% (34–48%) | ||||||
| Autoimmune disorders | 78% (50–100%) | 44% (11–77%) | 80% (59–100%) | 71% (47–95%) | ||||||
| Disease stage at transplant | 0.001 | <0.0001 | <0.0001 | <0.0001 | ||||||
| Early | 60% (57–63%) | 32% (29–35%) | 64% (60–68%) | 33% (29–37%) | ||||||
| Intermediate | 62% (57–67%) | 50% (45–55%) | 64% (60–68%) | 37% (33–41%) | ||||||
| Late | 55% (51–59%) | 39% (35–43%) | 49% (44–53%) | 36% (31–41%) | ||||||
| Age group | <0.0001 | <0.0001 | <0.0001 | <0.0001 | ||||||
| 0–20 years | 58% (50–66%) | 45% (37–53%) | 51% (41–61%) | 44% (35–53%) | ||||||
| 20–40 years | 64% (59–69%) | 55% (50–60%) | 71% (65–77%) | 57% (51–63%) | ||||||
| 40–60 years | 60% (57–63%) | 36% (33–39%) | 64% (61–67%) | 33% (30–36%) | ||||||
| 60–7 years0 | 51% (46–56%) | 27% (22–32%) | 56% (51–61%) | 30% (26–34%) | ||||||
| >70 years | 33% (7–59%) | 26% (1–51%) | 40% (17–63%) | 27% (10–44%) | ||||||
| Stem cell source | 0.31 | 0.4 | 0.01 | 0.48 | ||||||
| Bone marrow | 50% (23–77%) | 36% (10–62%) | 33% (0–69%) | 33% (0–69%) | ||||||
| Peripheral blood | 59% (57–61%) | 39% (37–41%) | 61% (59–63%) | 35% (33–37%) | ||||||
| Risk score | 0.001 | 0.002 | <0.0001 | <0.0001 | ||||||
| 0–1 | 67% (57–77%) | 57% (67–67%) | 75% (65–85%) | 62% (50–74%) | ||||||
| 2–3 | 58% (54–62%) | 36% (33–39%) | 62% (59–65%) | 34% (31–37%) | ||||||
| 4–5 | 58% (56–62%) | 40% (36–44%) | 55% (50–60%) | 35% (30–40%) | ||||||
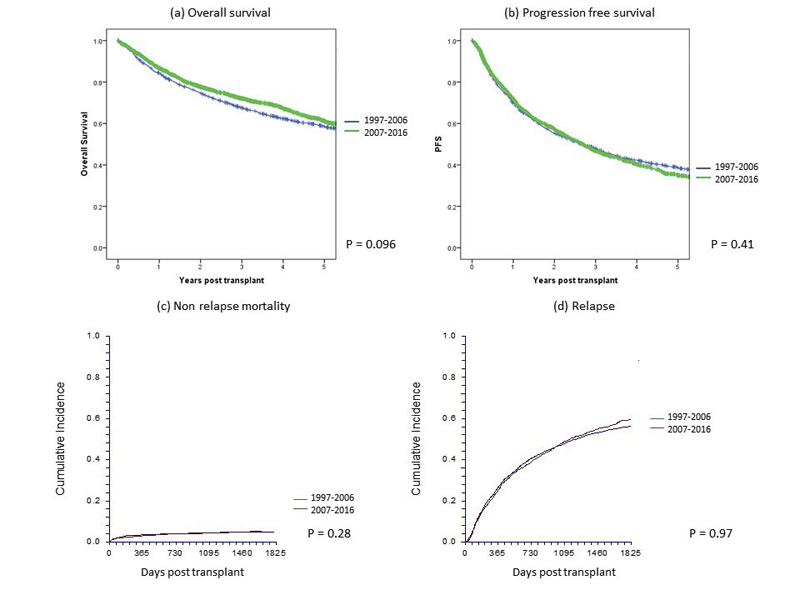
Figure 2 Main outcome of 5118 patients with autologous haematopoietic cell transplants by year group in Switzerland between 1997 and 2016: (a) overall survival, (b) progression-free survival, (c) nonrelapse mortality and (d) relapse.
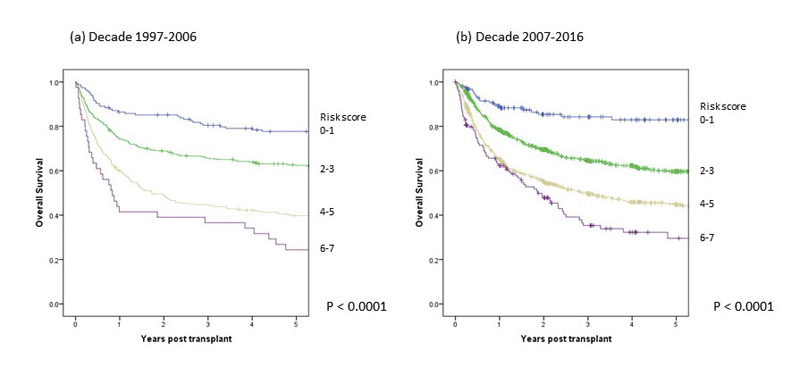
Figure 3 Main outcome by risk score of 2781 patients with allogeneic haematopoietic cell transplants by decade: (a) first decade 1997–2006, (b) second decade 2007–2016.
Results of multivariate analyses are shown in table 3a for allogeneic and table 3b for autologous HCT. Significant factors impacting on outcome in allogeneic HCT were disease type, disease stage, patient age and donor type for all outcomes, and the use of T-cell depletion, conditioning intensity, stem cell source and donor-recipient cytomegalovirus status for some of the outcomes. The decade of transplantation was significant only in models of nonrelapse mortality where the risks of death not associated with relapse was 0.68 (95% confidence interval 0.52–0.87,) in the later decade as compared with the earlier decade. In table 3b, models of autologous HCT are shown; for none of the outcomes analysed was the decade of transplantation significantly associated with outcome.
Table 3a: Multivariate analysis of survival, progression free survival, nonrelapse mortality and relapse for allogeneic haematopoietic cell transplants for the years 1997–2016.
|
Overall survival
Relative risk (95% CI) |
p-value |
Progression-free survival
Relative risk (95% CI) |
p-value |
Nonrelapse mortality
Relative risk (95% CI) |
p-value |
Relapse
Relative risk (95% CI) |
p-value | |
|---|---|---|---|---|---|---|---|---|
| Decade of Transplant | 0.18 | 0.26 | ||||||
| 1997–2006 | 1 | 1 | 1 | 1 | ||||
| 2007–2016 | 0.91 (0.80–1.05) | 0.93 (0.82–1.06) | 0.67 (0.52–0.86) | 0.002 | 1.05 (0.90–1.22) | 0.54 | ||
| Disease | <0.0001 | <0.0001 | ||||||
| Acute myeloid leukaemia | 1 | 1 | 1 | 1 | ||||
| Acute lymphoid leukaemia | 0.88 (0.73–1.10) | 1.12 (0.94–1.35) | 1.09 (0.75–1.56) | 0.66 | 1.09 (0.88–1.34) | 0.44 | ||
| Chronic lymphocytic leukaemia | 0.50 (0.35–0.73) | 0.65 (0.47–0.89) | 1.29 (0.75–2.23) | 0.35 | 0.63 (0.44–0.90) | 0.01 | ||
| Chronic myeloid leukaemia | 0.47 (0.35–0.62) | 0.85 (0.67–1.07) | 0.87 (0.53–1.47) | 0.62 | 0.92 (0.70–1.20) | 0.54 | ||
| Combined myelodysplastic/myeloproliferative | 0.74 (0.61–0.90) | 0.82 (0.68–0.99) | 1.24 (0.85–1.79) | 0.27 | 0.75 (0.59–0.95) | 0.02 | ||
| Myeloproliferative neoplasm | 0.42 (0.30–0.59) | 0.50 (0.37–0.67) | 1.28 (0.77–2.11) | 0.34 | 0.39 (0.26–0.59) | <0.0001 | ||
| Hodgkin’s lymphoma | 0.58 (0.38–0.87) | 0.75 (0.52–1.08) | 2.18 (1.09–4.37) | 0.03 | 0.51 (0.33–0.80) | 0.004 | ||
| Non-Hodgkin’s lymphoma | 0.58 (0.45–0.76) | 0.66 (0.51–0.84) | 1.93 (1.30–2.85) | 0.001 | 0.43 (0.31–0.60) | 0.0001 | ||
| Plasma cell disorder | 1.06 (0.85–1.33) | 1.34 (1.08–1.65) | 1.22 (0.74–2.01) | 0.44 | 1.33 (1.05–1.68) | 0.02 | ||
| Solid tumours | 1.23 (0.63–2.42) | 1.76 (0.89–3.45) | – | 2.31 (1.26–4.24) | 0.01 | |||
| Bone marrow failure | 0.92 (0.62–1.38) | 0.69 (0.45–1.04) | 3.12 (1.77–5.49) | <0.0001 | 0.13 (0.05–0.37) | <0.0001 | ||
| Inherited disorders of metabolism | 0.61 (0.19–1.96) | 1.31 (0.57–3.04) | 3.16 (1.00–9.98) | 0.05 | 0.67 (0.21–2.15) | 0.50 | ||
| Primary immune disorders | 0.84 (0.45–1.56) | 0.85 (0.47–1.51) | 1.98 (0.79–4.95) | 0.14 | 0.23 (0.93–0.58) | 0.002 | ||
| Haemoglobinopathy | 0.19 (0.03–1.39) | 0.32 (0.08–1.31) | – | 0.15 (0.06–1.10) | 0.06 | |||
| Histiocytic disorders | 0.83 (0.26–2.61) | 0.69 (0.22–2.17) | 1.07 (0.26 –4.36) | 0.92 | – | – | ||
| Other | – | – | – | – | – | |||
| Disease stage at transplant | <0.0001 | <0.0001 | ||||||
| Early | 1 | 1 | 1 | 1 | ||||
| Intermediate | 1.76 (1.51–2.04) | 1.69 (1.47–1.95) | 1.39 (1.05–1.85) | 0.021 | 1.57 (1.28–1.79) | <0.0001 | ||
| Late | 2.80 (2.40–3.27) | 2.58 (2.22–3.0) | 1.30 (0.97–1.77) | 0.083 | 2.69 (2.25–3.23) | <0.0001 | ||
| Age group | 0.001 | 0.02 | ||||||
| 0–20 years | 1 | 1 | 1 | 1 | ||||
| 20–40 years | 1.04 (0.82–1.33) | 1.23 (0.97–1.57) | 0.90 (0.58–1.39) | 0.64 | 1.51 (1.16–1.96) | 0.002 | ||
| 40–60 years | 1.39 (1.10–1.75) | 1.46 (1.14–1.86) | 1.54 (1.01–2.37) | 0.05 | 1.35 (1.04–1.75) | 0.02 | ||
| 60–70 years | 1.49 (1.14–1.95) | 1.49 (1.12–1.98) | 1.88 (1.14–3.09) | 0.01 | 1.26 (0.92–1.73) | 0.16 | ||
| >70 years | 1.79 (0.92–3.48) | 1.67 (0.87–3.20) | 2.86 (1.13–7.25) | 0.03 | 1.40 (0.60–3.30) | 0.44 | ||
| Donor | <0.0001 | <0.0001 | ||||||
| HLA identical sibling | 1 | 1 | 1 | 1 | ||||
| Twin | 0.64 (0.35–1.17) | 0.89 (0.49–1.64) | 0.41 (0.05–3.18) | 0.39 | 1.16 (0.58–2.32) | 0.68 | ||
| Other relative | 2.01 (1.61–2.50) | 1.76 (1.42–2.19) | 3.27 (2.20–4.86) | <0.0001 | 1.11 (0.84–1.45) | 0.468 | ||
| Unrelated | 1.52 (1.33–1.74) | 1.24 (0.9–1.40) | 2.65 (2.04–3.45) | <0.0001 | 0.79 (0.68–0.92) | 0.002 | ||
| Source | 0.003 | |||||||
| Bone marrow | – | 1 | – | – | ||||
| Peripheral blood | – | 0.98 (0.83–1.16) | – | – | ||||
| Cord blood | – | 1.84 (1.27–2.66) | – | – | ||||
| Cytomegalovirus status (donor-recipient) | ||||||||
| Neg-neg | – | – | 1 | |||||
| Pos-neg | – | – | 0.82 (0.55–1.23) | 0.35 | – | |||
| Pos-pos | – | – | 1.05 (0.80–1.37) | 0.74 | – | |||
| Neg-pos | – | – | 1.36 (1.03–1.78) | 0.03 | – | |||
| Conditioning | 0.011 | |||||||
| Non-myeloablative | – | 1 | 1 | 1 | ||||
| Myeloablative | – | 0.83 (0.72–0.96) | 1.50 (1.17–1.93) | 0.001 | 0.66 (0.55–0.78) | <0.0001 | ||
| T–cell depletion (in vivo or in-vitro) | 0.02 | |||||||
| No | 1 | – | 1 | – | ||||
| Yes | 0.85 (0.74–0.98) | – | 0.75 (0.59–0.95) | 0.02 | – |
Table 3b Multivariate analysis of overall survival, progression free survival, nonrelapse mortality and relapse for autologous haematopoietic cell transplants for the years 1997–2016.
| Overall survival | p-value | Progression-free survival | p-value | Nonrelapse mortality | p-value | Relapse | p-value | |
|---|---|---|---|---|---|---|---|---|
| Decade of transplant | 0.12 | 0.94 | ||||||
| 1997–2006 | 1 | 1 | 1 | 1 | ||||
| 2007–2016 | 0.93 (0.84–1.02) | 1.0 (0.92–1.08) | 1.00 (0.77–1.31) | 0.98 | 0.96 (0.88–1.04) | 0.28 | ||
| Disease | <0.0001 | <0.0001 | ||||||
| Acute myeloid leukaemia | 1 | 1 | 1 | 1 | ||||
| Acute lymphoid leukaemia | 0.86 (0.60–1.23) | 0.92 (0.65–1.29) | 0.47 (0.16–1.34) | 0.16 | 1.0 (0.65–1.52) | 0.99 | ||
| Chronic lymphocytic leukaemia | 0.38 (0.19–0.74) | 0.56 (0.32–0.98) | 0.65 (0.14–2.91) | 0.57 | 0.61 (0.35–1.05) | 0.07 | ||
| Chronic myeloid leukaemia | 1.46 (0.74–2.87) | 1.57 (0.80–3.07) | 2.33(0.64–8.40) | 0.20 | 0.96 (0.38–2.41) | 0.95 | ||
| Combined myelodysplastic/myeloproliferative | 1.04 (0.59–1.83) | 0.93 (0.53–1.63) | 1.79 (0.61–5.31) | 0.29 | 0.68 (0.33–1.39) | 0.29 | ||
| Hodgkin’s lymphoma | 0.33 (0.25–0.44) | 0.48 (0.37–0.61) | 0.47 (0.26–0.87) | 0.02 | 0.50 (0.37–0.67) | <0.0001 | ||
| Non-Hodgkin’s lymphoma | 0.59 (0.49–0.71) | 0.72 (0.61–0.85) | 0.53 (0.33–0.86) | 0.01 | 0.80 (0.65–0.98) | 0.03 | ||
| Plasma cell disorder | 0.63 (0.53–0.75) | 1.03 (0.88–1.21) | 0.35 (0.23–0.55) | <0.0001 | 1.24 (1.03–1.51) | 0.02 | ||
| Solid tumours | 0.75 (0.59–0.97) | 0.76 (0.61–0.96) | 0.27 (0.15–0.52) | <0.0001 | 0.91 (0.70–1.19) | 0.51 | ||
| Autoimmune disorders | 0.30 (0.12–0.73) | 0.50 (0.25–0.98) | 0.54 (0.12–2.41) | 0.42 | 0.49 (0.20–1.16) | 0.11 | ||
| Disease stage at transplant | <0.0001 | <0.0001 | ||||||
| Early | 1 | 1 | 1 | 1 | ||||
| Intermediate | 1.06 (0.93–1.20) | 1.10 (0.99–1.21) | 1.45 (1.03–2.05) | 0.03 | 1.05 (0.95–1.16) | 0.31 | ||
| Late | 1.47 (1.28–1.70) | 1.55 (1.37–1.74) | 2.07 (1.41–3.07) | <0.0001 | 1.37 (1.21–1.55) | <0.0001 | ||
| Age group | <0.0001 | <0.0001 | ||||||
| 0–20 years | 1 | 1 | – | 1 | ||||
| 20–40 years | 0.90 (0.71–1.12) | 0.84 (0.69–1.04) | – | 0.81 (0.63–1.03) | 0.08 | |||
| 40–60 years | 1.26 (1.01–1.57) | 1.19 (0.98–1.46) | – | 1.11 (0.87–1.41) | 0.39 | |||
| 60–70 years | 1.60 (1.23–2.02) | 1.40 (1.14–1.74) | – | 1.19 (0.93–1.52) | 0.17 | |||
| >70 years | 2.46 (1.69–3.59) | 1.53 (1.10–2.15) | – | 1.17 (0.80–1.70) | 0.43 | |||
| Patient gender | 0.02 | 0.01 | ||||||
| Male | 1 | 1 | – | 1 | ||||
| Female | 0.90 (0.82–0.98) | 0.91 (0.84–0.98) | – | 0.91 (0.84–0.98) | 0.02 |
This report illustrates experience with haematopoietic cell transplantation in Switzerland over the 20 year period from 1997 to 2016 and it describes the current status. The report provides data on transplant activity and characteristics of treated patients, and technology used, and gives valuable information on outcome. Transplant activity generally increased over the observation period with an increase of 73% from the first to the second decade in allogeneic HCTs and 40% in autologous HCTs. This reflects trends seen in Europe, where corresponding increases were 52 and 47%. The increase in transplant activity in Switzerland was within the range of neighbouring European nations [12].
In the comparison of the two decades, some trends become evident. Patients receiving allogeneic HCT in the later decade were older, had higher risk scores, more often received stem cells from unrelated donors and, because of their higher risk status, probably also had more commonly received reduced intensity conditioning regimens and some form of T-cell depletion [13]. Outcome data were relatively stable, showing similar survival probabilities in the later decade but lower nonrelapse mortality. This lack of progress could be seen as a disappointment, but given that treated cohorts differed and that the later cohort included more high-risk patients, the outcome results appear encouraging and probably reflect therapeutic progress. Adjusted treatment-associated mortality risks were decreased by 32% in the later decade. The resulting message, therefore, is that currently older patients can be treated with use of more complex transplant technology and with results similar to those of younger patients treated in previous years; in multivariate analysis mortality related to the procedure was clearly less.
For autologous transplantation, effects were similar but less marked. The most important increase was in autologous HCT for myeloma, which doubled over the decades. This was related to confirmation of the use of high-dose chemotherapy as a first-line treatment in myeloma [14], even now, in the era of modern drug treatment. As with allogeneic HCT, the age of treated patients increased by approximately 6 years. In spite of the treatment of older patients, outcome was not worse in later cohorts. Nonrelapse mortality with autologous HCT is consistently low, with little room for improvement (see fig. 2c).
Autologous and allogeneic HCT have different patterns of outcome. Nonrelapse mortality was lower with autologous HCT than with allogeneic HCT; on the other hand, the relapse rate was higher with autologous HCT and survival curves indicated an ongoing risk of relapse over time. Outcome of HCT is better when transplants are performed at an early stage of the disease. Nonrelapse mortality and risk of relapse increases in patients receiving transplants when their disease is at an advanced stage.
Total transplant rates, (the numbers of transplants in relation to number of inhabitants in Switzerland) were within the average of transplant rates in western Europe [12], but for allogeneic HCT, rates were lower than in, for example, Germany. These differences were possibly due to the particular situation in Switzerland, which puts allogeneic HCT under the regulation of the IVHSM (Interkantonale Vereinbarung über die hochspezialisierte Medizin). The data on outcome reflected the current situation. Outcome varies according to indication and clinical situation. It is dependent on disease, disease stage, donor type histocompatibility between donor and recipient in allogeneic HCT, and on main pretransplant risk factors, as previously described by the international transplant registries [15].
The age of treated patients continues to increase and large series of patients in their 70s receiving transplants from an allogeneic donor have been described [16]. As age continues to increase for both allogeneic and autologous HCT, proper evaluation of comorbidities [17] and geriatric assessment become ever more important [18]. The increasing age of treated patients is a reflection of improved technology that allows older patients to be treated; however, these improvements are difficult to pinpoint as they range from the use of cytotoxic drugs for conditioning, better choice of donor, including better tissue typing of unrelated donors, better technology to deal with mismatched donors and better graft-versus-host disease prophylaxis to improved management of infectious complications, transfusion support and other aspects of supportive care [19].
Advances in therapeutic drug development have led to a significant shift in the timing of allogeneic transplantation in some disease categories. In chronic myeloid leukaemia, recently most patients were transplanted after failed treatment with several kinase inhibitors [20], which was reflected in an increase in the interval from diagnosis to HCT from a median of 298 to 610 days. Similarly, in plasma cell myeloma, an important number of new drugs have become available and, as allogeneic HCT is used mainly as a salvage regimen, the interval from diagnosis to HCT in these patients increased from 538 to 823 days [21]. Therefore outcomes in some of the disease categories have become worse over time. For example, for allogeneic HCT 5-year survival has dropped from 76 to 61% in chronic myeloid leukaemia, from 48 to 34% in plasma cell myeloma and from 53 to 42% in Hodgkin’s lymphoma. It is important to note that since these are not entirely comparable patients this drop in 5-year survival probabilities does not reflect poorer technology.
As our registry does not have precise data on pretransplant treatment, we used interval from diagnosis to treatment as an indicator of prior therapy. It has been shown in many studies that intensive pretreatment decreases the success rate of allogeneic HCT. It has also been shown many times that the number of prior treatment lines and the interval from diagnosis to transplantation adversely impact nonrelapse mortality and relapse rates [15]. At the same time, we did not have information on patients who did not need an allogeneic HCT because of successful drug treatment. Therefore, comparison of outcome over time has to be interpreted cautiously and in the context of the global treatment landscape for specific diseases.
Limitations of these data are obviously the retrospective and observational nature of data collection and the fact that there is no information on outcomes of alternative treatments. It is among the strengths of this study that there is complete coverage of all transplanted patients over two decades, which is unique in Switzerland.
The current analysis looked at the results of evaluation of a registry and benefited from its 20 years of existence. It is comforting to see that progress continues, but this occurs in small steps and not in quantum leaps. Federal regulations in Switzerland have made it mandatory to maintain an evaluation registry, leading to a valuable database including all HCTs performed in Switzerland during the period of observation, which therefore constitutes a true observational registry with complete observation of all treated cases that will be useful for quality assurance programmes, healthcare cost estimation and healthcare planning. Between 50 and 60% of patients are expected to survive in the long-term after autologous and allogeneic HCT, indicating growing populations of surviving patients requiring long-term care and observation.
Aarau: Centre of Oncology/Haematology, Department of Internal Medicine, Centre for Laboratory Medicine, Aarau Blood Centre, Kantonsspital Aarau,: M. Bargetzi, M.Heizmann, P. Fernandez, J. Sigle. Basel: Stem cell transplant team University Hospital and the Children’s University Hospital: J. Passweg, H. Baldomero, D. Heim, M. Kleber, J. Halter, M. Medinger, C. Lengerke, S. Gerull, A.Buser, T.Kühne, N.von der Weid. Bellinzona: Division of Haematology, Hospital San Giovanni,: G. Stüssi, L. Wannesson, E. Lerch. Berne: Division of Haematology/Oncology, Department of: K. Leibundgut; Department of Haematology, University Hospital: G.M. Baerlocher, N. Bonadies, C. Brunold, B. Mansouri, J. Engels, A. Rovo; Department of Oncology, University Hospital: T. Pabst, U. Novak, B. Jeker. Geneva: Division of Haematology, Oncology Department, University Hospital: Y. Chalandon, Y. Tirefort, S. Masouridi-Levrat, A-C Mamez, F. Simonetta, C. Dantin, V. Chapuis, S. Huguet; Division of Paediatrics, University Hospital,: M. Ansari, F. Bernard, H. Ozsahin. Lausanne: Service and Central Laboratory of Haematology, Departments of Oncology and of Laboratories, University Hospital of Lausanne: M. A. Duchosal, S. Barelli, A. Cairoli, C. Heumann, J. Carr Klappert, M. Peralta Lacambra, M. Mclauchlan. St Gallen: Division of Haematology/Oncology, Department of Internal Medicine, Kantonsspital: U.Hess, J. Thierbach, F. Hitz. Zurich: Division of Haematology, University Hospital: U Schanz, G. Nair, M. Schmidt, M. Manz, A. Müller; Division of Immunology/Haematology/Oncology, University Children’s Hospital: T. Güngor, J. Reichenbach, M. Schmugge, J. Pachlopnik, U. Zeilhofer; Stadtspital Triemli: A. Schmidt; Division of Oncology, Clinic Hirslanden: Ch. Renner, P. Samaras, U. Petrausch.
The SBST registry is compulsory through an unfunded mandate by the Federal Office of Public Health. It is financed by contributions from the transplanting centres and the University of Basel.
The authors declare that they have no conflicts of interest.
1 Gratwohl A , Gmür J , Chapuis B , Baumgartner C , Würsch A , Lori A , et al. 12 Jahre Knochenmarktransplantation bei Leukämien in der Schweiz. [12 years’ experience in bone marrow transplantation in leukemic patients in Switzerland]. Schweiz Med Wochenschr. 1986;116(43):1477–8. Article in German.
2 Leibundgut K , Hirt A , Lüthy AR , Wagner HP , Tobler A . Single institution experience with mobilization, harvesting, and reinfusion of peripheral blood stem cells in children with a solid tumor or leukemia. Pediatr Hematol Oncol. 1994;11(2):215–21. doi:.https://doi.org/10.3109/08880019409141660
3 Copelan EA . Hematopoietic stem-cell transplantation. N Engl J Med. 2006;354(17):1813–26. doi:.https://doi.org/10.1056/NEJMra052638
4 Gratwohl A , Hermans J , Goldman JM , Arcese W , Carreras E , Devergie A , et al.; Chronic Leukemia Working Party of the European Group for Blood and Marrow Transplantation. Risk assessment for patients with chronic myeloid leukaemia before allogeneic blood or marrow transplantation. Lancet. 1998;352(9134):1087–92. doi:.https://doi.org/10.1016/S0140-6736(98)03030-X
5 Appelbaum FR . Hematopoietic-cell transplantation at 50. N Engl J Med. 2007;357(15):1472–5. doi:.https://doi.org/10.1056/NEJMp078166
6 Gratwohl A , Pasquini MC , Aljurf M , Atsuta Y , Baldomero H , Foeken L , et al.; Worldwide Network for Blood and Marrow Transplantation (WBMT). One million haemopoietic stem-cell transplants: a retrospective observational study. Lancet Haematol. 2015;2(3):e91–100. doi:.https://doi.org/10.1016/S2352-3026(15)00028-9
7 Tyndall A . Successes and failures of stem cell transplantation in autoimmune diseases. Hematology (Am Soc Hematol Educ Program). 2011;2011(1):280–4. doi:.https://doi.org/10.1182/asheducation-2011.1.280
8 Passweg J , Baldomero H , Chapuis B , Leibundgut K , Schanz U , Gratwohl A ; Swiss Transplant Working Group Blood and Marrow Transplantation Board. Haematopoietic stem cell transplantation in Switzerland. Report from the Swiss Transplant Working Group Blood and Marrow Transplantation (STABMT) Registry 1997-2003. Swiss Med Wkly. 2006;136(3-4):50–8. doi:https://smw.ch/en/article/doi/smw.2006.11286/.
9 Passweg J , Baldomero H , Stern M , Bargetzi M , Ghielmini M , Leibundgut K , et al.; Swiss Blood and Marrow Stem Cells Transplant Group (SBST). Hematopoietic stem cell transplantation in Switzerland: a comprehensive quality control report on centre effect. Swiss Med Wkly. 2010;140(23-24):326–34. doi:https://smw.ch/en/article/doi/smw.2010.12978/.
10 Sureda A , Bader P , Cesaro S , Dreger P , Duarte RF , Dufour C , et al. Indications for allo- and auto-SCT for haematological diseases, solid tumours and immune disorders: current practice in Europe, 2015. Bone Marrow Transplant. 2015;50(8):1037–56. doi:.https://doi.org/10.1038/bmt.2015.6
11Klein JP, Wu TJ. Handbook of Statistics: Advances in Survival Analysis Discretizing a Continuous Covariate in Survival Studies. Amsterdam: Elseiver; 2004.
12 Passweg JR , Baldomero H , Bargetzi M , Bucher C , Chalandon Y , Duchosal MA , et al.; SBST (Swiss Blood Stem Cell Transplantation Group). Haematopoietic stem cell transplantation: activity in Switzerland compared with surrounding European countries. Swiss Med Wkly. 2013;143:w13757. doi:https://smw.ch/en/article/doi/smw.2013.13757/.
13 Passweg JR , Baldomero H , Gratwohl A , Bregni M , Cesaro S , Dreger P , et al.; European Group for Blood and Marrow Transplantation (EBMT). The EBMT activity survey: 1990-2010. Bone Marrow Transplant. 2012;47(7):906–23. doi:.https://doi.org/10.1038/bmt.2012.66
14 Attal M , Lauwers-Cances V , Hulin C , Leleu X , Caillot D , Escoffre M , et al.; IFM 2009 Study. Lenalidomide, Bortezomib, and Dexamethasone with Transplantation for Myeloma. N Engl J Med. 2017;376(14):1311–20. doi:.https://doi.org/10.1056/NEJMoa1611750
15 Gratwohl A , Stern M , Brand R , Apperley J , Baldomero H , de Witte T , et al.; European Group for Blood and Marrow Transplantation and the European Leukemia Net. Risk score for outcome after allogeneic hematopoietic stem cell transplantation: a retrospective analysis. Cancer. 2009;115(20):4715–26. doi:.https://doi.org/10.1002/cncr.24531
16 Muffly L , Pasquini MC , Martens M , Brazauskas R , Zhu X , Adekola K , et al. Increasing use of allogeneic hematopoietic cell transplantation in patients aged 70 years and older in the United States. Blood. 2017;130(9):1156–64. doi:.https://doi.org/10.1182/blood-2017-03-772368
17 ElSawy M , Storer BE , Pulsipher MA , Maziarz RT , Bhatia S , Maris MB , et al. Multi-centre validation of the prognostic value of the haematopoietic cell transplantation- specific comorbidity index among recipient of allogeneic haematopoietic cell transplantation. Br J Haematol. 2015;170(4):574–83. doi:.https://doi.org/10.1111/bjh.13476
18 Artz AS . Biologic vs physiologic age in the transplant candidate. Hematology (Am Soc Hematol Educ Program). 2016;2016(1):99–105. doi:.https://doi.org/10.1182/asheducation-2016.1.99
19 Hahn T , McCarthy PL, Jr , Hassebroek A , Bredeson C , Gajewski JL , Hale GA , et al. Significant improvement in survival after allogeneic hematopoietic cell transplantation during a period of significantly increased use, older recipient age, and use of unrelated donors. J Clin Oncol. 2013;31(19):2437–49. doi:.https://doi.org/10.1200/JCO.2012.46.6193
20 Passweg JR , Baldomero H , Bader P , Bonini C , Cesaro S , Dreger P , et al. Impact of drug development on the use of stem cell transplantation: a report by the European Society for Blood and Marrow Transplantation (EBMT). Bone Marrow Transplant. 2017;52(2):191–6. doi:.https://doi.org/10.1038/bmt.2016.258
21 Gay F , Engelhardt M , Terpos E , Wäsch R , Giaccone L , Auner HW , et al. From transplant to novel cellular therapies in multiple myeloma: EMN guidelines and future perspectives. Haematologica. 2017;haematol.2017.174573; Epub ahead of print. doi:.https://doi.org/10.3324/haematol.2017.174573
The SBST registry is compulsory through an unfunded mandate by the Federal Office of Public Health. It is financed by contributions from the transplanting centres and the University of Basel.
The authors declare that they have no conflicts of interest.