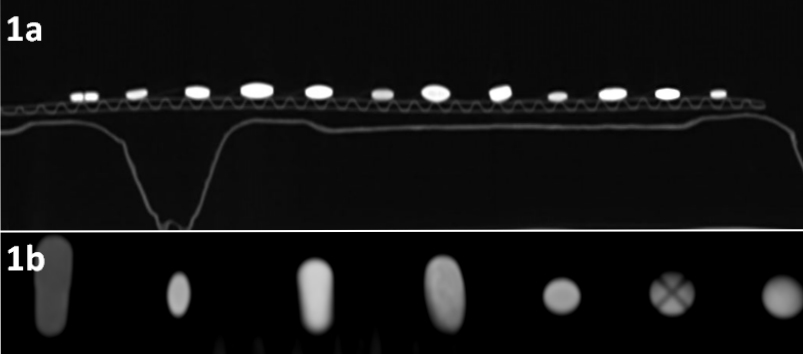
Figure 1 (a) Sagittal reconstruction of scan layout with dens pills attached to cardboard kidney basins and (b) coronal close up of different examples of drugs, with obvious attenuation differences.
DOI: https://doi.org/10.4414/smw.2018.14585
Radiologists routinely encounter various radiopaque structures within the gastrointestinal tract, including pills or foreign bodies [1, 2]. The first medications to have their radiopaque characteristics identified were iron preparations, which were studied in vivo and in vitro with standard radiography in the era before the invention of computed tomography [3]. Various radiodensities were found for different pills on conventional radiographs. However, two thirds of all pills are not detectable with radiography, mainly because of their dissolution within the gastric lumen [4]. With advances in CT imaging, the detection of radiopaque drugs within the bowel lumen has increased substantially [5]. Pills with densities below 900 Hounsfield units (HU) are not visible on standard abdominal radiographs, but become apparent with the superior resolution of CT. Most of the selected drugs differed in density, depending on their excipients, size and shape. During the radiological assessment of a substance within the gastrointestinal tract, the CHIPES mnemonic is used [1], this is an acronym of chloral hydrate, heavy metals, iron, psychotropics and enteric-coated and sustained-release preparations.
In patients undergoing an abdominal CT scan, a density assessment of pills incidentally found within the gastrointestinal tract might provide additional information on appropriate therapy (compliance) and might even be life-saving, especially in unconscious and non-communicative patients. Furthermore, identification and classification of pills found on post-mortem CTs could be important in determining the cause of death [6].
CT spectroscopy offers the opportunity to classify radiopaque material. At different levels of CT tube voltages, the assessed material changes attenuation. For each material, depending on the dominant substance, there is a specific change in X-ray absorption [7]. From the density change at different voltage levels, one can conclude which substances were scanned. Therefore, CT spectroscopy has found its way into clinical applications. For example, it can be used to differentiate between gout (urate deposition) and pseudogout (calcium pyrophosphate deposition) [8]. The characterisation of renal stones is also feasible with dual-energy CT and is crucial for therapeutic management [9, 10]. Therefore, CT spectroscopy could hypothetically aid in characterising active and passive agents in orally administered drugs.
The purpose of this study was to investigate the CT density of frequently administered medications (1) for the better characterisation of substances on abdominal CT, (2) to allow radiologists to narrow down possibilities in the identification of hyperdense material in the bowel and (3) to provide forensic doctors with a tool to identify gastric content before an autopsy. The additional value of CT spectroscopy in the medication identification process was also analysed.
Approval of the ethics committee was waived because no humans were involved in this phantom study.
From the list of the local hospital pharmacy, the 50 most frequently used medications were identified. The cut-off was more than 1000 original units used in the year 2015. Medications in non-tablet form were not included because their HU changes rapidly in the stomach. Of the 50 medications, 4 were excluded because they were fizzy or liquid.
The remaining 46 products were taped to the back of cardboard kidney basins (fig. 1). Neither the tape nor the basins had significant radiodensity.
Figure 1 (a) Sagittal reconstruction of scan layout with dens pills attached to cardboard kidney basins and (b) coronal close up of different examples of drugs, with obvious attenuation differences.
The cardboard was scanned with a 128 row CT scanner (Acquillion, Toshiba, Tokyo, Japan). To the standard routine abdominal CT protocol with a tube voltages of 120 kVp, an additional scan with 100 kVp was added to perform CT spectroscopy. A constant tube current of 150 mAs was used, with detector rows of 0.5 × 64. Pitch factor PF 0.828/helical pitch HP 53 was used and rotation time was fixed to 1 rotation per second. Standard medium scan and display field of view (32 cm, M320) was consistently used. Images were reconstructed with the standard abdominal kernel FC07 and the iterative reconstruction AIDR_3D_Standard. A collimation of 0.5 mm, a slice thickness of 0.5 mm and an increment of 0.3 mm were used.
The tablets were scanned along the longest diameter in the axial plane.
The experiment was repeated with the same scan protocol and the pills submerged in hydrochloric acid. All available medicaments were examined in separate plastic cups (25 ml). The cups were taped to cardboard in a linear fashion, such that only one pill appeared on axial CT scans (fig. 2). Of the original 46 medicaments, 4 were no longer available owing to changes of suppliers to the hospital pharmacy (Mirtazapin, Novalgin, Torem and Perindopril). According to the literature, average gastric juice is equivalent to hydrochloric acid with pH between 2 and 3 [11]. Hydrochloric acid at a concentration of 0.01 mol/l (pH 2) was poured into the cups at time t = 0. The scans were repeated at t = 5, 10, 15, 30 and 60 minutes and 2, 4, 8, 12, 16, 24, 36, 48, 72, 96 hours. The CT scans were performed with 100 and 120 kV at each time-point.

Figure 2 Pre-scan CT-scout of the 50 plastic cups (view from above). (a) 5 minute after submerging the pills into hydrochloric acid. (b) 30 minutes after submerging the pills. The white arrow point towards the stable potassium pill (KCl Retard) and the black arrow demonstrates the decay of Cordarone.
The read-out was performed on a GE-Workstation (General Electric, Milwaukee, WI, USA) by two readers. A circular region of interest (ROI) was placed in the middle of each tablet with the largest diameter possible, without enclosing the air around the tablet. When the tablet had a coating with density different from the large core, the coating was not included in the measurement (fig. 3).
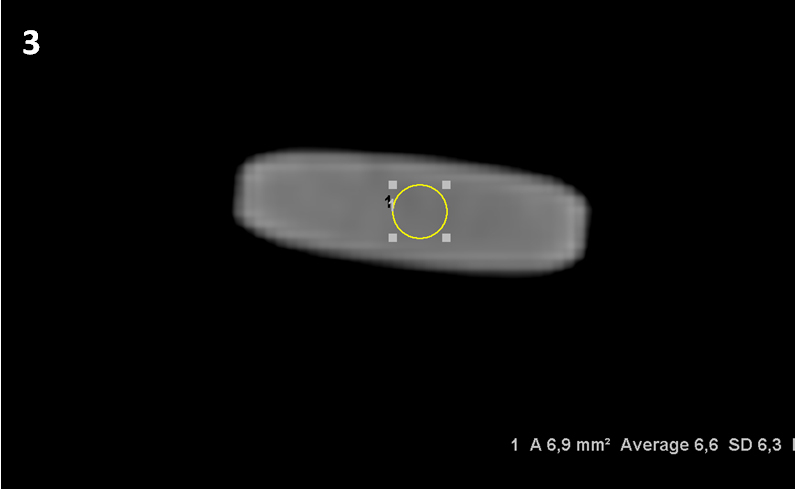
Figure 3 Co-Amoxicillin Sandoz 1 g at 100 kV with a density 6.6 Hounsfield Units.
The readers made all measurements separately and were unaware of the drug identities.
Reader 1 was a staff radiologist with 5 years of CT imaging experience, and reader 2 was a specialist in internal medicine with 7 years of clinical experience, including CT reading without specific radiological training.
The readers undertook two read-out sessions. In the first, they measured the density and noise (standard deviation [SD] of pixel density in the ROI) of each pill in the two scans (100/120 kVp). After a break of 4 weeks, the readers repeated the measurements to test repeatability (intra-rater agreement).
The density of the pills was measured by one radiologist (reader 1) and the Hounsfield units (HU) and the SD were recorded. Decomposition/dissolution of the pills was defined as a permanent density drop of the HU under the original HU score minus double the SD of the readers. For drugs with a negative original HU, the cut-off value for dissolution was the original HU plus double the SD (normal HU of water/acid is 0 HU). CT spectroscopy is valid only as long as the pills are intact.
For every ROI, the mean pixel density (in HU) and the SD of pixel densities (noise) were noted during the read-out. The standard deviation of the four HU measurements of the same pill at the same tube voltage and the average HU for the two readers for each pill at both voltage levels were then calculated. The inter- and intra-rater agreements were calculated from the correlation coefficients of the two readers. The CT spectroscopic changes in pill density at the two different tube voltages were calculated as both absolute and relative (delta HU divided by the HU at the 120 kVp level) values. The delta HU was plotted against the pill density at the 120 kVp level, a linear trend line was fitted and the formula was calculated.
The mean density for the pills was 525 ± 100 HU at 120 kVp and increased to 603 ± 81 at the lower 100 kVp level (p <0.0001).
The mean density of all pills at both tube voltage levels, including their standard deviations, are listed in table 1. The most dense pill was Cordarone, and the least dense was Perenterol, with an attenuation that was lower than the density of fat (<−120 HU).
Table 1 Medicaments ranked according to density at 120 kV.
|
HU
100 kV |
SD ROI (noise) | SD Readers |
HU
120 kV |
SD ROI (noise) | SD Readers | Difference HU | Relative delta (to original HU at 120 kV) | |
|---|---|---|---|---|---|---|---|---|
| Cordarone Tabl 200 mg | 8894 | 1664 | 931 | 7265 | 1592 | 441 | 1629 | 0.224 |
| KCL Retard Hausmann Drag | 3390 | 242 | 81 | 2829 | 218 | 46 | 561 | 0.198 |
| Concor Lacktabl 5 mg | 2043 | 643 | 491 | 1879 | 485 | 265 | 163 | 0.087 |
| Aldactone Filmtabl 25 mg | 1603 | 229 | 211 | 1358 | 182 | 101 | 245 | 0.180 |
| Lisinopril Tabl 20 mg | 1271 | 200 | 155 | 1145 | 117 | 106 | 126 | 0.110 |
| Januvia Filmtabl 50 mg | 984 | 149 | 172 | 899 | 82 | 33 | 84 | 0.094 |
| Trittico Tabl 50 mg | 779 | 86 | 32 | 728 | 77 | 25 | 51 | 0.070 |
| Benerva Tabl 300 mg | 772 | 90 | 9 | 638 | 35 | 12 | 134 | 0.209 |
| Amlodipin Tabl 10 mg Spirig HC | 548 | 60 | 47 | 555 | 68 | 50 | −7 | −0.012 |
| Atorvastatin Filmtabl 40 mg | 607 | 35 | 24 | 524 | 31 | 21 | 82 | 0.157 |
| Benexol B12 Tabl | 522 | 118 | 43 | 427 | 94 | 55 | 94 | 0.221 |
| Brilique Filmtabl 90 mg | 472 | 34 | 25 | 419 | 26 | 20 | 54 | 0.128 |
| Metformin Lactabs 1000 mg | 470 | 12 | 1 | 377 | 9 | 2 | 92 | 0.244 |
| Citalopram 20 mg | 476 | 61 | 88 | 355 | 126 | 101 | 121 | 0.339 |
| Plavix Tabl 75 mg | 378 | 47 | 14 | 333 | 36 | 11 | 45 | 0.137 |
| Novalgin Tabl 500 mg | 371 | 26 | 8 | 318 | 50 | 13 | 53 | 0.166 |
| Crestor Filmtabl 10 mg | 332 | 35 | 32 | 310 | 13 | 28 | 22 | 0.071 |
| Acidum Folicum Streuli Tabl 5 mg | 260 | 11 | 19 | 305 | 36 | 20 | −45 | −0.147 |
| Phoscap Kaps 250 | 339 | 115 | 68 | 297 | 99 | 54 | 43 | 0.144 |
| Becozym Drag forte | 312 | 37 | 5 | 292 | 51 | 28 | 21 | 0.071 |
| Prednison Streuli Tabl 5 mg | 196 | 119 | 112 | 269 | 16 | 22 | −73 | −0.271 |
| Marcoumar Tabl 3 mg | 257 | 59 | 92 | 258 | 119 | 63 | −1 | −0.004 |
| Eltroxin−LF Tabl 0.1 mg | 252 | 8 | 24 | 252 | 29 | 30 | 0 | 0.000 |
| Candesartan Tabl 16 mg | 250 | 6 | 16 | 250 | 23 | 23 | 0 | 0.001 |
| Dipiperon Tabl | 277 | 24 | 27 | 227 | 20 | 35 | 50 | 0.220 |
| Quetiapin Filmtabl 25 mg | 253 | 82 | 34 | 222 | 45 | 28 | 31 | 0.138 |
| Simvastatin Filmtabl 40 mg | 229 | 38 | 22 | 221 | 48 | 19 | 9 | 0.040 |
| Aspirin Cardio 100 Filmtabl 100 mg | 186 | 41 | 48 | 216 | 11 | 13 | −30 | −0.138 |
| Valverde Schlaf Filmtabl | 197 | 22 | 5 | 199 | 21 | 17 | −1 | −0.007 |
| Nebivolol Tabl 5 mg | 236 | 47 | 90 | 186 | 99 | 49 | 51 | 0.273 |
| Primperan Tabl 10 mg | 44 | 114 | 213 | 181 | 32 | 23 | −137 | −0.758 |
| Mirtazapin Filmtabl 30 mg | 193 | 20 | 18 | 177 | 38 | 29 | 16 | 0.090 |
| Flagyl Tabl 500 mg | 153 | 18 | 7 | 161 | 14 | 6 | −8 | −0.048 |
| Zolpidem Filmtabl 10 mg | 103 | 98 | 215 | 144 | 82 | 151 | −41 | −0.283 |
| Beloc Zok 100 Ret Tabl 100 mg | 104 | 43 | 42 | 139 | 23 | 6 | −35 | −0.251 |
| Pantozol Tabl 20 mg | 163 | 59 | 51 | 134 | 82 | 61 | 29 | 0.216 |
| Madopar LIQ Tabl 62.5 mg | 134 | 67 | 42 | 131 | 68 | 51 | 2 | 0.017 |
| Neo Mercazole Tabl 5 mg | 114 | 27 | 23 | 105 | 21 | 20 | 9 | 0.081 |
| Nexium MUPS 40 Tabl 40 mg | 77 | 25 | 5 | 59 | 22 | 8 | 18 | 0.304 |
| Torem 10 Tabl 10 mg | 256 | 52 | 36 | 55 | 78 | 214 | 201 | 3.640 |
| Dafalgan Filmtabl 1 g | 30 | 13 | 3 | 45 | 11 | 6 | −15 | −0.334 |
| Co-Amoxicillin Sandoz Disp Tabl 1 g | 6 | 8 | 1 | −10 | 8 | 4 | 15 | 1.572 |
| Irfen 400 Lactabs 400 mg | −26 | 16 | 17 | −20 | 20 | 10 | −6 | −0.287 |
| Tamsulosin eco Ret Kaps 0.4 mg | −93 | 15 | 6 | −93 | 15 | 9 | −1 | −0.008 |
| Perindopril Sandoz Tabl 4 mg | −146 | 97 | 27 | −96 | 74 | 43 | −50 | −0.524 |
| Perenterol Kaps 250 mg | −550 | 152 | 106 | −529 | 138 | 63 | −21 | −0.040 |
HU = Hounsfield units; ROI = region of interest; SD = standard deviation
The standard deviation of pixel density in the ROI (noise) reflects inhomogeneity of the pharmacological product. These indirect signs of homogeneity varied from 9 to 1592 HU among the different pills (at 120 kVp). On average, noise scored 100 ± 236 HU.
The absolute average HU increase per pill when changing to the lower voltage was 78 ± 253 HU. When this absolute density was standardised to the original 120 kVp density (delta HU/120 kVp HU), the average relative density increase was 13.8 ± 61%. Only 30 of the 46 pills showed an increase in density when the voltage was decreased. Fifteen pills demonstrated a density decrease, whereas one pill had no density change, leading to a linear fitting line with a slope of 0.21 as a constant variable in the density spectroscopy (fig. 4). The ranking of the relative density change is given in table 2. The density of Eltroxin did not change and stayed at 252 HU. All of the medications that are listed above Eltroxin demonstrated an increased density for lower voltages. The medications listed below Eltroxin showed a decrease in density (table 2).
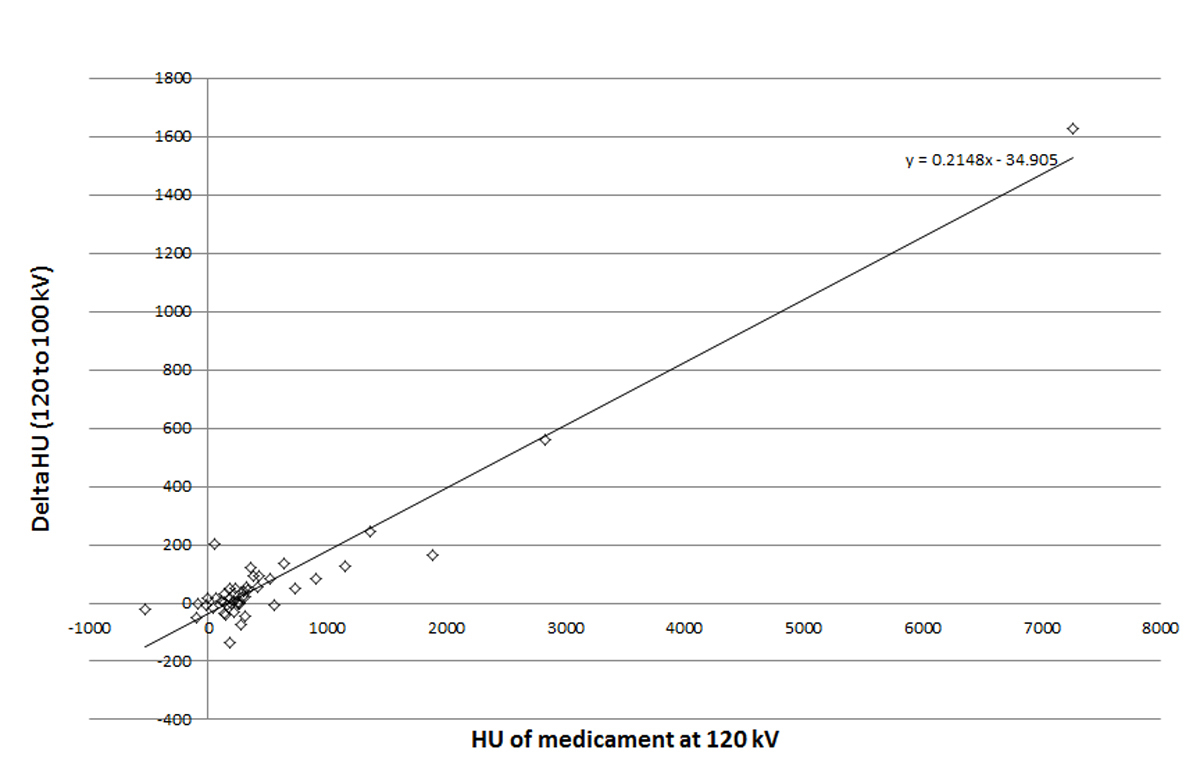
Figure 4 Spectroscopic increase of HU at lower tube voltage.
Table 2 Medicaments with negative delta (lower HU with lower kV [tube voltage]).
|
HU
100 kV |
SD ROI (noise) | SD Readers |
HU
120 kV |
SD ROI (noise) | SD Readers | Difference HU | Relative delta (to original HU at 120 kV) | |
|---|---|---|---|---|---|---|---|---|
| Primperan Tabl 10 mg | 44 | 114 | 213 | 181 | 32 | 23 | −137 | −0.758 |
| Prednison Streuli Tabl 5 mg | 196 | 119 | 112 | 269 | 16 | 22 | −73 | −0.271 |
| Perindopril Sandoz Tabl 4 mg | −146 | 97 | 27 | −96 | 74 | 43 | −50 | −0.524 |
| Acidum Folicum Streuli Tabl 5 mg | 260 | 11 | 19 | 305 | 36 | 20 | −45 | −0.147 |
| Zolpidem Filmtabl 10 mg | 103 | 98 | 215 | 144 | 82 | 151 | −41 | −0.283 |
| Beloc Zok 100 Ret Tabl 100 mg | 104 | 43 | 42 | 139 | 23 | 6 | −35 | −0.251 |
| Aspirin Cardio 100 Filmtabl 100 mg | 186 | 41 | 48 | 216 | 11 | 13 | −30 | −0.138 |
| Perenterol Kaps 250 mg | −550 | 152 | 106 | −529 | 138 | 63 | −21 | −0.040 |
| Dafalgan Filmtabl 1 g | 30 | 13 | 3 | 45 | 11 | 6 | −15 | −0.334 |
| Flagyl Tabl 500 mg | 153 | 18 | 7 | 161 | 14 | 6 | −8 | −0.048 |
| Amlodipin Tabl 10 mg Spirig HC | 548 | 60 | 47 | 555 | 68 | 50 | −7 | −0.012 |
| Irfen 400 Lactabs 400 mg | −26 | 16 | 17 | −20 | 20 | 10 | −6 | −0.287 |
| Valverde Schlaf Filmtabl | 197 | 22 | 5 | 199 | 21 | 17 | −1 | −0.007 |
| Marcoumar Tabl 3 mg | 257 | 59 | 92 | 258 | 119 | 63 | −1 | −0.004 |
| Tamsulosin eco Ret Kaps 0.4 mg | −93 | 15 | 6 | −93 | 15 | 9 | −1 | −0.008 |
| Eltroxin−LF Tabl 0.1 mg | 252 | 8 | 24 | 252 | 29 | 30 | 0 | 0.000 |
| Candesartan Tabl 16 mg | 250 | 6 | 16 | 250 | 23 | 23 | 0 | 0.001 |
HU = Hounsfield units; ROI = region of interest; SD = standard deviation
The HU and CT spectroscopy values are valid only as long as the pills are not dissolved (in hydrochloric acid). In addition to disintegration of the HU, a dissolving pill had blurred margins and loss of shape and contour (fig. 5). Each pill’s individual duration of integrity is marked in green in table S1 (appendix 1, available in a separate file for downloading); the red fields indicate the time when the pills were first dissolved. Twenty-one medicaments had already dissolved after 5 minutes in hydrochloric acid and another 10 after 30 minutes; 11 pills were intact for 2 hours or longer (up to 4 days, table S1). HU values from both scans at 100 kVp (table S2) and 120 kVp are reported for the entire duration of the experiment, since CT spectroscopy of pill sedimentation can theoretically still be used after decomposition (in a laboratory environment and without bowel movements).
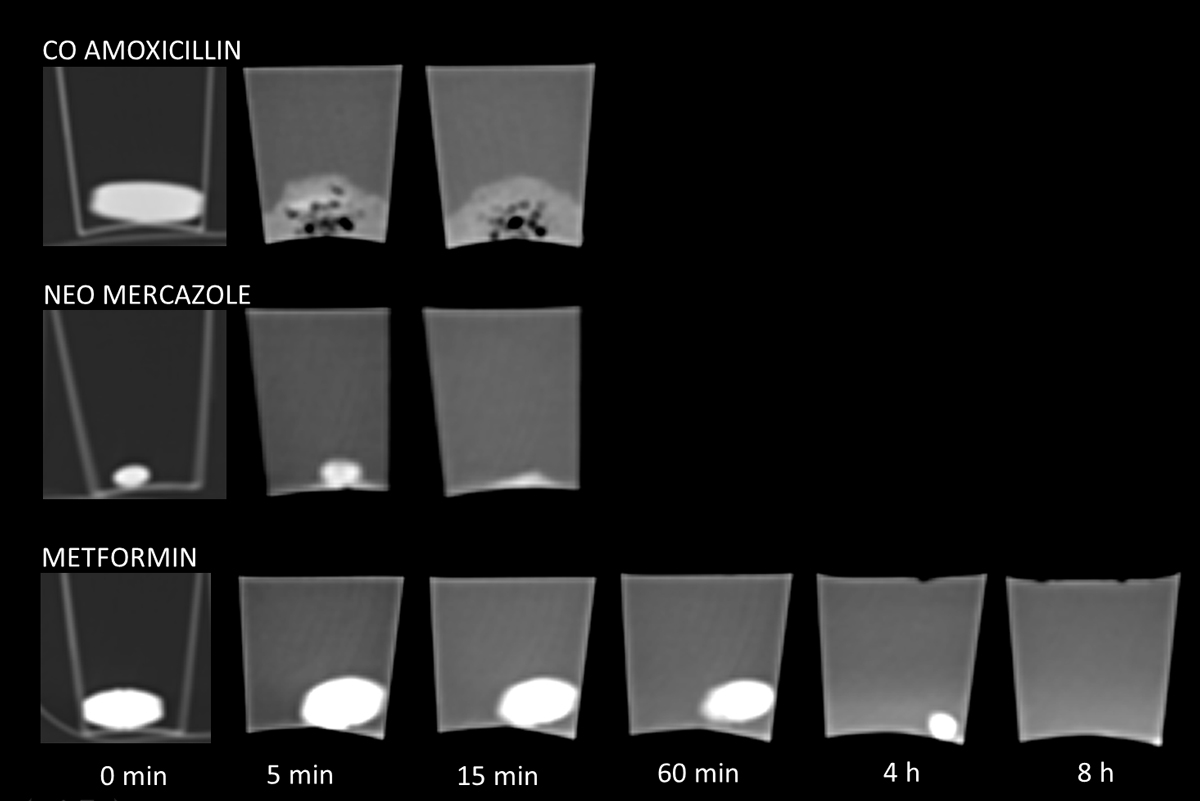
Figure 5 Dissolution process of medicaments in hydrochloric acid (pH 2): Co-Amoxicillin was already dissolved after 5 min (note the small black air bubbles during the decay). Neo Mecazole was still intact after 5 min and dissolved after 15 min. Metformin demonstrated the same shape and density over 60 min and was dissolving after 4 hours. Note the hyperdense liquid in the cup at 8 hours.
The agreement between readers for all measurements of experiment 1 was almost perfect, with a correlation coefficient r of 0.9902 (95% confidence interval [CI] 0.9869–0.9927; p <0.0001). The intra-reader variability was very low, with a correlation coefficient r of 0.9986 (95% CI 0.9979–0.9991; p <0.0001) for reader 1 and r = 0.9895 (95% CI 0.9842–0.9931; p <0.0001) for reader 2.
The aim of the study was to report the density of selected drugs and provide a reference for radiologists in their everyday practice. Our results showed that each of the selected drugs had different X-ray absorption, thus facilitating their assessment in the gastrointestinal tract. These differences result in differences in image densities, which, in addition to their size and shape, should allow the differentiation of medicines from other potential foreign bodies in the gastrointestinal tract, e.g., stones [12–14] and bezoars [15–18]. The pills could easily be measured on abdominal CT images and could be compared with the attenuation and noise of typical medications, as listed in table 1, to narrow down the possible identity of the agent.
The high inter- and intra-rater agreements, with an almost perfect correlation, confirm the good repeatability, and this method is suitable for use by radiologically untrained physicians. Any clinician can look at routine CT images and determine if the correct pill was taken, another pill was taken, or too many pills were taken (compliance). The time of decomposition of each pill is an important variable for identifying medicaments within the human body. For instance, Nexium MUPS 40 mg decomposed within 5 minutes and can be generally excluded when an intact pill is detected in the small bowel. The same applied for many medicaments, and some dissolved over hours; Flagyl 500 mg or Dafalgan 1g were still intact at the end of the experiment (after 4 days). These latter medicaments are designed to dissolve in the small intestine, have an anti-acid protective coating, and would probably dissolve faster in pH >7 (bile). HU of both scans for 100 and 120 kVp are reported for the entire duration of the experiment, since CT spectroscopy of pill sedimentation can theoretically still be used after decomposition (in a laboratory environment and without bowel movements).
The proposed characterisation aimed to facilitate better diagnostics and interpretation of radiological results, leading to better patient treatment. Another important aspect is the qualitative and quantitative assessment of drugs in patients who have attempted or completed suicide. No-one would routinely perform an additional scan to calculate the spectroscopic behaviour of the ingested pills, but in post-mortem CT studies [19] the radiation dose is less important and a scan could help identify the ingested substance prior to autopsy. Post-mortem imaging might help narrow down the possible causes of death. Aghayev et al. demonstrated hyperattenuating gastric content in cases of suicide by medication intoxication, with densities from 88 to 338 HU as the pills were dissolving.
The phantom technique that was used to identify the composition of substances is often used in diagnostic radiology because it ties together the study environment and the human environment without harmful radiation exposure. Using a CT scanner with dose optimisation, one abdominal CT spiral exposes patients to an average radiation dose below 200 mGycm; after the weighting factor for the abdomen is applied this gives an average equivalent dose of 2mSv for low dose CT [20]. The risk of cancer death due to this scan / radiation dose is 1:10 000 [21]. Maybe in future, with steady technical improvement, an ultra-low dose CT scan can be used for comprehensive compliance measurement.
However, these results should be interpreted in light of several limitations. The medicaments were examined only in air and a simulated gastric acid milieu. Depending on the gastric passage time, the pills would come into contact with alkaline bile and pancreatic enzymes, which could alter the decomposition time. Further experiments need to address the decomposition of medicaments in a changing environment. We did not assess the influence of temperature and bowel movements, which could have a direct impact on the pill’s macroscopic and chemical structure, and could thus change its density. During the assessment, the patients’ individual differences must also be considered, e.g., hyper- or hypoacidity, interaction with other drugs, or other physical and chemical factors that might compromise the pill’s absorption of ionising radiation. During dissolution into liquefied parts the density decreases, starting in the periphery and sparing the centre. For practical reasons, the authors suggest measuring the pills or the remainder of the pills in the bowel several times, with smaller ROIs in the centre of the pill and using only the highest measured attenuation. However, these assumptions must be addressed in future trials. Our results are only valid for exactly the same medications with the same dosages and from the same vendor. Generic medications or other concentrations of the medications might demonstrate other attenuations. If this method of substance characterisation proves useful in the future, pharmaceutical substances could be labelled with their standard attenuation coefficients and which could thus serve as an identifier.
Our data suggest that measuring the attenuation of drugs on CT images, including the homogeneity, and applying CT spectroscopy can narrow down possible identities of the most frequent medications. Other clinicians and forensic pathologists can perform this easy measurement, as the intra- and inter-reader variability is very small.
The supplementary tables are available as a separate file for downloading at: https://smw.ch/en/article/doi/smw.2018.14585/
No financial support and no other potential conflict of interest relevant to this article was reported.
1 Hinkel CL . The significance of opaque medications in the gastrointestinal tract, with special reference to enteric coated pills. Am J Roentgenol Radium Ther. 1951;65(4):575–81.
2 Handy CA . Radiopacity of oral nonliquid medications. Radiology. 1971;98(3):525–33. doi:.https://doi.org/10.1148/98.3.525
3 Staple TW , McAlister WH . Roentgenographic visualization of iron preparations in the gastrointestinal tract. Radiology. 1964;83(6):1051–6. doi:.https://doi.org/10.1148/83.6.1051
4 O’Brien RP , McGeehan PA , Helmeczi AW , Dula DJ . Detectability of drug tablets and capsules by plain radiography. Am J Emerg Med. 1986;4(4):302–12. doi:.https://doi.org/10.1016/0735-6757(86)90298-6
5 Savitt DL , Hawkins HH , Roberts JR . The radiopacity of ingested medications. Ann Emerg Med. 1987;16(3):331–9. doi:.https://doi.org/10.1016/S0196-0644(87)80182-8
6 Aghayev E , Jackowski C , Christe A , Thali M . Radiopaque stomach contents in postmortem CT in suicidal oral medication intoxication: report of three cases. J Forensic Leg Med. 2010;17(3):164–8. doi:.https://doi.org/10.1016/j.jflm.2009.10.001
7 Johnson TRC . Dual-energy CT: general principles. AJR Am J Roentgenol. 2012;199(5, Suppl):S3–8. doi:.https://doi.org/10.2214/AJR.12.9116
8 Nicolaou S , Yong-Hing CJ , Galea-Soler S , Hou DJ , Louis L , Munk P . Dual-energy CT as a potential new diagnostic tool in the management of gout in the acute setting. AJR Am J Roentgenol. 2010;194(4):1072–8. doi:.https://doi.org/10.2214/AJR.09.2428
9 Hidas G , Eliahou R , Duvdevani M , Coulon P , Lemaitre L , Gofrit ON , et al. Determination of renal stone composition with dual-energy CT: in vivo analysis and comparison with x-ray diffraction. Radiology. 2010;257(2):394–401. doi:.https://doi.org/10.1148/radiol.10100249
10 Boll DT , Patil NA , Paulson EK , Merkle EM , Simmons WN , Pierre SA , et al. Renal stone assessment with dual-energy multidetector CT and advanced postprocessing techniques: improved characterization of renal stone composition--pilot study. Radiology. 2009;250(3):813–20. doi:.https://doi.org/10.1148/radiol.2503080545
11 Feldman M , Barnett C . Fasting gastric pH and its relationship to true hypochlorhydria in humans. Dig Dis Sci. 1991;36(7):866–9. doi:.https://doi.org/10.1007/BF01297133
12 Chen AL , Liu AL , Wang S , Liu JH , Ju Y , Sun MY , et al. Detection of gallbladder stones by dual-energy spectral computed tomography imaging. World J Gastroenterol. 2015;21(34):9993–8. doi:.https://doi.org/10.3748/wjg.v21.i34.9993
13 Yang CB , Zhang S , Jia YJ , Duan HF , Ma GM , Zhang XR , et al. Clinical application of dual-energy spectral computed tomography in detecting cholesterol gallstones from surrounding bile. Acad Radiol. 2017;24(4):478–82. doi:.https://doi.org/10.1016/j.acra.2016.10.006
14 Li H , He D , Lao Q , Chen X , Liu M , Yin B , et al. Clinical value of spectral CT in diagnosis of negative gallstones and common bile duct stones. Abdom Imaging. 2015;40(6):1587–94. doi:.https://doi.org/10.1007/s00261-015-0387-y
15 Tatekawa Y , Nakatani K , Ishii H , Paku S , Kasamatsu M , Sekiya N , et al. Small bowel obstruction caused by a medication bezoar: report of a case. Surg Today. 1996;26(1):68–70. doi:.https://doi.org/10.1007/BF00311997
16 Hunt-Fugate AK , Schmidt HJ . Cecal vitamin bezoar formation inducing abdominal discomfort. Ann Pharmacother. 1992;26(4):485–7. doi:.https://doi.org/10.1177/106002809202600405
17 Bernstein G , Jehle D , Bernaski E , Braen GR . Failure of gastric emptying and charcoal administration in fatal sustained-release theophylline overdose: pharmacobezoar formation. Ann Emerg Med. 1992;21(11):1388–90. doi:.https://doi.org/10.1016/S0196-0644(05)81907-9
18 Reid T , Rubins JB , Levine J , DeCelles J , Silvis S . Colonic medication bezoar from extended-release nifedipine and procainamide. Arch Fam Med. 1995;4(8):715–7. doi:.https://doi.org/10.1001/archfami.4.8.715
19 Thali MJ , Yen K , Schweitzer W , Vock P , Boesch C , Ozdoba C , et al. Virtopsy, a new imaging horizon in forensic pathology: virtual autopsy by postmortem multislice computed tomography (MSCT) and magnetic resonance imaging (MRI)--a feasibility study. J Forensic Sci. 2003;48(2):386–403. doi:.https://doi.org/10.1520/JFS2002166
20 Kim K , Kim YH , Kim SY , Kim S , Lee YJ , Kim KP , et al. Low-dose abdominal CT for evaluating suspected appendicitis. N Engl J Med. 2012;366(17):1596–605. doi:.https://doi.org/10.1056/NEJMoa1110734
21National Council on Radiation Protection and Measurements. Report No. 115 – Risk estimations for radiation protection. Bethesda, MD: NRCP; 1993.
No financial support and no other potential conflict of interest relevant to this article was reported.