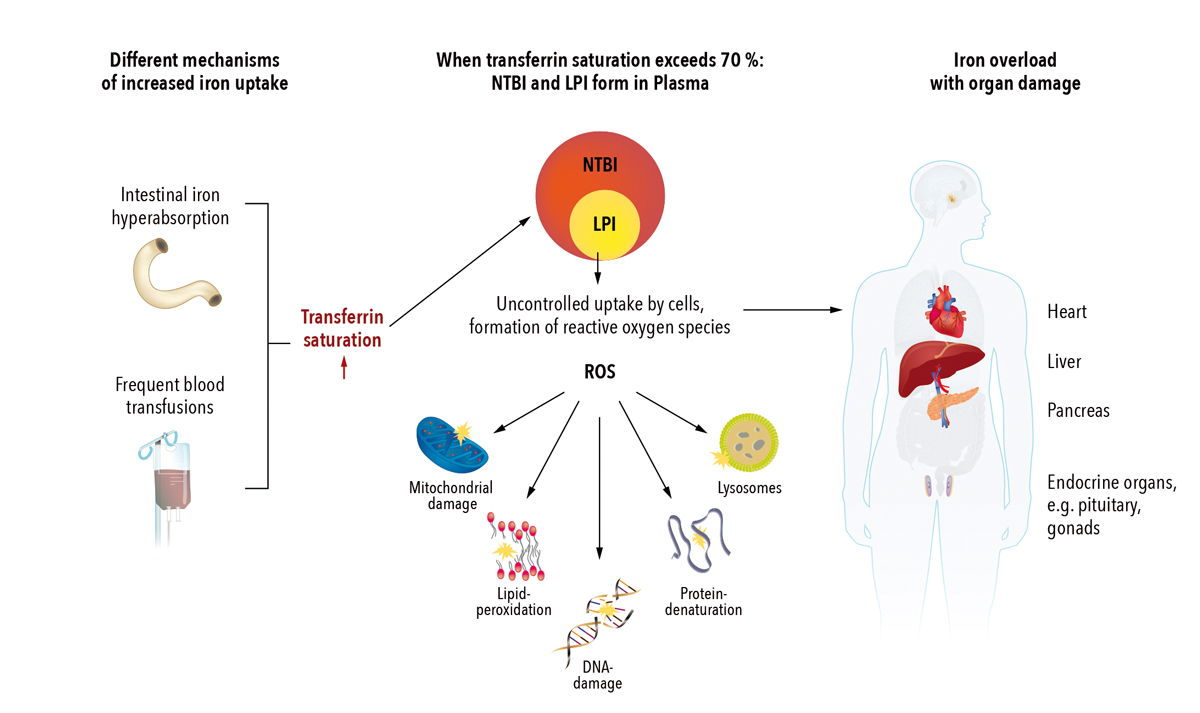
Figure 1 Pathophysiology of iron overload and resulting organ damage (simplified) [6–8].
NTBI = non transferrin bound iron; LPI = labile plasma iron; ROS = reactive oxygen species
DOI: https://doi.org/10.4414/smw.2017.14550
dry weight
gradient echo
liver iron concentration
magnetic resonance imaging
packed red blood cells
signal intensity ratio
Thalassaemia International Federation
Iron is essential for many cellular functions in the human body. The majority of iron required for the primary needs of the body is recycled from senescent red blood cells by the reticuloendothelial system. Under physiological conditions iron metabolism is kept within a narrow range. Dietary iron is absorbed in small amounts (about 1–2 mg/day) by duodenal enterocytes. Almost the same iron amount is lost by sloughing of gastrointestinal mucosa, skin cells and blood loss [1].
After being taken up in the gut, iron circulates in the blood bound to the carrier protein transferrin prior to intracellular use and storage. Approximately 80% of total body iron is functional and utilised by the bone marrow for erythropoiesis or located in myoglobin or iron-containing enzymes. The remaining 20% is mainly stored in the intracellular depot proteins ferritin and haemosiderin, a partially denatured form of ferritin. The liver serves as the primary iron storage organ, but ferritin can also be stored in the spleen and bone marrow. Ferritin facilitates the mobilisation of iron depending on the requirements of the body. The circulating serum ferritin pool mostly arises from the liver and the reticuloendothelial cells [1, 2].
Hepcidin mediates the homeostasis of extracellular iron concentrations. If the liver senses elevated transferrin saturation, it secrets hepcidin, which binds to the iron exporter ferroportin and induces its internalisation and degradation. Thus, the influx of iron from the gut and the reticuloendothelial system in the plasma is reduced and intestinal iron absorption is downregulated. Systemic iron requirements and infectious as well as inflammatory stimuli modulate hepcidin expression [3, 4].
The body has no active mechanism to excrete iron. Therefore, if excessive iron is absorbed, systemic iron overload can develop [1, 5]. When transferrin saturation exceeds 70%, toxic non-transferrin bound iron forms [6]. The redox active fraction of non-transferrin bound iron, labile plasma iron, can be taken up by cells outside the physiological iron-controlling mechanisms, which leads to the formation of toxic oxygen radicals (reactive oxygen species). This results in damage to cell membranes, proteins and DNA [7]. The most sensitive organs to suffer iron overload are the liver, endocrine organs and, importantly, the heart (fig. 1) [2, 9].
Figure 1 Pathophysiology of iron overload and resulting organ damage (simplified) [6–8].
NTBI = non transferrin bound iron; LPI = labile plasma iron; ROS = reactive oxygen species
Hyperferritinaemia is a frequent clinical problem. Elevated serum ferritin levels can occur in many different genetic and acquired diseases with or without concurrent anaemia (table 1) [4, 10–12]. Hyperferritinaemia may be caused for instance by chronic disease, renal insufficiency with haemodialysis, or bone marrow failure syndromes as well as by malignancy, or chronic inflammation of diverse aetiologies. In these patients iron overload is usually not present and therefore diagnosis and management of the disorders that contribute to hyperferritinaemia are indicated.
Table 1 Common disorders associated with hyperferritinaemia [4, 10–12].
| Hyperferritinaemia without anaemia | Hyperferritinaemia with anaemia (with and without blood transfusions) |
|---|---|
| Hereditary haemochromatosis Hereditary hyperferritinaemia-cataract syndrome Acute infection/inflammation/autoimmune disorders Injury to ferritin-containing tissues (e.g., in liver diseases) Metabolic syndrome Early after intravenous iron substitution |
Myelodysplastic syndromes Haemoglobinopathies e.g., thalassaemia Anaemia of chronic disease Sideroblastic anaemias Macrophage activation syndrome Hypo-/atransferrinaemia Aceruloplasminaemia Haemodialysis Cancer |
In other patients, hyperferritinaemia may result from iron overload due to intestinal iron hyperabsorption, ineffective erythropoiesis, or other reasons such as impaired iron transport (table 2) [2, 7, 9, 13]. In addition, multiple blood transfusions are an important cause for iron overload [2, 7]. Since each unit of packed red blood cells (PRBC) contains 200–250 mg iron [9, 15, 16], transfusion therapy increases iron stores to many times the normal range.
Table 2 Frequent mechanisms and disorders of iron overload [2, 4, 7, 11, 13, 14].
| Increased intestinal iron absorption | Frequent transfusions of PRBCs | Others |
|---|---|---|
|
Impaired hepcidin–ferroportin axis
Hereditary haemochromatosis |
Thalassaemia major Sickle cell disease Diamond Blackfan anaemia Myelodysplastic syndromes Myelofibrosis Aplastic anaemia Anaemia before or after stem cell transplantation |
Chronic liver disease Impaired iron transport Aceruloplasminaemia Mutations of the divalent metal transporter 1 Hypo-/atransferrinaemia African iron overload Haemolytic anaemia Dietary or intravenous iron supplementation |
|
Iron loading anaemias with ineffective erythropoiesis
Thalassaemia intermedia (NTDT) Congenital sideroblastic anaemia Congenital dyserythropoietic anaemia |
NTDT = non-transfusion dependent thalassaemia, PRBC = packed red blood cells
In myelodysplastic syndromes, both ineffective erythropoiesis and multiple transfusions can be involved in the development of iron overload. Due to an ageing population, the importance of myelodysplastic syndromes is expected to increase over the next decades [17]. As in other acquired anaemias PRBC transfusions are a key part of the supportive therapy of myelodysplastic syndromes. In patients with genetic haemoglobin disorders such as thalassaemia, ineffective erythropoiesis, increased gastrointestinal iron absorption and multiple blood transfusions may lead to hyperferritinaemia and iron overload [18, 19]. Prevalence of thalassaemia are highest in south-eastern and southern Asia, the Middle East, Mediterranean countries, and North and Central Africa [18, 19]. However, the number of patients and the impact on healthcare systems in Europe are increasing due to migration trends, which is also affecting Switzerland. Intestinal iron hyperabsorption disorders leading to iron overload include hereditary haemochromatosis and iron-loading anaemias. Hereditary haemochromatosis is the most common genetic disorder in Caucasians and mostly seen in northern Europe. Increased intestinal absorption of dietary iron results from inadequate or ineffective hepcidin-mediated down-regulation of ferroportin. In the most common type 1 hereditary haemochromatosis, iron overload is associated with the C282Y homozygous genotype or with compound heterozygosity for C282Y and H63D. In hereditary haemochromatosis types 1, 2 and 3 excess iron usually accumulates first in the liver [2, 11, 13, 20]. In iron loading anaemias (table 2) iron hyperabsorption is caused by ineffective erythropoiesis [4].
In clinical practice it is essential to differentiate iron overload from other causes of hyperferritinaemia. Current approaches to quantify and monitor iron homeostasis and iron overload include measurement of serum ferritin and transferrin saturation as well as assessment of liver iron concentration (LIC) (table 3) [16]. Since the liver contains 70% or more of body iron stores and LIC correlates with the total body iron load, assessment of LIC has been proposed to support further diagnostic and therapeutic workup. LIC can be determined by both biopsy and magnetic resonance imaging (MRI). In contrast to biopsy, liver MRI cannot directly assess iron deposits, but indirectly infers iron overload by measuring changes in the MR signal relaxation of the tissue surrounding the deposit [16, 31, 35]. The entire liver is measured and there is a correlation with tissue iron content. Liver MRI is useful for longitudinal measurements. LIC assessment by biopsy is limited in particular by its invasiveness, there is the risk of sampling error due to sample size, and it is impractical for longitudinal measurements [4].
Table 3 Thresholds for iron parameters, adapted from [21, 22].
| Parameter | Iron overload | ||
|---|---|---|---|
| Normal | Mild/moderate | Severe | |
| Serum ferritin (ng/ml) [23, 24] | <400 | >1000–2500 | >2500 |
| Transferrin saturation (%) | 20–45 | 55–70 in men; 50–70 in women |
>80 |
| Liver iron concentration (mg/g dw) [19, 25–28] | <1.8 (Levels of up to 7 seen in some non-thalassaemic populations without apparent adverse effects) |
7–15 (increased risk of iron induced complications) |
>15 (increased risk of cardiac disease and death) |
| Liver T2* MRI (ms) [22, 29, 30] | >6.3 | <6.3 | <1.4 |
| Cardiac MRI, T2* (ms) [31–34] | >20 | 10-20 | <10 |
Dw = dry weight; MRI = magnetic resonance imaging. MRI was performed on a 1.5 Tesla scanner.
In this review article, the authors, a group of Swiss haematologists and radiologists, give an overview on different diagnostic methods to assess hyperferritinaemia focusing on the role of liver MRI. Furthermore, the article summarises international guideline recommendations as well as the standard practice in Switzerland on the use of liver MRI for the diagnosis and monitoring of iron homeostasis in patients with the most common forms of iron overload – haemochromatosis, thalassaemia major and myelodysplastic syndromes.
Assessment of serum ferritin is easily available, inexpensive and therefore used worldwide to estimate iron stores. Serum ferritin generally correlates with total body iron stores [19]. It serves as an indirect measure of iron overload, particularly if serial measurements are performed to overcome the sometimes significant serum ferritin fluctuations [36]. However, this parameter has some important clinical limitations. Although serum ferritin values >1000 ng/ml indicate iron overload, serum ferritin levels may not correlate closely and in a linear manner with liver and cardiac iron load [9]. Serum ferritin can be influenced by various factors such as malignancy, liver disease and ascorbate deficiency. In addition, serum ferritin is an acute phase reactant and rises with inflammation. Serum ferritin rates also depend on the transfusion rate and disease characteristics [9, 36–38].
In hereditary haemochromatosis, serum ferritin is a highly sensitive indicator of iron overload when confounding factors are absent. Normal serum ferritin levels usually – with rare exceptions – rule out hereditary haemochromatosis [39]. In thalassaemia major and myelodysplastic syndromes, serum ferritin is useful for identifying trends of iron loading and for monitoring iron chelation therapy, despite its limitations. In this setting, it is best to check serum ferritin frequently (every 3–6 weeks). Serum ferritin trends should be linked to the gold standard assessment of iron burden where possible [36, 40].
Transferrin saturation is a widely available serologic marker of iron balance. Reported alongside hyperferritinaemia, it can be useful to provide information on the existence of iron overload [4, 8]. In hereditary haemochromatosis, transferrin saturation is the most specific key screening marker. However, just like serum ferritin, transferrin saturation does not quantitatively reflect body iron stores and should not be used as a surrogate marker for tissue iron overload in hereditary haemochromatosis [12, 20, 39]. Moreover, transferrin saturation is influenced by a number of patient-related factors and is not suitable for follow-up assessments due to intra- and inter-laboratory variability.
Transferrin saturation can be used as an indicator to initiate iron chelation therapy in chronically transfused patients. However, many patients have fully saturated transferrin, making it uninformative for short and mid-term assessment of iron chelation therapy efficiency. In addition, transferrin saturation values cannot be interpreted during iron chelation therapy, which should therefore be suspended for at least one day before analysis [3, 36].
Liver biopsy is a quantitative, specific and sensitive method that provides a direct assessment of LIC. Although in experienced hands liver biopsy is safe, it carries a risk of complications of approx. 0.5%. Risks include bile peritonitis or bleeding due to haemoperitoneum, pericholecystic haematoma, or kidney haematoma [41]. In addition, high sampling variability due to biopsy specimen size heterogeneity or unequal distribution of iron in the liver can lead to misinterpretations [16, 36, 42, 43]. Despite its limitations, liver biopsy can identify and determine the degree of iron overload. In addition, it is of value for the assessment of liver tissue damage such as fibrosis, cirrhosis and necroinflammation [9]. In hereditary haemochromatosis, liver biopsy used to be the gold-standard diagnostic test before the availability of HFE genotyping. In the differential diagnosis of hyperferritinaemia, liver biopsy may be useful to prove the presence of iron overload or to identify secondary causes of iron overload e.g., non-alcoholic steatosis hepatitis [39].
Due to its invasiveness and poor acceptance by patients, liver biopsy was never fully acknowledged as a standard of care in iron loading and transfusion-dependent anaemias such as thalassaemia major and myelodysplastic syndromes. In these disorders, non-invasive techniques for LIC estimation have been established based on iron’s magnetic properties [21, 36, 40]. Today, MRI dominates LIC quantification and can be considered the standard of care in LIC assessment in the majority of patients. MRI offers both non-invasive LIC assessment and worldwide availability [21, 36]. Additionally, MRI may also provide information on the fibrotic stage of the liver, potentially identifying patients who still require biopsy for histological analysis [9]. Differences between LIC assessment by biopsy and MRI are listed in table 4.
Table 4 Comparison of LIC assessment by liver biopsy and MRI [9, 41, 44].
| Liver biopsy | LIC by MRI |
|---|---|
| Invasive method that offers direct assessment of LIC | Non-invasive technique that offers indirect LIC measurement |
| Little acceptance by patients | Well accepted by patients |
| Validated reference standard Variability due to biopsy sample size and different iron deposition in the liver possible Inadequate standardisation across laboratories |
Comparable accuracy to liver biopsy |
| Histopathology of the liver can be obtained | Entire liver can be measured Gives information on the fibrotic stage of the liver and can potentially identify patients who require biopsy for histologic analysis Parallel assessment of liver and heart possible (dependent on technique) |
| Impractical for longitudinal assessment/monitoring | Good tool for serial evaluations |
LIC = liver iron concentration; MRI = magnetic resonance imaging
The following is a brief and simplified presentation of the MRI principles needed to understand the basics of MRI-based iron measurement. More complete but still accessible descriptions of MRI physics for physicians can be found in excellent reviews [45–47]. Clinical MRI scanners generate images in which the signal originates from the hydrogen nucleus consisting of a single proton with a magnetic property called nuclear spin. Under certain conditions, the hydrogen proton can absorb energy from radiofrequency pulses. The various rates of the protons to dissipate the absorbed energy and to return to equilibrium can be measured to create an image. The parameters mostly used to describe this process are the relaxation times T1, T2 and T2*. During T1 relaxation (also called longitudinal relaxation), protons exchange energy with their surroundings to return to their basal state. Iron accumulation in tissue has a weak effect on T1 relaxation time [45], explaining why it is rarely used for iron quantification. T2 relaxation (also called transverse relaxation) describes the loss of coherence of the nuclear spin population due to random energy exchange. T2* relaxation combines T2 relaxation with the effects of inhomogeneity in the main magnetic field.
For the measurement of iron content using MRI, T2 and T2* are of particular interest because they reflect the magnetic properties of the microstructure and are both decreased in presence of superparamagnetic molecules such as ferritin and haemosiderin. As a result, the MRI signal decays faster in iron overloaded organs [36, 40]. MRI techniques probe iron concentrations indirectly by measuring the effect of iron on hydrogen nuclear spins. Basically, there are three different technical MRI approaches: T2 and T2* relaxometry, also referred to as T2- and T2*-mapping, and also the signal intensity ratio (SIR) [2, 9, 36, 48], that are all associated with specific advantages and disadvantages (table 5).
Table 5 Advantages and disadvantages of available MRI LIC assessment methods [3, 25, 44, 49–51].
| FerriScan® R2 LIC | R2* LIC | SIR LIC | |
|---|---|---|---|
| Advantages | Strong validation evidence High quality control High dynamic range (0–43 mg/g) Robust to metal artefacts |
Strong validation evidence Rapid (<1 minute examination time) Temporal stability Single breath-hold technique Suitable also for the heart and other organs |
Strong validation evidence Wide availability Qualitative assessment possible directly from the images Free software 5 breath-hold technique |
| Disadvantages | Longer examination time necessary (10 minutes/exam) High costs Sensitivity to iron distribution Breathing artefacts possible (vulnerable to ghosting) Not suitable for the heart |
Smaller dynamic range (0–35 mg/g) by comparison with R2 Variable quality control, local expertise necessary Validated software required Can be affected by metal artefacts |
Poor dynamic range Greater variability Not suitable for the heart |
LIC = liver iron concentration; SIR = signal intensity ratio
Relaxometry or mapping are considered the standard of care for measuring iron content [2, 9]. It is based on quantification of relaxation time T2 or T2* by means of measuring signal decay at various echo times. For T2 measurement, spin echo techniques are used, while for T2*, gradient echo sequences are typically applied. The relaxation time, measured in milliseconds, is derived from algorithms based on monoexponential fits. The procedure of measuring T2 and T2* is also referred to as T2- and T2*-mapping. For convenience, the reciprocal of the relaxation times T2 and T2*, R2 and R2* (in Hz) are frequently used for LIC (R2 = 1/T2; R2* = 1/T2*) [9, 49]. Both R2 and R2* are directly proportional to liver iron concentration, whilst T2 and T2* are inversely proportional i.e., the greater the iron concentration, the higher the R2 and R2* and the smaller the T2 and T2* relaxation times [3, 49].
There are different companies that provide imaging and analysis software solutions for R2 and R2* analysis. Almost all MR scanners can perform R2* mapping from multi echo MRI datasets without the need to export data for off-line use. Some centres also use software developed in-house that requires cross-validation with established techniques prior to clinical use [49].
FerriScan®, one specific liver R2 acquisition and analysis protocol, has been approved as a clinical device in the USA [49]. The R2 FerriScan® method is an outsourced, standardised image analysis method based on the T2 relaxation time using relatively long spin echo MR sequences [25, 52]. Its main advantages are convenience and high quality control including technician training manuals, scanning of a test object, strict checks of sequence parameters, and inspection of image quality. FerriScan® is a chargeable service run by a private company and costs €250–300 per examination [3].
R2* relaxometry of the liver and the heart are based on fast gradient echo MR sequences and can therefore be done in the same session. When examinations are performed at shorter than annual intervals, R2* is more responsive to fluctuations in liver iron distribution and shows better temporal stability [53]. Depending on the MRI scanner gradient system, liver R2* mapping can only measure LIC levels up to 35 or 40 mg/g. To calculate R2*, dedicated software is necessary, which is provided by all MRI vendors and some independent companies [3].
There are some differences between R2 and R2*. R2 methods take about 10 minutes and are thus vulnerable to ghosting while R2* measurements can be performed in a single breath-hold. In contrast, R2 techniques are insensitive to external metal or gas artefacts whilst R2* methods can be influenced by these factors. R2 shows a wider range of measurable LIC than R2* [49]. Cardiac iron assessment by MRI can be performed during the same examination as liver R2*- or T2*-mapping. In addition, cardiac function can be determined during the same examination [9, 32, 54]. Further differences of R2 FerriScan® and R2* are listed in table 5.
Both R2 and R2* are robust and instrument-independent estimators of LIC and produce highly accurate non-invasive estimates of hepatic iron [44]. Calibration relates to the mathematical association between MRI data and tissue iron concentration. Iron calibration curves are published for liver R2 and liver R2* [25, 44].
In liver R2, St Pierre et al. found high degrees of sensitivity (85–94%) and specificity (92–100%) of R2 to LIC by biopsy for clinical important LIC thresholds (1.8, 3.2, 7.0, and 15.0 mg/g) and a high correlation between R2 and biopsy (correlation coefficient r = 0.98) [25].
According to Wood et al., both R2 and R2* correlated closely with LIC from biopsies (r = 0.97 for R2, r = 0.98 for R2*) for LIC from 1.3 to 32.9 mg/g dry weight (dw) [44]. R2 had a curvilinear relationship to LIC by biopsy, which was similar to the curve generated by St. Pierre et al. despite differences in technique and instrumentation [25, 44]. Hankins et al. observed a strong correlation between liver R2* and LIC by biopsy (correlation coefficients, 0.96–0.98, analysed by three independent reviewers) [55].
R2 and R2* show excellent reproducibility and high inter-observer agreement [36, 50, 55]. Trends between the two methods correlate well, especially when compared over longer time scales. Both are suitable for LIC estimates in clinical practice and both are superior to invasive liver biopsy in indicating the effectiveness of iron chelation therapy [44]. The choice of liver iron measurement technique therefore primarily depends on availability of local expertise. FerriScan® remains a good option for centres with limited experience in LIC measurements, but T2* methods are generally preferred in centres routinely performing LIC measurements, as they offer high success rate, high interobserver agreement, the ability to detect changes in LIC over a wide range of LIC values, a single breath-hold acquisition, and are available from all major vendors without additional per-scan costs [31, 36, 50].
If possible, LIC MRI should be performed on 1.5 Tesla magnets because higher field strengths enable the detection of more susceptibility artefacts. R2 and R2* values rise with the strength of the magnetic field, requiring adjustment of calibration curves [3, 56]. Variability can result from variability in biopsy sample size. Also, liver iron distribution varies across individuals leading to patient-specific deviations between R2 and R2* and LIC. As individual LIC estimates do not agree perfectly, R2 and R2* must not be interchanged in the same patient [14, 57, 58].
SIR, a third MRI imaging technique, may be performed to identify patients with milder iron overload. In SIR, gradient echo (GRE) image series of the abdomen are collected in five breath-holds. Regions of interest are drawn in the liver and paraspinous muscles. To generate LIC estimates, the values can be entered into a free web-based calculation tool from the University of Rennes, France [3, 59]. Calibration was derived from liver biopsies and shown in a highly T2-weighted GRE (GRE T2++) sequence, with the highest sensitivity (89%) and specificity (80%) and a good correlation (r = 0.87) between liver to muscle (L/M) SIR and LIC [51].
SIR is one of the earlier methods to assess LIC that is easy to perform, but has a severe limitation as it is only robust for low iron concentrations [59]. However, it is a good adjunct to R2 and R2* methods as it allows easy visual estimation of LIC, which is not possible with either R2 or R2* methods (fig. 2). In addition, SIR approaches are an option for screening purposes in primary haemochromatosis syndromes, particularly if relaxometry is not feasible [3]. Therefore SIR cannot replace R2 or R2* relaxometry, which is now the standard of care for tissue iron quantification. However, it can be useful especially when the quality of the relaxometry data is poor.

Figure 2 Example of three different patients examined with the SIR method composed of the acquisition of five gradients of echo images with a progressive sensitivity to iron content (T1 on the left is less sensitive to iron and is therefore affected only by high LIC. T2*++ on the right is sensitive to very small amounts of iron). LIC can be assessed quickly by sight, because the signal of the normal liver should be iso- or hyperintense to paravertebral muscle signal on all five MR sequences. In the case of iron overload, the signal of the liver is darker compared to paravertebral muscles. In the first patient (upper row) with no hepatic iron overload, the liver is hyperintense or isointense compared to the muscle on all the MR sequences reflecting a normal LIC. The second patient has a mild hepatic iron overload demonstrated by a liver signal lower than the muscle only in the T2* MR sequences. The third patient (lower row) has a significant iron overload that can be easily identified on the images since the liver is darker than the paravertebral muscles in all the MR sequences.
In thalassaemia major, LIC represents total body iron stores quite well, but the majority of iron toxicity develops in extrahepatic tissues e.g., in the heart and endocrine organs, which have different mechanisms of iron uptake and removal than the liver, mainly through the uptake of non-transferrin bound iron [35, 60]. LIC has little predictive value for cardiac iron deposition and there is no LIC threshold below which no cardiac iron overload can develop. Iron chelation therapy removes iron more quickly from the liver than from the heart. Some patients develop progressive extrahepatic iron loading despite iron chelation therapy [32, 61]. Thus, it is necessary to assess both liver and heart iron in patients at risk [9].
The ability to detect extrahepatic iron deposition by MRI before the onset of symptoms has changed patient management. Before cardiac T2* mapping was available, iron cardiomyopathy was the leading cause of death in thalassaemia major [23]. Now patients with excess cardiac iron can be identified before they develop cardiac dysfunction [36]. A marked improvement in survival in thalassaemia major has been mainly driven by a reduction in deaths due to cardiac iron overload, most likely because of the introduction of T2* cardiac mapping to identify myocardial siderosis and appropriate intensification of iron chelation therapy, alongside other improvements in clinical care [62]. Cardiac T2* mapping is also successful at monitoring iron chelation therapy and was used to assess the benefit of chelator treatment [63].
Carpenter et al. compared cardiac R2* measurement with tissue iron concentration detected using inductively coupled plasma atomic emission spectroscopy in heart samples of transfusion-dependent patients after either death or transplantation for heart failure. They showed that myocardial iron measured by R2* is strongly correlated in a linear fashion with cardiac iron (R 2 = 0.910, p <0.001) [54]. For a long time, no calibration curves were available to convert cardiac T2* values to cardiac iron concentration, so cardiac iron is still frequently reported in T2* units without further conversion to iron concentration. The clinical community is used to interpreting the results [9].
Assessment of iron in other tissues, such as the pancreas and pituitary gland, is currently being explored. Since the pancreas accumulates iron earlier than the heart, assessment of pancreatic iron deposition could become an early predictor of cardiac iron overload [64].
The first diagnostic step to identify the cause of hyperferritinaemia is assessment of transferrin saturation ( fig. 3 ) [4, 10, 11, 13].
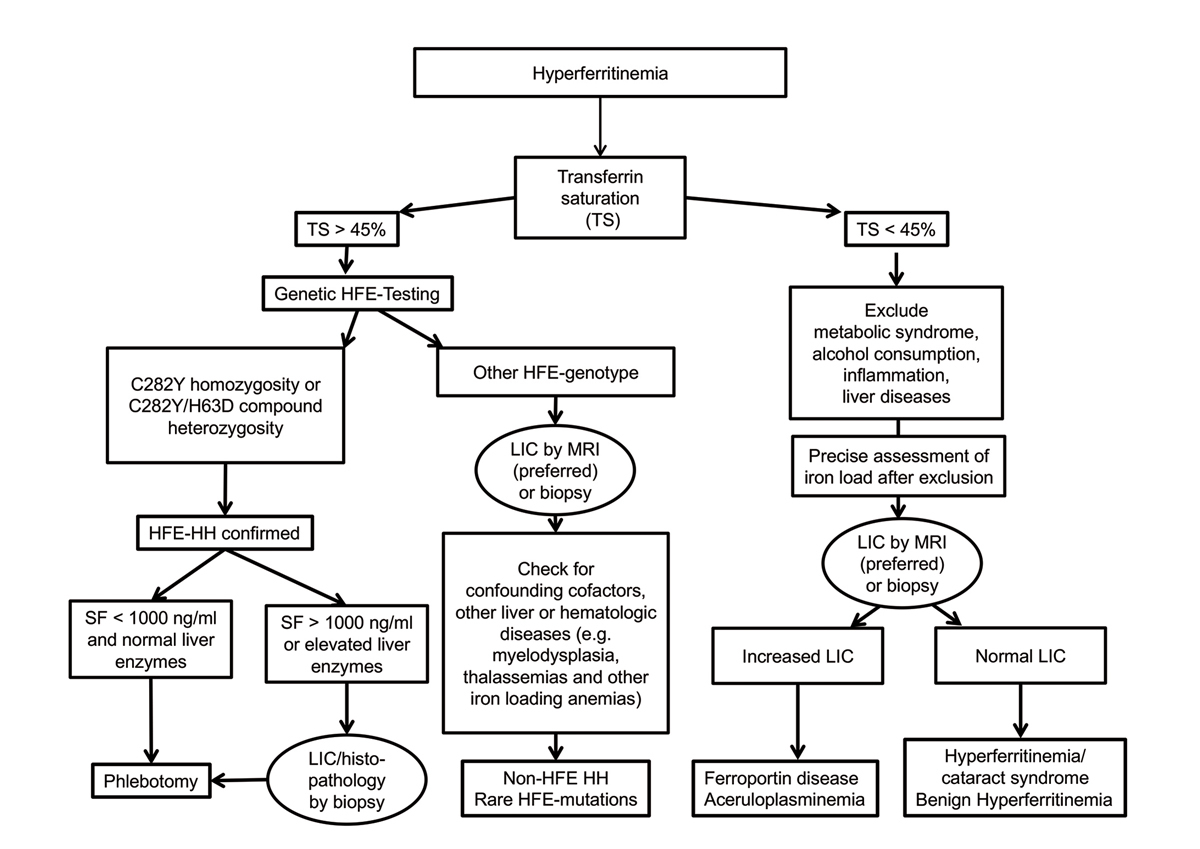
Figure 3 Algorithm for diagnostic workup of hyperferritinaemia, modified from [13, 39].
LIC = liver iron concentration; TS = transferrin saturation; MRI = magnetic resonance imaging; HH = hereditary haemochromatosis; SF = serum ferritin.
If transferrin saturation is increased (>45%), HFE testing should be performed. In patients with C282Y homozygosity or with C282Y/H63D compound heterozygosity, the diagnosis of HFE-hereditary haemochromatosis is confirmed. In these patients, therapy and monitoring are guided by serial serum ferritin measurements. If serum ferritin levels are higher than 1000 ng/ml and/or liver enzymes (alanine aminotransferase; aspartate aminotransferase) are elevated, liver biopsy is recommended for prognostic reasons to evaluate liver fibrosis or cirrhosis. Liver MRI may help to identify heterogeneous distribution of iron within the liver, differentiate parenchymal from mesenchymal iron overload, and detect small iron-free neoplastic lesions [39]. For all other HFE genotypes, comorbid factors, compensated iron-loading anaemias, and non-HFE hereditary haemochromatosis or rare HFE mutations should be considered. In this situation liver biopsy or LIC MRI may guide further diagnostics e.g., to rule out other liver diseases or to order genetic testing in the case of iron overload [13, 39].
If transferrin saturation is normal or low (<45%), common causes of hyperferritinaemia should be excluded such as metabolic syndrome, alcohol consumption, inflammation, and liver disease. After exclusion of these conditions, the precise assessment of hepatic iron load, either by LIC MRI or liver biopsy, may help to identify the cause of hyperferritinaemia. In patients with increased LIC, genetic testing for rare non-haemochromatotic genetic iron overload diseases such as ferroportin disease or aceruloplasminaemia can be considered. Genetic testing for non-HFE hereditary haemochromatosis forms is usually not recommended because it is performed in very few specialised laboratories only, is expensive, and usually does not add clinically useful information regarding treatment decisions. If LIC values are normal, genetic testing for hereditary hyperferritinaemia-cataract syndrome or benign hyperferritinaemia can be considered [39]. In all cases with normal LIC values, phlebotomy should be avoided as there is no evidence of iron overload despite hyperferritinaemia.
The following case vignettes illustrate diagnostic approaches to patients with hyperferritinaemia in the haematology department of a large tertiary Swiss hospital using Liver MRI and LIC measurements.
During a routine check-up in a male patient, an serum ferritin value of 1,779 ng/mL was observed. Transferrin saturation was 70%, genetic hereditary haemochromatosis testing revealed H63D homozygosity. In MRI R2 normal LIC values were found (1.3 mg/g dw, fig. 4). Due to elevated alanine aminotransferase (136 U/l) a gastroenterological evaluation was performed that showed hepatic steatosis. Finally, secondary hyperferritinaemia without the presence of iron overload was diagnosed, probably due to non-alcoholic fatty liver disease / non-alcoholic steatosis hepatitis.
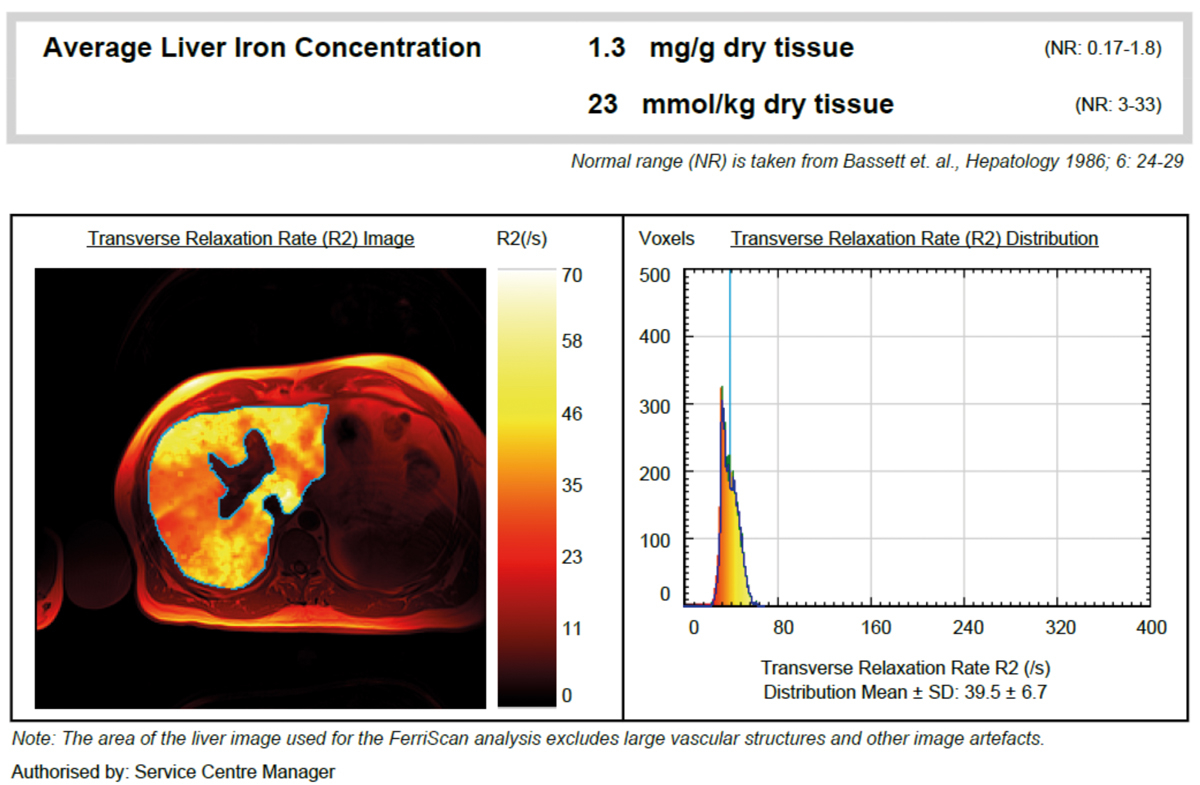
Figure 4 Exclusion of iron overload in a patient with H63D homozygosity by MRI R2.
Conclusion: In this patient with H63D homozygosity, MRI could exclude iron overload in the liver and indicated the presence of a secondary cause of hyperferritinaemia. Following an algorithm-based diagnostic approach (see fig. 3) provides an answer to the clinical question on the aetiology of hyperferritinaemia. This case illustrates that, despite suspected iron overload, patients can have secondary hyperferritinaemia even in the presence of increased transferrin saturation.
In a woman with myelodysplastic syndrome (RCMD-RS according to the WHO 2008 classification, first diagnosis February 2014, MDS-RS-MLD according to the WHO 2017 classification) serum ferritin at the time of first diagnosis was 329 ng/ml. Initially, treatment with darbepoetin alfa was commenced and no transfusions were required. During the course of the disease the patient became transfusion dependent. After transfusion of 20 PRBCs, a serum ferritin of 1795 ng/ml and transferrin saturation of 100% were observed. LIC MRI R2 showed a 3-fold elevated LIC (5.2 mg/g dw, fig. 5), which led to the diagnosis of hyperferritinaemia due to iron overload. Iron chelation therapy with deferasirox was started.
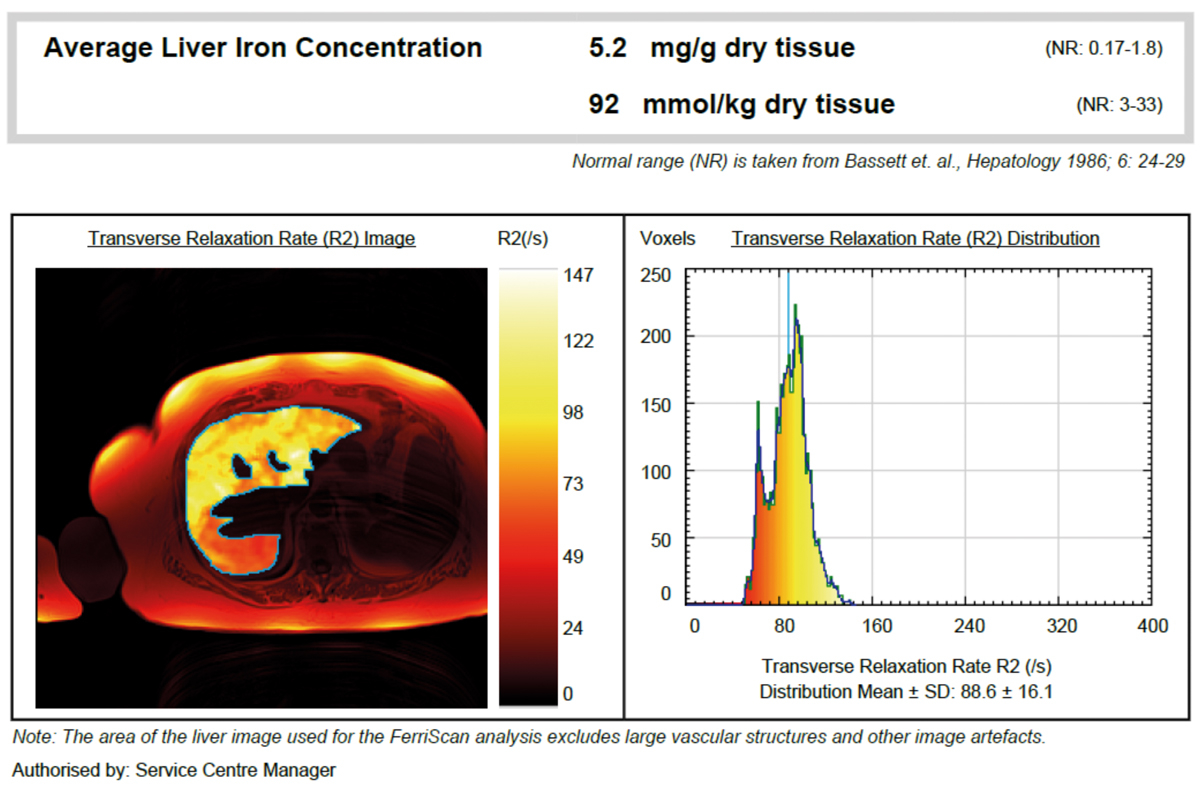
Figure 5 Confirmation of iron overload in a patient with myelodysplastic syndrome by MRI R2.
Conclusion: In this patient with myelodysplastic syndrome, serum ferritin values were moderately elevated, but MRI results showed a marked liver iron overload requiring iron chelation therapy.
Most of our understanding of iron-overload monitoring and treatment arises from studies in transfusion-dependent thalassaemias such as thalassaemia major [36]. In clinical practice, regular MRI assessment is performed not only to determine the degree of iron overload, but also to gain information on initiation and adjustment of iron chelation therapy [9].
Transfusion-dependent thalassaemia patients who have received >10 units of PRBCs may already qualify for initiation of iron chelation therapy. In this case, an initial LIC MRI scan could be performed in order to quantify the exact iron burden before starting treatment. LIC determination by MRI is also useful to establish a baseline in patients with elevated or rising serum ferritin levels and prior to the start or a change of iron chelation therapy [9]. In many thalassaemia centres, LIC is measured annually to guide iron chelation therapy. MRI should be performed repeatedly if trends in serum ferritin are incongruent with reported patient compliance or other clinical assessments [49].
Normal LIC values in transfusion-dependent thalassaemias are up to 1.8 mg/g dw [9, 40]. LIC >7 mg/g dw was identified as an indication to start iron chelation therapy in transfusional iron overload [16, 26]. Very high LIC levels (>15 mg/g dw) are associated with liver fibrosis progression and cardiac iron deposit, and appear to have prognostic value [16, 25, 27, 40, 65, 66].
Chronically transfused patients should undergo cardiac T2* assessment. Cardiac iron accumulation is rare in patients with transfusion-dependent thalassaemias who have received <70 PRBCs. Transfusion-dependent thalassaemia patients with cardiac T2* values over 20 ms have normal cardiac iron. Decreasing cardiac T2* values correspond with iron accumulation and a rising risk of cardiac dysfunction [9, 33]. Cardiac T2* <10 ms is the most important predictor of heart failure development [33]. Based on these data, a “stoplight” risk paradigm is frequently applied, with T2* ≤10 ms considered the red (danger) zone, T2* of 10-20 ms the yellow (cautionary) zone, and T2* ≥20 milliseconds the green (safe) zone [31]. Thus, a T2* value <10 ms is often used as a marker for more aggressive iron chelation therapy.
Myelodysplastic syndrome patients show a high rate of hepatic iron overload [67]. However, serum ferritin, liver and heart iron do not necessarily correlate. In myelodysplastic syndromes, low-grade inflammation is also seen in some cases, making serum ferritin measurements less reliable. Although cardiac complications account for most non-leukaemic death in low-risk myelodysplastic syndromes, there is no sufficient evidence that these result from excess cardiac iron [15, 29, 30]. Additionally, myelodysplastic syndrome patients are older than transfusion-dependent thalassaemia patients and will often have pre-existing cardiac disease.
According to Shenoy et al., liver T2* MRI would be assessed reasonably after the transfusion of 20 PRBCs in myelodysplastic syndromes patients. Increased LIC and cardiac T2* MRI below-normal strongly suggest hepatic and cardiac iron overload, with the beginnings of iron chelation therapy in even mild forms of cardiac iron overload (e.g., cardiac T2* <20 ms) or when LIC reaches 3 mg/g dw. Although too insensitive and unspecific for the diagnosis of iron overload, changes in serum ferritin and transferrin saturation are still useful to monitor therapeutic efficacy [21].
Iron chelation therapy is effective in reducing liver and cardiac iron overload [68–70]. However, treatment adherence can be a problem as iron overload is often asymptomatic and many patients do not perceive direct benefits from iron chelation therapy. In these patients, periodic monitoring can be used to reinforce adherence by showing and discussing the images together. Increasing LIC values over time can demonstrate the need for better adherence to iron chelation therapy. Vice versa, decreasing LIC directly reflects therapeutic benefit and may support adherence [9].
Table 6 Recommendations on initiating and monitoring iron chelation therapy in transfusion-dependent thalassaemias [14, 19, 71, 72]; modified from [73].
| Guideline | Initiation of iron chelation | Monitoring of iron overload |
|---|---|---|
| Germany | • SF >1000 ng/ml, or • LIC >ULRR • After approx. 10–15 PRBCs |
• Periodic SF • LIC annually • Cardiac T2* annually (from the age of 10 years) |
| Italy | • SF >1000 ng/mL, or • 10 PRBCs, or • LIC R2 >ULRR (in patients >5 years with unknown transfusion history or inappropriate prior chelation) |
• Periodic SF • LIC annually • Cardiac T2* annually (in patients with poor chelation history or inadequate chelation therapy) |
| US | • SF ≥1000 ng/ml, or • LIC ≥3 mg/g dw |
• In patients with SF 1000–2500 ng/ml or LIC 3–7 mg/g dw → SF every 3 months • In patients with SF* >2500 ng/ml or LIC >7 mg/g dw → SF every 2–3 months → LIC within 6 months • In patients with excess cardiac iron without cardiac dysfunction; T2* <20 ms → SF every 2–3 months → LIC within 6 months • In patients with iron-induced cardiomyopathy, T2* <20 ms; or T2* <10 ms without cardiomyopathy → SF every 2–3 months → LIC within 6 months → cardiac function within 6 months |
| TIF | • SF >1000 ng/ml, or • 10–20 PRBCs |
• Serial SF • Sequential LIC • LIC useful, – if SF levels deviate from expected trend – when new chelating regimes are used – to identify whether the current regime is adequate or needs to be modified • Cardiac T2* annually |
dw = dry weight; LIC = liver iron concentration; PRBC = packed red blood cells; SF = serum ferritin; TIF = Thalassaemia International Federation; ULRR = upper limit of reference range
In Switzerland, there are no nationally accepted guidelines on diagnosis and clinical management of hyperferritinaemia. In the following, the authors, a group of Swiss experts in the field of haematology and radiology, present typical clinical practice in Switzerland. This is, in part, influenced by local expertise and individual experience.
A laboratory evaluation with serum ferritin and transferrin saturation is a reasonable initial approach to provide information on the existence of iron overload in patients with hyperferritinaemia. Serum ferritin, as an inexpensive and widely used technique, can track iron overload and the therapeutic response to iron removal therapies. However, due to their limitations, neither is suitable as a single monitoring instrument. The techniques should be combined with quantitative assessment of iron burden.
LIC measurement is the gold standard for the diagnosis of iron overload. Although specific and sensitive, liver biopsy is invasive and little accepted by patients, and should only be carried out in patients with hereditary haemochromatosis at serum ferritin >1000 ng/ml and elevated transaminases for prognostic reasons, i.e., to look for liver fibrosis or cirrhosis.
In hereditary haemochromatosis, especially in cases with no relevant co-morbidities, assessment of LIC is usually not recommended, since serum ferritin levels adequately reflect hepatic iron content and cardiac iron overload rarely occurs.
In patients with transfusion-dependent thalassaemias and myelodysplastic syndromes, assessment of LIC by MRI is the standard of care to identify and determine the degree of iron overload, as it is non-invasive, accurate, reproducible, suitable for longitudinal measurements and well accepted by patients. MRI with cardiac T2*-mapping is the standard to assess heart iron, although cardiac iron measurement is only important in thalassaemia major, where cardiac iron overload is the main clinical issue.
In thalassaemia major, good correlations between serum ferritin and LIC are observed, so MRI monitoring is only performed in patients with rising serum ferritin. In myelodysplastic syndromes, where the correlation of serum ferritin and LIC is poor, MRI LIC assessment is recommended annually to screen for the degree of iron overload and to commence and adjust iron chelation therapy if necessary in appropriate candidates for iron chelation therapy. In both groups, monitoring can be used to encourage adherence to iron chelation therapy.
There are some differences in MRI techniques. R2 and R2* analyses are both suitable to accurately assess LIC in case of good quality control. Currently there is no consensus on which technique should be preferred. The choice depends primarily on local availability and patient population. However, to get comparable results in the same patient, it is important to use the same MRI technique in subsequent visits.
The German guidelines on secondary iron overload in hereditary anaemias recommend assessment of LIC by MRI prior to chelation. During treatment, regular assessment of serum ferritin is recommended to monitor therapeutic efficacy and to adjust therapy. In addition, LIC should be measured annually for exact evaluation of iron overload and to confirm trends in serum ferritin. Repeated measurements should use the same method. Annual cardiac T2* assessment is recommended [14] from the age of 10 years. In transfusion-dependent thalassaemias, the Italian [71], the US [72] and the Thalassaemia International Federation (TIF) guidelines [19] also recommend serial measurements of serum ferritin to guide initiation or to monitor iron chelation therapy, mostly with a frequency of every three months. All guidelines recommend cardiac iron MRI assessment by T2* MRI and MRI LIC assessment, but there are different recommendations regarding frequency. TIF gives more general recommendations, but the Italian guidelines recommend annual checks [71], and the US and TIF guidelines recommend more frequent assessment in patients with values that indicate iron overload (table 6) [19, 72].
The current recommendation to initiate iron chelation therapy in appropriate myelodysplastic syndrome patients are based on the total number of blood transfusions and on elevated serum ferritin. Serum ferritin should be assessed at diagnosis of myelodysplastic syndrome and at regular intervals thereafter; in transfusion-dependent patients, this should be three to four times a year. Liver MRI is considered more precise and useful than serum ferritin, but not compulsory [74, 75]. T2* may be used to measure iron concentrations in cardiac and liver tissue [76].
Accurate evaluation and monitoring of iron overload has major implications regarding prognosis and quality of life. Serum ferritin and transferrin saturation are valuable screening instruments and help to identify patients with hyperferritinaemia and risk of iron overload. LIC MRI can guide further differential diagnosis by evaluating the presence of iron overload and by the detection of underlying conditions. As LIC MRI is non-invasive, accurate, reproducible and well accepted by the patients, it is suitable not only for the diagnosis of iron overload, but also for regular assessment of iron overload. It allows physicians to tailor therapy more individually in iron-chelated patients. Invasive LIC assessment by biopsy remains reserved for cases where histopathology is required.
We thank DP-Medsystems AG for providing medical writing support in the preparation of this manuscript.
The first draft of the manuscript was written by the first author. The manuscript was developed with medical writing assistance, which was funded by an unrestricted educational grant by Novartis Pharma Schweiz AG. All authors reviewed the manuscript repeatedly and are fully responsible for all content and for the decision to submit the manuscript for publication. All authors declare no actual or potential conflict of interest in relation to this article.
1 Andrews NC . Disorders of iron metabolism. N Engl J Med. 1999;341(26):1986–95. doi:.https://doi.org/10.1056/NEJM199912233412607
2 Hernando D , Levin YS , Sirlin CB , Reeder SB . Quantification of liver iron with MRI: state of the art and remaining challenges. J Magn Reson Imaging. 2014;40(5):1003–21. doi:.https://doi.org/10.1002/jmri.24584
3 Wood JC . Estimating tissue iron burden: current status and future prospects. Br J Haematol. 2015;170(1):15–28. doi:.https://doi.org/10.1111/bjh.13374
4 Fleming RE , Ponka P . Iron overload in human disease. N Engl J Med. 2012;366(4):348–59. doi:.https://doi.org/10.1056/NEJMra1004967
5 Hershko C , Link G , Cabantchik I . Pathophysiology of iron overload. Ann N Y Acad Sci. 1998;850(1 COOLEY'S ANEM):191–201. doi:.https://doi.org/10.1111/j.1749-6632.1998.tb10475.x
6 Piga A , Longo F , Duca L , Roggero S , Vinciguerra T , Calabrese R , et al. High nontransferrin bound iron levels and heart disease in thalassemia major. Am J Hematol. 2009;84(1):29–33. doi:.https://doi.org/10.1002/ajh.21317
7 Gattermann N , Rachmilewitz EA . Iron overload in MDS-pathophysiology, diagnosis, and complications. Ann Hematol. 2011;90(1):1–10. doi:.https://doi.org/10.1007/s00277-010-1091-1
8 Cabantchik ZI , Breuer W , Zanninelli G , Cianciulli P . LPI-labile plasma iron in iron overload. Best Pract Res Clin Haematol. 2005;18(2):277–87. doi:.https://doi.org/10.1016/j.beha.2004.10.003
9 Quinn CT , St Pierre TG . MRI Measurements of Iron Load in Transfusion-Dependent Patients: Implementation, Challenges, and Pitfalls. Pediatr Blood Cancer. 2016;63(5):773–80. doi:.https://doi.org/10.1002/pbc.25882
10 Ruefer A , Howell JP , Lange AP , et al. Hyperferritinämie und Eisenmangel – eine aussergewöhnliche Liaison. Schweiz Med Forum. 2011;11:87–8. Article in German.
11 Camaschella C , Poggiali E . Towards explaining “unexplained hyperferritinemia”. Haematologica. 2009;94(3):307–9. doi:.https://doi.org/10.3324/haematol.2008.005405
12 Adams PC , Barton JC . A diagnostic approach to hyperferritinemia with a non-elevated transferrin saturation. J Hepatol. 2011;55(2):453–8. doi:.https://doi.org/10.1016/j.jhep.2011.02.010
13 Bacon BR , Adams PC , Kowdley KV , Powell LW , Tavill AS ; American Association for the Study of Liver Diseases. Diagnosis and management of hemochromatosis: 2011 practice guideline by the American Association for the Study of Liver Diseases. Hepatology. 2011;54(1):328–43. doi:.https://doi.org/10.1002/hep.24330
14 Cario H , Grosse R , Janssen G , Jarisch A , Meerpohl J , Strauss G ; German hematology societies (GPOH and DGHO). S2-Leitlinie zur Diagnostik und Therapie der sekundären Eisenüberladung bei Patienten mit angeborenen Anämien [Guidelines for diagnosis and treatment of secondary iron overload in patients with congenital anemia]. Klin Padiatr. 2010;222(6):399–406. Article in German. doi:.https://doi.org/10.1055/s-0030-1265178
15 Malcovati L , Porta MG , Pascutto C , Invernizzi R , Boni M , Travaglino E , et al. Prognostic factors and life expectancy in myelodysplastic syndromes classified according to WHO criteria: a basis for clinical decision making. J Clin Oncol. 2005;23(30):7594–603. doi:.https://doi.org/10.1200/JCO.2005.01.7038
16 Porter JB . Practical management of iron overload. Br J Haematol. 2001;115(2):239–52. doi:.https://doi.org/10.1046/j.1365-2141.2001.03195.x
17Neukirchen J, Schoonen WM, Aul C, et al. Incidence and Prevalence of Patients with Myelodysplastic Syndromes (MDS) in Dusseldorf 1996-2005. ASH Annual Meeting Abstracts 2009;114:1774
18 Weatherall DJ . Hemoglobinopathies worldwide: present and future. Curr Mol Med. 2008;8(7):592–9. doi:.https://doi.org/10.2174/156652408786241375
19Cappellini MD, Cohen A, Porter J, et al. Guidelines for the management of transfusion dependent thalassaemia (TDT). Nicosia, Cyprus: Thalassaemia International Federation; 2014
20 Crownover BK , Covey CJ . Hereditary hemochromatosis. Am Fam Physician. 2013;87(3):183–90.
21 Shenoy N , Vallumsetla N , Rachmilewitz E , Verma A , Ginzburg Y . Impact of iron overload and potential benefit from iron chelation in low-risk myelodysplastic syndrome. Blood. 2014;124(6):873–81. doi:.https://doi.org/10.1182/blood-2014-03-563221
22 Leitch HA . Optimizing therapy for iron overload in the myelodysplastic syndromes: recent developments. Drugs. 2011;71(2):155–77. doi:.https://doi.org/10.2165/11585280-000000000-00000
23 Borgna-Pignatti C , Rugolotto S , De Stefano P , Zhao H , Cappellini MD , Del Vecchio GC , et al. Survival and complications in patients with thalassemia major treated with transfusion and deferoxamine. Haematologica. 2004;89(10):1187–93.
24 Olivieri NF , Nathan DG , MacMillan JH , Wayne AS , Liu PP , McGee A , et al. Survival in medically treated patients with homozygous beta-thalassemia. N Engl J Med. 1994;331(9):574–8. doi:.https://doi.org/10.1056/NEJM199409013310903
25 St Pierre TG , Clark PR , Chua-anusorn W , Fleming AJ , Jeffrey GP , Olynyk JK , et al. Noninvasive measurement and imaging of liver iron concentrations using proton magnetic resonance. Blood. 2005;105(2):855–61. doi:.https://doi.org/10.1182/blood-2004-01-0177
26 Olivieri NF , Brittenham GM . Iron-chelating therapy and the treatment of thalassemia. Blood. 1997;89(3):739–61.
27 Bassett ML , Halliday JW , Powell LW . Value of hepatic iron measurements in early hemochromatosis and determination of the critical iron level associated with fibrosis. Hepatology. 1986;6(1):24–9. doi:.https://doi.org/10.1002/hep.1840060106
28 Angelucci E , Giovagnoni A , Valeri G , Paci E , Ripalti M , Muretto P , et al. Limitations of magnetic resonance imaging in measurement of hepatic iron. Blood. 1997;90(12):4736–42.
29 Chacko J , Pennell DJ , Tanner MA , Hamblin TJ , Wonke B , Levy T , et al. Myocardial iron loading by magnetic resonance imaging T2* in good prognostic myelodysplastic syndrome patients on long-term blood transfusions. Br J Haematol. 2007;138(5):587–93. doi:.https://doi.org/10.1111/j.1365-2141.2007.06695.x
30 Di Tucci AA , Matta G , Deplano S , Gabbas A , Depau C , Derudas D , et al. Myocardial iron overload assessment by T2* magnetic resonance imaging in adult transfusion dependent patients with acquired anemias. Haematologica. 2008;93(9):1385–8. doi:.https://doi.org/10.3324/haematol.12759
31 Wood JC . Impact of iron assessment by MRI. Hematology (Am Soc Hematol Educ Program). 2011;2011(1):443–50. doi:.https://doi.org/10.1182/asheducation-2011.1.443
32 Anderson LJ , Holden S , Davis B , Prescott E , Charrier CC , Bunce NH , et al. Cardiovascular T2-star (T2*) magnetic resonance for the early diagnosis of myocardial iron overload. Eur Heart J. 2001;22(23):2171–9. doi:.https://doi.org/10.1053/euhj.2001.2822
33 Kirk P , Roughton M , Porter JB , Walker JM , Tanner MA , Patel J , et al. Cardiac T2* magnetic resonance for prediction of cardiac complications in thalassemia major. Circulation. 2009;120(20):1961–8. doi:.https://doi.org/10.1161/CIRCULATIONAHA.109.874487
34 Pennell DJ . T2* magnetic resonance and myocardial iron in thalassemia. Ann N Y Acad Sci. 2005;1054(1):373–8. doi:.https://doi.org/10.1196/annals.1345.045
35 Angelucci E , Brittenham GM , McLaren CE , Ripalti M , Baronciani D , Giardini C , et al. Hepatic iron concentration and total body iron stores in thalassemia major. N Engl J Med. 2000;343(5):327–31. doi:.https://doi.org/10.1056/NEJM200008033430503
36 Wood JC . Guidelines for quantifying iron overload. Hematology (Am Soc Hematol Educ Program). 2014;2014(1):210–5. doi:.https://doi.org/10.1182/asheducation-2014.1.210
37 Anderson LJ , Westwood MA , Prescott E , Walker JM , Pennell DJ , Wonke B . Development of thalassaemic iron overload cardiomyopathy despite low liver iron levels and meticulous compliance to desferrioxamine. Acta Haematol. 2006;115(1-2):106–8. doi:.https://doi.org/10.1159/000089475
38 Fischer R , Harmatz PR . Non-invasive assessment of tissue iron overload. Hematology (Am Soc Hematol Educ Program). 2009;2009(1):215–21. doi:.https://doi.org/10.1182/asheducation-2009.1.215
39 European Association For The Study Of The Liver. EASL clinical practice guidelines for HFE hemochromatosis. J Hepatol. 2010;53(1):3–22. doi:.https://doi.org/10.1016/j.jhep.2010.03.001
40 Hoffbrand AV , Taher A , Cappellini MD . How I treat transfusional iron overload. Blood. 2012;120(18):3657–69. doi:.https://doi.org/10.1182/blood-2012-05-370098
41 Angelucci E , Baronciani D , Lucarelli G , Baldassarri M , Galimberti M , Giardini C , et al. Needle liver biopsy in thalassaemia: analyses of diagnostic accuracy and safety in 1184 consecutive biopsies. Br J Haematol. 1995;89(4):757–61. doi:.https://doi.org/10.1111/j.1365-2141.1995.tb08412.x
42 Villeneuve JP , Bilodeau M , Lepage R , Côté J , Lefebvre M . Variability in hepatic iron concentration measurement from needle-biopsy specimens. J Hepatol. 1996;25(2):172–7. doi:.https://doi.org/10.1016/S0168-8278(96)80070-5
43 Emond MJ , Bronner MP , Carlson TH , Lin M , Labbe RF , Kowdley KV . Quantitative study of the variability of hepatic iron concentrations. Clin Chem. 1999;45(3):340–6.
44 Wood JC , Enriquez C , Ghugre N , Tyzka JM , Carson S , Nelson MD , et al. MRI R2 and R2* mapping accurately estimates hepatic iron concentration in transfusion-dependent thalassemia and sickle cell disease patients. Blood. 2005;106(4):1460–5. doi:.https://doi.org/10.1182/blood-2004-10-3982
45 Haacke EM , Cheng NY , House MJ , Liu Q , Neelavalli J , Ogg RJ , et al. Imaging iron stores in the brain using magnetic resonance imaging. Magn Reson Imaging. 2005;23(1):1–25. doi:.https://doi.org/10.1016/j.mri.2004.10.001
46 Plewes DB , Kucharczyk W . Physics of MRI: a primer. J Magn Reson Imaging. 2012;35(5):1038–54. doi:.https://doi.org/10.1002/jmri.23642
47 Currie S , Hoggard N , Craven IJ , Hadjivassiliou M , Wilkinson ID . Understanding MRI: basic MR physics for physicians. Postgrad Med J. 2013;89(1050):209–23. doi:.https://doi.org/10.1136/postgradmedj-2012-131342
48 St Pierre TG , Clark PR , Chua-Anusorn W . Measurement and mapping of liver iron concentrations using magnetic resonance imaging. Ann N Y Acad Sci. 2005;1054:379–85. doi:.https://doi.org/10.1196/annals.1345.046
49 Wood JC . Use of magnetic resonance imaging to monitor iron overload. Hematol Oncol Clin North Am. 2014;28(4):747–64, vii. doi:.https://doi.org/10.1016/j.hoc.2014.04.002
50 Runge JH , Akkerman EM , Troelstra MA , Nederveen AJ , Beuers U , Stoker J . Comparison of clinical MRI liver iron content measurements using signal intensity ratios, R 2 and R 2. Abdom Radiol (NY). 2016;41(11):2123–31. doi:.https://doi.org/10.1007/s00261-016-0831-7
51 Gandon Y , Olivié D , Guyader D , Aubé C , Oberti F , Sebille V , et al. Non-invasive assessment of hepatic iron stores by MRI. Lancet. 2004;363(9406):357–62. doi:.https://doi.org/10.1016/S0140-6736(04)15436-6
52 St Pierre TG , El-Beshlawy A , Elalfy M , Al Jefri A , Al Zir K , Daar S , et al. Multicenter validation of spin-density projection-assisted R2-MRI for the noninvasive measurement of liver iron concentration. Magn Reson Med. 2014;71(6):2215–23. doi:.https://doi.org/10.1002/mrm.24854
53 Wood JC , Zhang P , Rienhoff H , Abi-Saab W , Neufeld EJ . Liver MRI is more precise than liver biopsy for assessing total body iron balance: a comparison of MRI relaxometry with simulated liver biopsy results. Magn Reson Imaging. 2015;33(6):761–7. doi:.https://doi.org/10.1016/j.mri.2015.02.016
54 Carpenter JP , He T , Kirk P , Roughton M , Anderson LJ , de Noronha SV , et al. On T2* magnetic resonance and cardiac iron. Circulation. 2011;123(14):1519–28. doi:.https://doi.org/10.1161/CIRCULATIONAHA.110.007641
55 Hankins JS , McCarville MB , Loeffler RB , Smeltzer MP , Onciu M , Hoffer FA , et al. R2* magnetic resonance imaging of the liver in patients with iron overload. Blood. 2009;113(20):4853–5. doi:.https://doi.org/10.1182/blood-2008-12-191643
56 Alam MH , Auger D , McGill LA , Smith GC , He T , Izgi C , et al. Comparison of 3 T and 1.5 T for T2* magnetic resonance of tissue iron. J Cardiovasc Magn Reson. 2016;18(1):40. doi:.https://doi.org/10.1186/s12968-016-0259-9
57 Wood JC , Zhang P , Rienhoff H , Abi-Saab W , Neufeld E . R2 and R2* are equally effective in evaluating chronic response to iron chelation. Am J Hematol. 2014;89(5):505–8. doi:.https://doi.org/10.1002/ajh.23673
58 Garbowski MW , Carpenter JP , Smith G , Roughton M , Alam MH , He T , et al. Biopsy-based calibration of T2* magnetic resonance for estimation of liver iron concentration and comparison with R2 Ferriscan. J Cardiovasc Magn Reson. 2014;16(1):40. doi:.https://doi.org/10.1186/1532-429X-16-40
59 Gandon Y , Guyader D , Heautot JF , Reda MI , Yaouanq J , Buhé T , et al. Hemochromatosis: diagnosis and quantification of liver iron with gradient-echo MR imaging. Radiology. 1994;193(2):533–8. doi:.https://doi.org/10.1148/radiology.193.2.7972774
60 Oudit GY , Sun H , Trivieri MG , Koch SE , Dawood F , Ackerley C , et al. L-type Ca2+ channels provide a major pathway for iron entry into cardiomyocytes in iron-overload cardiomyopathy. Nat Med. 2003;9(9):1187–94. doi:.https://doi.org/10.1038/nm920
61 Noetzli LJ , Carson SM , Nord AS , Coates TD , Wood JC . Longitudinal analysis of heart and liver iron in thalassemia major. Blood. 2008;112(7):2973–8. doi:.https://doi.org/10.1182/blood-2008-04-148767
62 Modell B , Khan M , Darlison M , Westwood MA , Ingram D , Pennell DJ . Improved survival of thalassaemia major in the UK and relation to T2* cardiovascular magnetic resonance. J Cardiovasc Magn Reson. 2008;10(1):42. doi:.https://doi.org/10.1186/1532-429X-10-42
63 Pennell DJ , Porter JB , Piga A , Lai YR , El-Beshlawy A , Elalfy M , et al.; CORDELIA study investigators. Sustained improvements in myocardial T2* over 2 years in severely iron-overloaded patients with beta thalassemia major treated with deferasirox or deferoxamine. Am J Hematol. 2015;90(2):91–6. doi:.https://doi.org/10.1002/ajh.23876
64 Noetzli LJ , Papudesi J , Coates TD , Wood JC . Pancreatic iron loading predicts cardiac iron loading in thalassemia major. Blood. 2009;114(19):4021–6. doi:.https://doi.org/10.1182/blood-2009-06-225615
65 Brittenham GM , Griffith PM , Nienhuis AW , McLaren CE , Young NS , Tucker EE , et al. Efficacy of deferoxamine in preventing complications of iron overload in patients with thalassemia major. N Engl J Med. 1994;331(9):567–73. doi:.https://doi.org/10.1056/NEJM199409013310902
66 Telfer PT , Prestcott E , Holden S , Walker M , Hoffbrand AV , Wonke B . Hepatic iron concentration combined with long-term monitoring of serum ferritin to predict complications of iron overload in thalassaemia major. Br J Haematol. 2000;110(4):971–7. doi:.https://doi.org/10.1046/j.1365-2141.2000.02298.x
67 Roy NB , Myerson S , Schuh AH , Bignell P , Patel R , Wainscoat JS , et al. Cardiac iron overload in transfusion-dependent patients with myelodysplastic syndromes. Br J Haematol. 2011;154(4):521–4. doi:.https://doi.org/10.1111/j.1365-2141.2011.08749.x
68 Pennell DJ , Porter JB , Cappellini MD , Chan LL , El-Beshlawy A , Aydinok Y , et al. Deferasirox for up to 3 years leads to continued improvement of myocardial T2* in patients with β-thalassemia major. Haematologica. 2012;97(6):842–8. doi:.https://doi.org/10.3324/haematol.2011.049957
69 Cappellini MD , Bejaoui M , Agaoglu L , Canatan D , Capra M , Cohen A , et al. Iron chelation with deferasirox in adult and pediatric patients with thalassemia major: efficacy and safety during 5 years’ follow-up. Blood. 2011;118(4):884–93. doi:.https://doi.org/10.1182/blood-2010-11-316646
70 Gattermann N , Finelli C , Porta MD , Fenaux P , Ganser A , Guerci-Bresler A , et al.; EPIC study investigators. Deferasirox in iron-overloaded patients with transfusion-dependent myelodysplastic syndromes: Results from the large 1-year EPIC study. Leuk Res. 2010;34(9):1143–50. doi:.https://doi.org/10.1016/j.leukres.2010.03.009
71 Angelucci E , Barosi G , Camaschella C , Cappellini MD , Cazzola M , Galanello R , et al. Italian Society of Hematology practice guidelines for the management of iron overload in thalassemia major and related disorders. Haematologica. 2008;93(5):741–52. doi:.https://doi.org/10.3324/haematol.12413
72Vichinsky E, Levine L. Standards of care guidelines for thalassemia. Oakland: Children's Hospital and Research Center; 2012
73 Musallam KM , Angastiniotis M , Eleftheriou A , Porter JB . Cross-talk between available guidelines for the management of patients with beta-thalassemia major. Acta Haematol. 2013;130(2):64–73. doi:.https://doi.org/10.1159/000345734
74 Bennett JM ; MDS Foundation’s Working Group on Transfusional Iron Overload. Consensus statement on iron overload in myelodysplastic syndromes. Am J Hematol. 2008;83(11):858–61. doi:.https://doi.org/10.1002/ajh.21269
75National Comprehensive Cancer Network. Myelodysplastic Syndromes. NCCN Clinical Practice Guidelines in Oncology; 2017
76 Greenberg PL , Rigsby CK , Stone RM , Deeg HJ , Gore SD , Millenson MM , et al. NCCN Task Force: Transfusion and iron overload in patients with myelodysplastic syndromes. J Natl Compr Canc Netw. 2009;7(Suppl 9):S1–16. doi:.https://doi.org/10.6004/jnccn.2009.0082
The first draft of the manuscript was written by the first author. The manuscript was developed with medical writing assistance, which was funded by an unrestricted educational grant by Novartis Pharma Schweiz AG. All authors reviewed the manuscript repeatedly and are fully responsible for all content and for the decision to submit the manuscript for publication. All authors declare no actual or potential conflict of interest in relation to this article.