First trimester combined screening for preeclampsia and small for gestational age – a single centre experience and validation of the FMF screening algorithm
DOI: https://doi.org/10.4414/smw.2017.14498
Beatrice
Mosimanna, Chantal
Pfiffnerb, Sofia
Amylidi-Mohra, Lorenz
Rischc, Daniel
Surbeka, Luigi
Raioa
aDepartment of Obstetrics and Gynaecology, University Hospital, University of Bern, Switzerland
bUniversity of Bern, Switzerland
cDivision of Clinical Chemistry, Labormedizinisches Zentrum Dr. Risch, Bern, Switzerland
Summary
AIM OF THE STUDY
Preeclampsia (PE) is associated with severe maternal and fetal morbidity in the acute presentation and there is increasing evidence that it is also an important risk factor for cardiovascular disease later in life. Therefore, preventive strategies are of utmost importance. The Fetal Medicine Foundation (FMF) London recently developed a first trimester screening algorithm for placenta-related pregnancy complications, in particular early onset preeclampsia (eoPE) requiring delivery before 34 weeks, and preterm small for gestational age (pSGA), with a birth weight <5th percentile and delivery before 37 weeks of gestation, based on maternal history and characteristics, and biochemical and biophysical parameters. The aim of this study was to test the performance of this algorithm in our setting and to perform an external validation of the screening algorithm.
MATERIAL AND METHODS
Between September 2013 and April 2016, all consecutive women with singleton pregnancies who agreed to this screening were included in the study. The proposed cut-offs of ≥1:200 for eoPE, and ≥1:150 for pSGA were applied. Risk calculations were performed with Viewpoint® program (GE, Mountainview, CA, USA) and statistical analysis with GraphPad version 5.0 for Windows.
RESULTS
1372 women agreed to PE screening; the 1129 with complete data and a live birth were included in this study. Nineteen (1.68%) developed PE: 14 (1.24%) at term (tPE) and 5 (0.44%) preterm (pPE, <37 weeks), including 2 (0.18%) with eoPE. Overall, 97/1129 (8.6%) screened positive for eoPE, including both pregnancies that resulted in eoPE and 4/5 (80%) that resulted in pPE. Forty-nine of 1110 (4.41%) pregnancies without PE resulted in SGA, 3 (0.27%) of them in pSGA. A total of 210/1110 (18.9%) non-PE pregnancies screened positive for pSGA, including 2/3 (66.7%) of the pSGA deliveries and 18/46 (39.1%) of term SGA infants.
CONCLUSION
Our results show that first trimester PE screening in our population performs well and according to expectations, whereas screening for SGA is associated with a high false positive rate.
Introduction
Preeclampsia (PE) affects 2 to 3% of all pregnancies and is a major cause of maternal and fetal morbidity and mortality worldwide [1–3]. Similarly, being small for gestational age (SGA), defined as birth weight below the fifth percentile, even without PE is also a major cause of adverse outcome [4, 5]. Besides the immediate risk to mother and child, there is rising evidence that these placenta-related pregnancy complications are a major cardiovascular risk factor for both in later life [6, 7]. Indeed, previous PE has now been accepted as an additional risk factor for future cardiovascular complications besides nicotine, obesity, diabetes and family history for cardiovascular disease [8, 9]. There is increasing evidence that it also poses a risk for cognitive impairment in later life [10].
Several large studies and meta-analyses have demonstrated, that the use of low-dose aspirin (LDA) started early during pregnancy in high-risk pregnancies reduces substantially the risk of PE and SGA [11, 12]. Traditionally, high-risk pregnancies have been defined by obstetrical history and/or pre-existing maternal factors. The UK National Institute for Health and Care Excellence (NICE) defines women to be at high risk when at least one major risk factor (previous PE, chronic hypertension, pre-existing kidney disease or diabetes, systemic lupus erythematosus [SLE] or antiphospholipid syndrome [APS]) or two or more minor risk factors (primiparity or interpregnancy interval >10 years, body mass index [BMI] >35kg/m2, maternal age >40 years or family history of PE) are present [13]. The American College of Obstetrics and Gynecology (ACOG) does not distinguish between major and minor risk factors and requires only one anamnestic risk factor (primiparity, previous PE, chronic hypertension, chronic kidney disease, thrombophilia, in-vitro fertilisation [IVF], family history of PE, pre-existing diabetes, obesity, SLE, maternal age >40 years) to consider the pregnancy to be at risk; they recommend prophylactic LDA only for very high-risk pregnancies with a history of early onset preeclampsia (eoPE) or repeated previous PE [14]. However, such screening strategies either consider a majority of women to be at risk, or, at a reasonable false-positive rate of about 10%, identify barely half of all women at risk for PE [15] and even fewer of those at risk for SGA [16]. To address this problem, studies have been conducted to better characterise “at risk women” using in addition biochemical and biophysical parameters to develop screening algorithms mainly for the first trimester [15–19]. With their aid, detection rates of up to 96% for eoPE and about 75% for preterm preeclampsia (pPE), as well as for preterm delivery of an SGA infant (pSGA) have been published [15, 16]. The ASPRE (ASpirin for the evidence-based PREeclampsia prevention) trial recently demonstrated the efficacy of LDA in preventing PE in women defined as “at risk” for PE on the basis of a combined first trimester screening algorithm [20].
Since 2013, we have offered PE and SGA screening to all women with singleton pregnancies, using the algorithm provided by the Fetal Medicine Foundation (FMF) London. The aim of this study was to assess the performance of these screening algorithms in our population.
Material and methods
This was a cross-sectional study of all women who were seen at our outpatient clinic for their pregnancy between September 2013 and April 2016 and who opted to have screening for PE at their 11- to 14-weeks ultrasound scan. The outpatient clinic is part of our department of obstetrics and gynaecology and has roughly 8000 consultations per year, taking care of around 2000 pregnancies. We use the algorithm provided by the FMF London, which combines the background risk defined by maternal history and characteristics with the mean arterial pressure (MAP), the mean pulsatility index (PI) of both uterine arteries (UtA), and the values of the biochemical and angiogenetic markers pregnancy-associated plasma protein A (PAPP-A) and placental growth factor (PlGF). According to the Bayes theorem, the likelihood ratios of each independent parameter are multiplied with the background risk to calculate an individual risk [15, 17, 18, 21, 22]. As PAPP-A did not improve the sensitivity of the screening algorithm, we did not consider it a mandatory variable in our study [15]. The blood pressure was assessed by using a pregnancy-validated device (UEBE Visomat comfort) twice on both arms at the end of the ultrasound scan; the software provided by Viewpoint Version 5.6.25.284 (GE, Mountainview, CA, USA) calculated the MAP of the four measurements. The UtA PI was measured by certified scanners according to the guidelines of the FMF London. PlGF and PAPP-A were measured on Kryptor Compact Plus from Brahms GmbH. Blood was drawn for PAPP-A measurement at the first antenatal visit, between 8 and 14 weeks of gestation, and for PlGF between 10 and 14 weeks of gestation. Whenever PlGF was available between 11 and 14 weeks, we used that result; however, as we recently showed, PlGF differentiates preeclamptic from normal pregnancies from 10 weeks of gestation onward, so we included PlGF values between 10+0 and 10+6 weeks of gestation when no other measurement was available [23]. Multiple of the medians (MoMs) of all parameters were calculated with the use of Viewpoint. The risk for PE requiring delivery before 34 weeks, 37 weeks and at term, and the risk of SGA requiring delivery before 37 weeks were also calculated by the Viewpoint software. The proposed cut-offs of ≥1:200 for eoPE, and ≥1:150 for pSGA were applied [18]. For comparative purposes we retrospectively analysed the data also according to the screening criteria of NICE and ACOG [13, 14].
Usually we recommend LDA 100 mg to women with previous PE and/or SGA pregnancies, chronic hypertension, pre-existing diabetes, SLE, APS and/or chronic kidney disease [13]. From 2013 onward we also included as indication for LDA prophylaxis a risk score of ≥1:200 for eoPE based on the FMF London first trimester risk stratification tool [15, 18, 24].
PE was defined according to the criteria established by the International Society for the Study of Hypertension in Pregnancy (ISSHP), systolic blood pressure of 140 mm Hg or more and/or diastolic blood pressure of 90 mm Hg or more either pre-existing or developing after 20 weeks of gestation in a previously normotensive women, together with significant proteinuria (300 mg/24-h urine collection, or 30 mg proteins / mmol creatinine, or ++ on dip-stick testing) and/or other signs of maternal endothelial dysfunction and/or uteroplacental dysfunction with intrauterine growth restriction [25]. SGA was defined as birth weight below the fifth percentile according to the FMF screening algorithm [18]. The study was approved by the Ethics Committee of the University of Bern.
Statistical analyses were performed with GraphPad version 5.0 for Windows (GraphPad Software, San Diego, CA). Spearman rank correlation and linear regression were used to analyse the correlation between the individual markers and gestational age. Continuous variables were analysed with the Student t-test or Mann-Whitney U-test, and proportions were evaluated with use of the Fisher’s exact test or chi-squared test. Statistical significance was considered to be achieved when p was less than 0.05.
Results
During the study period, 1372 patients with singleton pregnancies agreed to undergo screening; in 1209 (88%) of them, complete screening including maternal history and characteristics, MAP, UtA-PI and PlGF was performed. In 163 patients some screening parameters were missing, mostly PlGF as initially we did not have the possibility to measure it, and they were excluded from further analysis. In 1136 of 1209 (94%), PAPP-A was also assessed.
Pregnancy outcome parameters were available for 1150 of the 1209 (95.1%) cases. Of those, 16 (1.4%) pregnancies resulted in a second trimester miscarriage, 5 (0.4%) were terminated or an intrauterine fetal death was diagnosed (none related to PE). A total of 1129 (98.2%) resulted in a live birth and were used for further analyses.
Nineteen of 1129 (1.68%) women developed PE, 5 (0.44%) of them pPE, including 2 (0.18%) with eoPE and 14 (1.24%) with PE at term. Forty-nine of the 1110 (4.41%) pregnancies without PE were SGA and 3 (0.27%) of those required preterm delivery. The remaining 1061 (92.3%) pregnancies were delivered without preeclampsia and with a newborn with a weight above the fifth percentile; these are henceforth referred to as controls. Patients’ characteristics and pregnancy outcomes are shown in table 1. Table 2 compares our population with that used by the FMF London to develop and validate the screening algorithm [15, 17].
Table 1 Patients’ characteristics and pregnancy outcome of our study population divided into uneventful pregnancies (controls), pregnancies that developed preeclampsia and pregnancies that resulted in a small for gestational age infant (<5th percentile).
|
Controls
(n = 1061)
|
PE
(n = 19)
|
SGA
(n = 49)
|
| Maternal age (years), median (IQR) |
31.0 (27.0–35.0) |
32.0 (28.0–34.0) |
32.0 (28.5–35.5) |
| Maternal weight (kg), median (IQR) |
63.0 (56.0–71.6) |
67.0 (61.0–77.5) |
57 (51.6–65.9)* |
| Maternal height (cm), median (IQR) |
165 (160–170) |
164 (160–168) |
162 (158–165)* |
| Maternal BMI at 12 weeks (kg/m2), median (IQR |
22.8 (20.7–26.2) |
24.6 (22.9–31.1)* |
21.6 (19.4–25.7) |
| Fetal CRL (mm), median (IQR) |
64.9 (59.6–70.8) |
62.7 (56.1–67.0) |
65.4 (60.1–69.4) |
| Gestational age (weeks), median (IQR) |
12.7 (12.3–13.1) |
12.4 (12.0–12.7) |
12.7 (12.3–13.0) |
| Ethnicity, n (%): |
|
|
|
| Caucasian |
779 (73.4) |
14 (73.7) |
37 (75.5) |
| Black |
153 (14.4) |
3 (15.8) |
5 (10.2) |
| South Asian |
55 (4.9) |
1 (5.3) |
3 (6.1) |
| East Asian |
46 (4.3) |
1 (5.3) |
3 (6.1) |
| Mixed |
28 (2.6) |
0 (0) |
1 (2.0) |
| Parity, n (%): |
|
|
|
| Nulliparous |
535 (50.4) |
14 (73.7) |
28 (57.1) |
| Parous without previous PE or SGA |
467 (44.0) |
4 (21.1) |
15 (30.6) |
| Parous with previous PE |
21 (2.0) |
0 (0) |
5 (10.2)* |
| Parous with previous SGA |
32 (3.0) |
0 (0) |
1 (2.0) |
| Parous with previous PE and SGA |
6 (0.6) |
1 (5.3) |
0 (0) |
| Cigarette smoker, n (%) |
88 (8.3) |
0 (0) |
9 (18.4)* |
| Family history of PE, n (%) |
13 (1.2) |
0 (0) |
0 (0) |
| Mode of conception, n (%): |
|
|
|
| Spontaneous |
973 (91.7) |
18 (94.7) |
43 (87.8) |
| ART |
88 (8.3) |
1 (5.3) |
6 (12.2) |
| Chronic hypertension, n (%) |
16 (1.5) |
3 (15.8)* |
3 (6.1)* |
| Pre-existing diabetes mellitus, n (%) |
6 (0.6) |
1 (5.3) |
1 (2) |
| SLE or APS, n (%) |
6 (0.6) |
0 (0) |
0 (0) |
| Mode of delivery, n (%): |
|
|
|
| Vaginal |
565 (53.3) |
2 (10.5)* |
19 (38.8) |
| Operative vaginal delivery |
125 (11.8) |
2 (10.5) |
1 (2.0)* |
| Caesarean section |
371 (35.0) |
15 (78.9)* |
29 (59.2)* |
| Gestational age at delivery (weeks), median (IQR |
39.6 (38.7–40.6) |
38.7 (36.6–40.0)* |
39.0 (38.1–39.8)* |
| Delivery before 37 weeks, n (%) |
50 (4.7) |
5 (26.3)* |
3 (6.1) |
| Birth weight (kg), median (IQR) |
3.37 (3.08–3.64) |
3.06 (2.66–3.38)* |
2.45 (2.31–2.62)* |
| Birth weight percentile, median (IQR) |
45.0 (25.7–65.8) |
24.8 (15.9–62.8) |
2.6 (1.5–3.8)* |
| Birthweight <10th percentile, n (%) |
65 (6.1) |
4 (21.1)* |
49 (100)* |
| Birthweight <5th percentile, n (%) |
0 (0) |
3 (15.8)* |
49 (100)* |
Table 2 Comparison of our collective with the collectives used by the FMF London in the development [15] and validation [17] of the preeclampsia screening algorithm.
|
Population Bern
(n = 1129
|
Akolekar 2013 [
15
]
(n = 58 884)
|
O’Gorman 2016 [
17
]
(n = 35 948)
|
| Maternal age (years), median (IQR) |
31.0 (27.0–35.0) |
32.0 |
31.3 |
| Maternal weight (kg), median (IQR) |
62.6 (56–71.3) |
65.6 |
66.7 |
| Maternal height (cm), median (IQR) |
165 (160–170) |
n.a. |
164.5 |
| Maternal BMI at 12 weeks (kg/m2), median (IQR) |
22.8 (20.6–26.2) |
n.a. |
24.6 |
| Fetal CRL (mm), median (IQR) |
64.9 (59.6–70.6) |
63.4 |
n.a. |
| Ethnicity, n (%): |
|
|
|
| White |
830 (73.5) |
43 265 (73.5) |
25 879 (72.0) |
| Black |
161 (14.3) |
9793 (16.6)* |
6681 (18.6)* |
| South Asian |
59 (5.2) |
2844 (4.8) |
1623 (4.5) |
| East Asian |
50 (4.4) |
1489 (2.5)* |
846 (2.4)* |
| Mixed |
29 (2.6) |
1493 (2.5) |
919 (2.6) |
| Parity, n (%): |
|
|
|
| Nulliparous |
577 (51.1) |
29 108 (49.4) |
17 361 (48.3) |
| Parous without previous PE |
519 (46.0) |
27 955 (47.5) |
17 311 (48.2) |
| Parous with previous PE |
33 (2.9) |
1821 (3.1) |
1276 (3.5) |
| Cigarette smoker, n (%) |
97 (8.6) |
4584 (7.8) |
3263 (9.1) |
| Family history of PE, n (%) |
13 (1.2) |
2629 (4.5)* |
1518 (4.2)* |
| Conception, n (%): |
|
|
|
| Spontaneous |
1034 (91.6) |
56 795 (96.3)* |
n.a. |
| ART |
95 (8.4) |
2179 (3.7)* |
n.a. |
| Chronic hypertension, n (%) |
22 (1.9) |
685 (1.2)* |
561 (1.6) |
| Pre-existing diabetes mellitus, n (%) |
8 (0.7) |
411 (0.7) |
325 (0.9) |
| SLE or APS, n (%) |
6 (0.5) |
125 (0.2) |
53 (0.1)* |
Performance of individual screening parameters
The median (IQR) absolute values and MoMs of all individual parameters in controls compared with preterm and term PE and SGA are depicted in table 3 and figure 1.
Table 3 Median and interquartile range of individual screening parameters and their multiple of the medians in uneventful pregnancies compared with preterm preeclampsia, term preeclampsia and delivery of infant small for gestational age.
|
Controls
(n = 1061)
|
Preterm PE
(n = 5)
|
Term PE
(n = 14)
|
SGA
(n = 49)
|
| MAP (mm Hg) |
84.8 (80.4–89.8) |
96.4 (89.1–104.6)* |
94.1 (88.3–98.7)** |
86.3 (79.4–91.5) |
| MAP-MoM |
1.00 (0.95–1.06) |
1.14 (1.02–1.16)* |
1.10 (1.05–1.17)** |
1.01 (0.96–1.07) |
| UtA PI |
1.50 (1.21–1.85) |
1.71 (1.60–2.45) |
1.36 (1.13–1.88) |
1.57 (1.30–2.01) |
| UtA PI-MoM |
0.93 (0.76–1.15) |
1.07 (0.96–1.55) |
0.88 (0.72–1.16) |
0.97 (0–79–1.27) |
| PlGF (pg/ml) |
38.9 (29.9–52.9) |
19.0 (17.3–31.3)** |
32.6 (16.5–37.1)** |
35.1 (25.6–56) |
| PlGF-MoM |
0.99 (0.79–1.24) |
0.74 (0.48–1.00) |
0.68 (0.50–0.87)** |
0.84 (0.69–1.14)* |
| PAPP-A (mU/l) |
2.09 (1.04–3.94) |
1.67 (0.40–1.83) |
1.63 (0.72–4.32) |
1.61 (0.81–3.55) |
| PAPP-A-MoM |
1.02 (0.72–1.50) |
0.75 (0.59–1.04) |
0.75 (0.46–1.12)* |
0.75 (0.57–1.20)** |
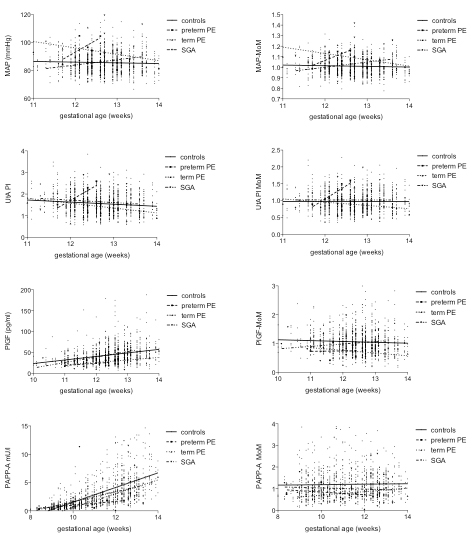
Figure 1 Mean arterial pressure, uterine artery Doppler, placental growth factor (PlGF) and pregnancy-associated plasma protein A (PAPP-A) and their multiple of the medians (MoMs) in uneventful and complicated pregnancies over the course of the first trimester.
PE = preeclampsia; SGA = small for gestational age
Mean arterial pressure
No correlation was found between MAP or MAP-MoMs with gestational age between 11 and 14 weeks gestation in uneventful pregnancies nor in pregnancies complicated by PE or SGA.
Uterine artery pulsatility index
UtA PI significantly decreased between 11 and 14 weeks (p >0.0001, r = ˗0.113) in controls, whereas UtA PI-MoMs remained stable. There was no correlation with gestational age of UtA PIs or their MoMs in PE or SGA.
The median UtA PI-MoM was 0.93 (IQR 0.76–1.15) in uneventful pregnancies and therefore somewhat lower than expected, but still in the range, whereas the mean ± standard deviation UtA PI was 0.97 ± 0.30 and therefore as expected. We performed a sub-analysis of a random sample of 95 measurements. Only 41 (43.2%) measurements fulfilled all criteria requested by the FMF London, whereas 32 (33.7%) had an angle correction of more than 30° or the sample gate was not 2 mm, and in 22 (23.2%) the measured blood flow velocity was less than 60 cm/s. To assess retrospectively whether the measurement was taken at the height of internal cervical os is difficult. In the 41 measurements that fulfilled all FMF criteria and in the 73 that had a correct blood flow velocity, the median UtA PI MoM was 1.014 (IQR 0.87–1.27) and 1.009 (0.83–1.31) , respectively, (p = 0.99).
Placental growth factor
PlGF increased significantly between 10 and 14 weeks of gestation in uneventful pregnancies (p <0.0001, r = 0.31), as well as in pregnancies resulting in SGA (p = 0.015, r = 0.35) but not with PE. PlGF-MoMs did not correlate with gestational age in complicated and uncomplicated pregnancies.
Pregnancy-associated plasma protein A
PAPP-A increased significantly between 8 and 14 weeks of gestation in uneventful pregnancies (p <0.0001, r = 0.75) and also in pregnancies resulting in tPE (p = 0.0008, r = 0.79) and SGA (p <0.0001, r = 0.68), but not in pPE. No correlation with gestational age was found in PAPP-A-MoMs in complicated and uneventful pregnancies.
Performance of screening
Preeclampsia screening algorithm
Ninety-seven of 1129 (8.6%) screening tests showed a risk ≥1:200 for eoPE, and in 121/1129 (10.7%) cases the risk was ≥1:269 (the risk cut-off published by FMF at a false-positive rate of 10% [15]). A total of 125/1129 (11.1%) had a risk ≥1:67 for pPE and 131/1129 (11.6%) had a risk ≥1:12 for tPE (each risk cut-off according to FMF London at a false-positive rate of 10% [15]). At a false-positive rate of 10%, the risk cut-offs in our patient group were 1:260 for eoPE, 1:65 for pPE and 1:12 for tPE. Overall, 95.5% of the patients at risk for eoPE also have an increased risk for pPE.
Performance of preeclampsia screening
Both of the two patients (100%) with eoPE, as well as 4/5 (80%) patients who developed pPE were screen positive for eoPE, as well as pPE and tPE; 7 of 14 (50%) patients with tPE were screen positive for tPE, resulting overall in 11/19 (57.9%) PE pregnancies that were screen positive.
In comparison, only 5/19 (26.3%) of our PE patients but 99/1129 (8.8%) of the total collective would be considered at risk according to the criteria adopted by NICE [13]. Thirty-one of 1129 pregnancies were screen positive according to both FMF London and NICE; of note, none of the 68 remaining women at risk according to NICE but 6/66 (9%) with positive first trimester screening only, developed PE (fig. 2). The negative predictive value of both tests was excellent (98.6% and 99.2%, respectively); however, the absolute false negative results are 42.1% with first trimester screening and 73.7% according to NICE (p = 0.099). When we considered the recommendation published by the ACOG [14], 730 (64.7%) of our cases would have been defined as high risk for placental associated pregnancy complications (fig. 2).
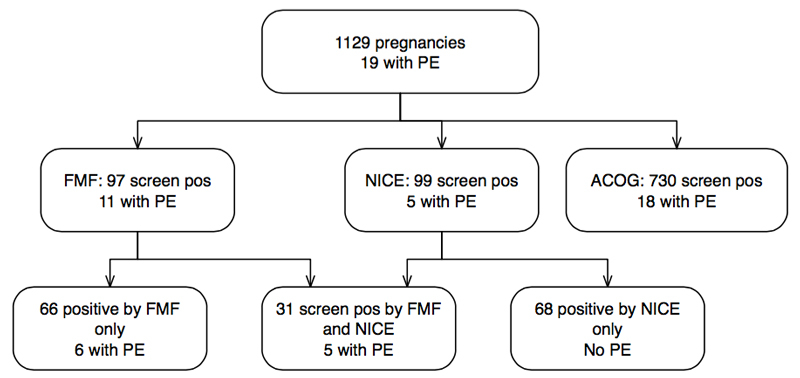
Figure 2 Performance of preeclampsia (PE) screening in Bern by use of first trimester combined screening according to the Fetal Medicine Foundation (FMF) London, compared with screening by anamnestic risk factors as proposed by the UK National Institute for Health and Care Excellence (NICE) and American College of Obstetrics and Gynecology (ACOG).
SGA screening algorithm and performance
Overall, 210/1110 (18.9%) screening tests in pregnancies without PE showed a risk ≥1:150 for pSGA; at that cut-off only 5% are expected to screen positive by the FMF London [16]. Also, 8/19 (42.1%) pregnancies with PE screened positive for SGA, including both pregnancies with eoPE; however, none of the eight resulted in pSGA. Only three pregnancies resulted in pSGA, two (66.7%) of which screened positive.
Aspirin prescription
A total of 116 of the 1129 (10.3%) women were prescribed low-dose aspirin: 90/97 women at risk for eoPE according to first trimester screening and 52/99 women with risks from maternal history including 30/31 women with risks according to both screening modalities received LDA. An additional four women were given LDA for other reasons. We did not test compliance.
Discussion
Main findings of the study
This study confirmed that first trimester screening with use of the FMF algorithm for preeclampsia performs well and according to expectations in our mixed population [15, 17]. The validation of the screening algorithm in an independent population with analysis of the performance of each screening parameter was the main strength of our study. With the limited number of pregnancies requiring preterm delivery due to SGA in our population, this study is not powered to confirm that first trimester screening for growth restriction performs accordingly [18]. Of note, the incidence of PE in our population was remarkable low compared with published data [1–3, 15, 19, 24]. This was also one of the main limitations of our study. Compared with the population studied by the FMF London, our population was characterised by a higher prevalence of assisted reproduction technology (ART) pregnancies, and more women with chronic hypertension (table 2). Maybe the already high sensibility to prescribing LDA in at risk situations in our clinic and our policy to widen the indication for LDA prophylaxis to include also screen-positive women led to this low incidence of PE [20, 24]. This hypothesis fits well with results of another prospective Swiss study, which described a prevalence of PE of 2.31%; unfortunately, no information was provided on the use of prophylactic LDA in that study [26]. The recently published ASPRE trial also demonstrated a significant reduction of pPE with the use of LDA [20].
Performance of the algorithm in our cohort
Through intensive research in the last decade, many first trimester markers for PE besides maternal history and characteristics have been identified [15, 16, 27, 28]. With the most valuable of those, various screening algorithms have been developed [15, 17, 29] and are still being constantly refined. The screening algorithm developed by the FMF London is based on data of nearly 60 000 pregnancies and demonstrates a significant improvement in the detection rate for PE compared with screening by maternal history alone [15]. The performance of the screening algorithm has recently been validated; however, external independent validation was requested [17]. Our population, even though much smaller, varies only slightly from the population studied by the FMF London in terms of background risk. The most important risk factors for PE are chronic hypertension, type I diabetes mellitus, SLE or APS and chronic kidney disease. These pathologies are overrepresented in our cohort owing to referral of high-risk women [21]. Additionally the prevalence of pregnancies conceived by ART in our group was higher, maybe because we work in close collaboration with our IVF clinic [21]. We have, however, fewer African-Caribbean women and fewer cases with a positive family history for PE. The only explanation we find for the low incidence of women with a positive family history is the probably too low awareness of the patients of that condition (table 2). Moreover, we demonstrated that the biochemical and biophysical screening parameters used were in the expected range in uncomplicated pregnancies [15, 17]. Our rates of screen-positive results were also very similar to those described by the FMF London, and we reach almost identical cut-offs in the different risk calculations at a false-positive rate of 10% [15–18]. As we chose to treat women at risk for early onset PE with low-dose aspirin, we cannot directly comment on the detection rate. However, assuming LDA prevented or postponed some cases of PE, one would expect more of the screen-positive women to develop PE, as mostly they received low-dose aspirin, which would again increase the detection rate.
First trimester screening detects almost twice the number of women who develop PE at almost the same false positive rate, as compared with the risk assessment proposed by NICE [13], which is also in line with described detection rates [15] (fig. 2). The difference was not significant in our study group because of the relatively small population examined and, mostly, because of the low incidence of PE. Risk stratification as proposed by ACOG results in a very high false-positive rate and therefore does not meet the requirements of a screening test.
Importance of training in uterine artery Doppler assessment
The only parameter that did not perform exactly as expected was the UtA PI. Our sub-analysis of a random sample of UtA PIs demonstrated the importance of precise measurements. Decreased blood flow velocities in the sample particularly influence the results, as they imply that the wrong vessel was chosen. However, the chosen samples in a sub-analysis, even though randomly assigned, always are subject to bias, as they might not exactly represent the whole studied population. Another important aspect is that the measurement was not taken above the internal os, as there the PI becomes lower [30]. This difficulty could eventually be overcome if the UtA PI is measured in a transverse view of the internal cervical os, as was recently proposed. Ridding et al [31] demonstrated that regular feedback to individual operators via cumulative sum (CUSUM) and target charts improves measurement performance. As in our findings, this emphasises the importance of training and regular quality controls, just as it is required for the assessment of the nuchal translucency. This might have reduced our screen-positive rate somewhat, but it needs to be emphasised that our results were still in the expected range.
Low-dose aspirin
Park et al. [24] demonstrated that LDA reduces the risk of PE in screen positive patients. Our results suggest the same and the ASPRE trial, a randomised placebo-controlled trial that tested LDA in women who had a positive result in the first trimester PE screening, confirmed these findings recently [20]. Today, no evidence exists that prescribing LDA to all pregnant women might further decrease the incidence of PE [32], and whereas LDA seems to be safe in pregnancies at risk, there is some evidence of increased risk for placental abruption and gastrointestinal bleeding [33, 34]. This risk might become more important if LDA were prescribed universally. There is evidence that, owing to aspirin resistance, 150 mg rather than a lower dose should be prescribed [20]. Our small study does not allow any comment on that. However, the incidence of pPE in our collective is in line with the incidence described by Park et al. [24], who prescribed 150 mg aspirin.
Further implications of preventing preeclampsia
PE is an important risk factor for maternal cardiovascular disease later in life [6, 8, 9] and there is evidence that impaired placental function results in fetal cardiac remodelling, which in turn can also lead to cardiovascular disease in adult life [35]. Although predisposing factors for later cardiovascular disease may already exist prior to the onset of PE and even increase the risk for PE, the vascular damage caused by inflammatory stress, coagulation dysregulation and endothelial damage during PE poses an additional risk [36]. Prevention of placental disorders, besides the aspect of the immediate danger the diseases pose to mother and child, should therefore be considered as a task of utmost importance to prevent future disease in the newborn and mother. Identifying women at risk for PE and SGA and installation of preventive measures must therefore be expedited.
References
1Knight M, Tuffnell D, Kenyon S, Shakespeare J, Gray R, Kurinczuk JJ, eds. on behalf of MBRRACE-UK. Surveillance of maternal deaths in the UK 2011–2013. Oxford: National Perinatal Epidemiology Unit, University of Oxford; 2015.
2Manktelow BN, Smith LK, Seaton SE, Hyman-Taylor P, Kurinczuk JJ, Field DJ, et al., on behalf of the MBRRACE-UK collaboration. MBRRACE-UK Perinatal Mortality Surveillance Report: UK Perinatal Deaths for Births from January to December 2014. Leicester: The Infant Mortality and Morbidity Studies, Department of Health Sciences, University of Leicester; 2016.
3
Duley
L
. The global impact of pre-eclampsia and eclampsia. Semin Perinatol. 2009;33(3):130–7. doi:.https://doi.org/10.1053/j.semperi.2009.02.010
4
Lawn
JE
,
Blencowe
H
,
Waiswa
P
,
Amouzou
A
,
Mathers
C
,
Hogan
D
, et al.; Lancet Ending Preventable Stillbirths Series study group; Lancet Stillbirth Epidemiology investigator group. Stillbirths: rates, risk factors, and acceleration towards 2030. Lancet. 2016;387(10018):587–603. doi:.https://doi.org/10.1016/S0140-6736(15)00837-5
5
Lindqvist
PG
,
Molin
J
. Does antenatal identification of small-for-gestational age fetuses significantly improve their outcome?
Ultrasound Obstet Gynecol. 2005;25(3):258–64. doi:.https://doi.org/10.1002/uog.1806
6
Ghossein-Doha
C
,
van Neer
J
,
Wissink
B
,
Breetveld
N
,
de Windt
LJ
,
van Dijk
AP
, et al.
Pre-eclampsia, an important female specific risk factor for asymptomatic heart failure. Ultrasound Obstet Gynecol. 2017;49(1):143–9.
7
Sehgal
A
,
Skilton
MR
,
Crispi
F
. Human fetal growth restriction: a cardiovascular journey through to adolescence. J Dev Orig Health Dis. 2016;7(6):626–35. doi:.https://doi.org/10.1017/S2040174416000337
8
Mosca
L
,
Benjamin
EJ
,
Berra
K
,
Bezanson
JL
,
Dolor
RJ
,
Lloyd-Jones
DM
, et al.
Effectiveness-based guidelines for the prevention of cardiovascular disease in women--2011 update: a guideline from the american heart association. Circulation. 2011;123(11):1243–62. doi:.https://doi.org/10.1161/CIR.0b013e31820faaf8
9
Wu
P
,
Haththotuwa
R
,
Kwok
CS
,
Babu
A
,
Kotronias
RA
,
Rushton
C
, et al.
Preeclampsia and future cardiovascular health: a systematic review and meta-analysis. Circ Cardiovasc Qual Outcomes. 2017;10(2):e003497; epub ahead of print. doi:.https://doi.org/10.1161/CIRCOUTCOMES.116.003497
10
Fields
JA
,
Garovic
VD
,
Mielke
MM
,
Kantarci
K
,
Jayachandran
M
,
White
WM
, et al.
Preeclampsia and cognitive impairment later in life. Am J Obstet Gynecol. 2017;217(1):74.e1–11; epub ahead of print. doi:.https://doi.org/10.1016/j.ajog.2017.03.008
11
Bujold
E
,
Roberge
S
,
Lacasse
Y
,
Bureau
M
,
Audibert
F
,
Marcoux
S
, et al.
Prevention of preeclampsia and intrauterine growth restriction with aspirin started in early pregnancy: a meta-analysis. Obstet Gynecol. 2010;116(2 Pt 1):402–14. doi:.https://doi.org/10.1097/AOG.0b013e3181e9322a
12
Roberge
S
,
Nicolaides
KH
,
Demers
S
,
Villa
P
,
Bujold
E
. Prevention of perinatal death and adverse perinatal outcome using low-dose aspirin: a meta-analysis. Ultrasound Obstet Gynecol. 2013;41(5):491–9. doi:.https://doi.org/10.1002/uog.12421
13National Institute of Health and Care Excellence. Hypertension in pregnancy: diagnosis and management. Clinical Guideline CG107. 2011. Available from: https://www.nice.org.uk/guidance/cg107.
14Task Force on Hypertension in Pregnancy. Hypertension in Pregnancy. Washington, DC: American College of Obstetricians and Gynecologists; 2013.
15
Akolekar
R
,
Syngelaki
A
,
Poon
L
,
Wright
D
,
Nicolaides
KH
. Competing risks model in early screening for preeclampsia by biophysical and biochemical markers. Fetal Diagn Ther. 2013;33(1):8–15. doi:.https://doi.org/10.1159/000341264
16
Karagiannis
G
,
Akolekar
R
,
Sarquis
R
,
Wright
D
,
Nicolaides
KH
. Prediction of small-for-gestation neonates from biophysical and biochemical markers at 11-13 weeks. Fetal Diagn Ther. 2011;29(2):148–54. doi:.https://doi.org/10.1159/000321694
17
O’Gorman
N
,
Wright
D
,
Syngelaki
A
,
Akolekar
R
,
Wright
A
,
Poon
LC
, et al.
Competing risks model in screening for preeclampsia by maternal factors and biomarkers at 11-13 weeks gestation. Am J Obstet Gynecol. 2016;214(1):103.e1–12. doi:.https://doi.org/10.1016/j.ajog.2015.08.034
18
Poon
LC
,
Syngelaki
A
,
Akolekar
R
,
Lai
J
,
Nicolaides
KH
. Combined screening for preeclampsia and small for gestational age at 11-13 weeks. Fetal Diagn Ther. 2013;33(1):16–27. doi:.https://doi.org/10.1159/000341712
19
Crovetto
F
,
Figueras
F
,
Triunfo
S
,
Crispi
F
,
Rodriguez-Sureda
V
,
Dominguez
C
, et al.
First trimester screening for early and late preeclampsia based on maternal characteristics, biophysical parameters, and angiogenic factors. Prenat Diagn. 2015;35(2):183–91. doi:.https://doi.org/10.1002/pd.4519
20
Rolnik
DL
,
Wright
D
,
Poon
LC
,
O’Gorman
N
,
Syngelaki
A
,
de Paco Matallana
C
, et al.
Aspirin versus placebo in pregnancies at high risk for preterm preeclampsia. N Engl J Med. 2017;NEJMoa1704559; epub ahead of print. doi:.https://doi.org/10.1056/NEJMoa1704559
21
Wright
D
,
Akolekar
R
,
Syngelaki
A
,
Poon
LCY
,
Nicolaides
KH
. A competing risks model in early screening for preeclampsia. Fetal Diagn Ther. 2012;32(3):171–8. doi:.https://doi.org/10.1159/000338470
22The Fetal Medicine Foundation. Assessment of risk for preeclampsia. Clinical algorithm. Available from: www.fetalmedicine.org/research/assess/preeclampsia
23
Mosimann
B
,
Amylidi-Mohr
S
,
Höland
K
,
Surbek
D
,
Risch
L
,
Raio
L
. Importance of Timing First-Trimester Placental Growth Factor and Use of Serial First-Trimester Placental Growth Factor Measurements in Screening for Preeclampsia. Fetal Diagn Ther. 2017; epub ahead of print. doi:.https://doi.org/10.1159/000455946
24
Park
F
,
Russo
K
,
Williams
P
,
Pelosi
M
,
Puddephatt
R
,
Walter
M
, et al.
Prediction and prevention of early-onset pre-eclampsia: impact of aspirin after first-trimester screening. Ultrasound Obstet Gynecol. 2015;46(4):419–23. doi:.https://doi.org/10.1002/uog.14819
25
Tranquilli
AL
,
Dekker
G
,
Magee
L
,
Roberts
J
,
Sibai
BM
,
Steyn
W
, et al.
The classification, diagnosis and management of the hypertensive disorders of pregnancy: A revised statement from the ISSHP. Pregnancy Hypertens. 2014;4(2):97–104.
26
Purde
MT
,
Baumann
M
,
Wiedemann
U
,
Nydegger
UE
,
Risch
L
,
Surbek
D
, et al.
Incidence of preeclampsia in pregnant Swiss women. Swiss Med Wkly. 2015;145:w14175.
27
Wu
P
,
van den Berg
C
,
Alfirevic
Z
,
O’Brien
S
,
Röthlisberger
M
,
Baker
PN
, et al.
Early pregnancy biomarkers in preeclampsia: a systematic review and meta-analysis. Int J Mol Sci. 2015;16(9):23035–56. doi:.https://doi.org/10.3390/ijms160923035
28
Baumann
MU
,
Bersinger
NA
,
Surbek
DV
. Serum markers for predicting pre-eclampsia. Mol Aspects Med. 2007;28(2):227–44. doi:.https://doi.org/10.1016/j.mam.2007.04.002
29
Crovetto
F
,
Figueras
F
,
Triunfo
S
,
Crispi
F
,
Rodriguez-Sureda
V
,
Dominguez
C
, et al.
First trimester screening for early and late preeclampsia based on maternal characteristics, biophysical parameters, and angiogenic factors. Prenat Diagn. 2015;35(2):183–91. doi:.https://doi.org/10.1002/pd.4519
30
Ridding
G
,
Schluter
PJ
,
Hyett
JA
,
McLennan
AC
. Influence of sampling site on uterine artery Doppler indices at 11-13+6 weeks gestation. Fetal Diagn Ther. 2015;37(4):310–5. doi:.https://doi.org/10.1159/000366060
31
Ridding
G
,
Hyett
JA
,
Sahota
D
,
McLennan
AC
. Assessing quality standards in measurement of uterine artery pulsatility index at 11 to 13 + 6 weeks’ gestation. Ultrasound Obstet Gynecol. 2015;46(3):299–305. doi:.https://doi.org/10.1002/uog.14732
32
Mone
F
,
Mulcahy
C
,
McParland
P
,
McAuliffe
FM
. Should we recommend universal aspirin for all pregnant women?
Am J Obstet Gynecol. 2017;216(2):141.e1–5.
33
Xu
TT
,
Zhou
F
,
Deng
CY
,
Huang
GQ
,
Li
JK
,
Wang
XD
. Low-dose aspirin for preventing preeclampsia and its complications: a meta-analysis. J Clin Hypertens (Greenwich). 2015;17(7):567–73. doi:.https://doi.org/10.1111/jch.12541
34
Elwood
PC
,
Morgan
G
,
Galante
J
,
Chia
JW
,
Dolwani
S
,
Graziano
JM
, et al.
Systematic review and meta-analysis of randomized trials to ascertain fatal gastrointestinal bleeding events attributable to preventive low-dose aspirin: no evidence of increased risk. PLoS One. 2016;11(11):e0166166. doi:.https://doi.org/10.1371/journal.pone.0166166
35
Cruz-Lemini
M
,
Crispi
F
,
Valenzuela-Alcaraz
B
,
Figueras
F
,
Sitges
M
,
Bijnens
B
, et al.
Fetal cardiovascular remodeling persists at 6 months in infants with intrauterine growth restriction. Ultrasound Obstet Gynecol. 2016;48(3):349–56. doi:.https://doi.org/10.1002/uog.15767
36
Chen
CW
,
Jaffe
IZ
,
Karumanchi
SA
. Pre-eclampsia and cardiovascular disease. Cardiovasc Res. 2014;101(4):579–86. doi:.https://doi.org/10.1093/cvr/cvu018