Trends and socioeconomic inequalities in amenable mortality in Switzerland with international comparisons
DOI: https://doi.org/10.4414/smw.2017.14478
Anita
Fellera, Kurt
Schmidlina, Kerri M.
Clough-Gorrab
aInstitute of Social and Preventive Medicine (ISPM),
bSection of Geriatrics,
Trends and socioeconomic inequalities in amenable mortality in Switzerland with international comparisons
w14478
Summary
BACKGROUND
Amenable mortality is a composite measure of deaths from conditions that might be avoided by timely and effective healthcare. It was developed as an indicator to study health care quality.
METHODS
We calculated mortality rates for the population aged 0–74 years for the time-period 1996–2010 and the following groups of causes of death: amenable conditions, ischaemic heart diseases (IHD, defined as partly amenable) and remaining conditions. We compared the Swiss results with those published for 16 other high-income countries. To examine the association between amenable mortality and socioeconomic position, we calculated hazard ratios (HRs) by using Cox regression.
RESULTS
Amenable mortality fell from 49.5 (95% confidence interval [CI] 48.2–51.0) to 35.7 (34.6–36.9) in males and from 55.0 (53.6–56.4) to 43.4 (42.2–44.6) per 100 000 person-years in females, when 1996–1998 was compared with 2008–2010. IHD mortality declined from 64.7 (95% CI 63.1–66.3) to 33.8 (32.8–34.8) in males and from 18.0 (17.2–18.7) to 8.5 (8.0–9.0) in females. However, between 1996–1998 and 2008–2010 the proportion of all-cause mortality attributed to amenable causes remained stable in both sexes (around 12% in males and 26% in females). Compared with 16 other high-income countries, Switzerland had the lowest rates of amenable mortality and ranked among the top five with the lowest ischaemic heart disease mortality. HRs of amenable causes in the lowest socioeconomic position quintile were 1.77 (95% CI 1.66–1.90) for males and 1.78 (1.47–2.16) for females compared with 1.62 (1.58–1.66) and 1.38 (1.33–1.43) for unamenable mortality. For ischaemic heart disease, HRs in the lowest socioeconomic position quintile were 1.76 (95% CI 1.66–1.87) for males and 2.33 (2.07–2.62) for females.
CONCLUSIONS
Amenable mortality declined substantially in Switzerland with comparably low death rates for amenable causes. Similar to previous international studies, these Swiss results showed substantial socioeconomic inequalities in amenable mortality. Proportions of amenable mortality remained constant over time and patterns of inequalities observed for amenable causes in men did not substantially differ from those observed for non-amenable causes of death. Additional amenable mortality research is needed to better understand the factors contributing to mortality changes and social inequalities including information on disease characteristics and health care supply measures.
Background
A major goal of healthcare systems is to improve the health of the population they serve. According to the definition of the World Health Organization (WHO) Framework for Health System Performance Assessment, population health “should reflect the health of individuals throughout their life course and include both premature mortality and non-fatal health outcomes” [1]. Further, population health “is concerned both with the average level of population health and with health distribution inequalities within the population” [1]. Decision makers need to regularly monitor the performance of the healthcare system, including subcomponents such as regions within the country [1]. This implies the need for core indicators suitable for assessing the health systems performance.
Amenable mortality is an established concept used to measure the effectiveness of healthcare services by counting premature deaths that should not have occurred in the event of timely and appropriate medical care. The concept has its origin in the idea of avoidable mortality introduced in 1976 by David Rutstein and colleagues [2]. Avoidable mortality consists of two components: (1) preventable mortality, which can be avoided primarily through primary prevention (e.g., lung cancer deaths through antismoking campaigns), and (2) amenable mortality, which can be avoided through timely and appropriate healthcare (e.g., breast cancer through early detection and high quality treatment).
Authors reviewing the literature on amenable mortality reported large regional disparities, but consistent patterns in time trends with a more rapid decline of amenable mortality than all-cause and/or non-amenable mortality [3, 4]. There is also strong evidence that socially disadvantaged groups have a higher risk of death from amenable causes [3–8]. For example, Stirbu et al. (2010) [8] investigated educational inequalities in amenable mortality in Europe based on selected conditions of the original list of Rutstein et al. [2]. Educational inequalities in amenable mortality were found in all European countries studied and for all conditions included. Inequalities were especially pronounced for infectious diseases and conditions requiring acute care [8]. The findings of Stirbu et al. are consistent with earlier literature [4] and more recent studies [3, 6, 7, 9], despite heterogeneity in study design, indicators of social status and lists of causes of death classified as amenable.
Switzerland is a small country in Central Europe with about 8.3 million inhabitants in a territory of less than 42 000 km2. The country performs well economically, with the highest average household net financial wealth worldwide [10]. Switzerland is a federal state composed of 26 cantons with far-reaching autonomy. Healthcare provision is primarily the responsibility of cantons, and insurance companies operate largely on a regional basis [11, 12]. The current Swiss healthcare system is based on the Health Insurance Law (LAMal) legislated in 1996 which (1) made basic health insurance mandatory for all residents, (2) authorised the Swiss federal government to define a catalogue of benefits that have to be covered by basic health insurance, and (3) introduced competition between health insurance companies through a risk adjustment scheme. Mandatory insurance premiums have to be paid either by the individual and/or the cantons and the state (persons eligible for health insurance subsidies). Before 1996, health insurance was predominantly voluntary and basic benefit packages varied substantially by insurance fund [12]. Now Switzerland has universal basic health insurance coverage and up to 90% of the insured population has supplemental health insurance [13]. Healthcare in Switzerland is costly. In 2012, Swiss health expenditures accounted for 11.4% of its gross domestic product [11]. However, expenditures alone say little about the effectiveness and quality of healthcare systems. The United States healthcare system, for example, is one of the most expensive in the world, but consistently underperforms in comparisons with other countries [14].
Data from Switzerland were included in previous international publications on amenable mortality [7, 8, 15]. However, to the best of the authors’ knowledge, no detailed investigation of this topic for Switzerland exists. The main objectives of this study were to examine: (1) time trends in amenable mortality in Switzerland, (2) Swiss results in an international context, and (3) Swiss-specific association between sociodemographic characteristics and amenable mortality.
Material and methods
Data sources and analytic variables
Mortality data and mid-year population estimates by 5-year age-bands (0–4, 5–9 … 85+ years), for all permanent Swiss residents 1996–2010 were obtained from the Swiss Federal Statistical Office (SFSO). The year 1996 was chosen as starting point because the definition of the underlying cause of death deviated from international standards up to 1995, leading to substantial breaks in cause-specific mortality trends [16, 17]. Further, in 1996 a major health system reform came into force. All deaths included in the study were coded by SFSO using the 10th revision of the International Statistical Classification of Diseases and Related Health Problems (ICD-10), in accordance with international standards.
Data on age-standardised amenable mortality rates across 16 high-income countries other than Switzerland have been taken from Nolte and McKee’s work published in 2011 (time period 1997–1998 and 2006–2007) [18]. They used the WHO mortality database as their primary data source. A detailed description of Nolte and McKee methods can be found elsewhere [18].
Data from the Swiss National Cohort (SNC) were used to examine the association between sociodemographic characteristics and amenable mortality. Ethical approval was obtained for the Swiss National Cohort from the cantonal ethics committees in Bern and Zurich. Given the anonymous nature of the data, no informed consent was required.
The SNC is a longitudinal study based on the Swiss national census of 1990 and 2000 linked to SFSO mortality data and emigration records up to 2008. A detailed description of the SNC can be found elsewhere [19, 20]. The present analysis of the SNC is based on the linked 2000 census with estimated population coverage of 98.6% [21, 22]. The dataset of the SNC is enhanced with an area-based index of Swiss socioeconomic position (Swiss-SEP). Swiss-SEP is a composite area level measure including four domains: income, education, occupation and housing conditions [21]. Socioeconomic position was analysed with use of quintiles of the Swiss-SEP index. Other SNC sociodemographic characteristics included nationality (Swiss versus non-Swiss) and language region of residence at time of census (German, French or Italian). Nationality has been added to the model because other Swiss studies reported mortality disparities between Swiss and non-Swiss citizens [23, 24]. Language region of residence is a common covariate in Swiss health-related analyses because of known cultural differences between the regions that reflect the countries bordering Switzerland. Further, there is evidence for regional variations in risk factors and treatment regimens [25, 26].
Definition of amenable mortality
In this study, we used the definition of amenable mortality compiled by Nolte and McKee [4], which is based on an annotated review and has been used by other researchers [27–30]. Selection of causes of death considered amenable to medical care was based on included conditions responsive to medical interventions (secondary prevention or medical treatment). The selected causes of death classified as amenable are listed in table 1.
Table 1 Causes of death amenable to healthcare.
|
Name of group
|
Age (years)
|
ICD-10
|
| 1 |
Intestinal infections |
0–14 |
A00–A09 |
| 2 |
Tuberculosis |
0–74 |
A15–A19, B90 |
| 3 |
Other infections (diphtheria, tetanus, poliomyelitis) |
0–74 |
A36, A35,A80 |
| 4 |
Whooping cough |
0–14 |
A37 |
| 5 |
Septicaemia |
0–74 |
A40–A41 |
| 6 |
Measles |
1–14 |
B05 |
| 7 |
Malignant neoplasm of colon and rectum |
0–74 |
C18–C21 |
| 8 |
Malignant neoplasm of skin |
0–74 |
C44 |
| 9 |
Malignant neoplasm of breast |
0–74 |
C50 |
| 10 |
Malignant neoplasm of cervix uteri |
0–74 |
C53 |
| 11 |
Malignant neoplasm of cervix uteri and body of the uterus |
0–44 |
C54, C55 |
| 12 |
Malignant neoplasm of testis |
0–74 |
C62 |
| 13 |
Hodgkin’s disease |
0–74 |
C81 |
| 14 |
Leukaemia |
0–44 |
C91–C95 |
| 15 |
Diseases of the thyroid |
0–74 |
E00–E07 |
| 16 |
Diabetes mellitus |
0–49 |
E10–E14 |
| 17 |
Epilepsy |
0–74 |
G40–G41 |
| 18 |
Chronic rheumatic heart disease |
0–74 |
I05–I09 |
| 19 |
Hypertensive disease |
0–74 |
I10–I13, I15 |
| 20 |
Ischaemic heart disease |
0–74 |
I20–I25 |
| 21 |
Cerebrovascular disease |
0–74 |
I60–I69 |
| 22 |
All respiratory diseases (excl. pneumonia/influenza) |
1–14 |
J00–J09, J20–J99 |
| 23 |
Influenza |
0–74 |
J10–J11 |
| 24 |
Pneumonia |
0–74 |
J12–J18 |
| 25 |
Peptic ulcer |
0–74 |
K25–K27 |
| 26 |
Appendicitis |
0–74 |
K35–K38 |
| 27 |
Abdominal hernia |
0–74 |
K40–K46 |
| 28 |
Cholelithiasis and cholecystitis |
0–74 |
K80–K81 |
| 29 |
Nephritis and nephrosis |
0–74 |
N00–N07, N17–N19, N25–N27 |
| 30 |
Benign prostatic hyperplasia |
0–74 |
N40 |
| 31 |
Maternal deaths |
0–74 |
O00–O99 |
| 32 |
Congenital cardiovascular anomalies |
0–74 |
Q20–Q28 |
| 33 |
Perinatal deaths, all causes excluding stillbirths |
0–74 |
P00–P96, A33, A34 |
| 34 |
Misadventures to patients during surgical and medical care |
0–74 |
Y60–Y69, Y83–Y84 |
Nolte and McKee included ischaemic heart diseases (IHD) in their list of amenable deaths, recommending that this group be separately analysed because: (1) the extent of avoidability remained unclear, (2) IHD could be understood as indicator for healthcare as well as for health policy and (3) the large proportion of deaths from IHD could obscure the contribution of other amenable causes [4]. In later work, Nolte and McKee [18, 31] assigned 50% of IHD deaths as amenable to healthcare services and included them in the overall number of amenable deaths. The change was based on accumulating evidence that up to half of IHD deaths may be potentially amenable to healthcare. Due to arguments (2) and (3) above, IHD was analysed separately herein. Causes of death were categorised as: (1) amenable conditions amenable to healthcare, (2) IHD and (3) non-amenable causes derived from combining the remaining causes. With increased age, amenable deaths decrease and the specificity of death certificate cause of death becomes less exact (e.g., high prevalence of multi-morbidity). Therefore, like Nolte and McKee, we used an upper age limit of 74 years with some exceptions (e.g., for childhood diseases, diabetes mellitus, leukaemia) [4, 31]. A detailed justification for the selection of causes of death and corresponding age limits is outlined in Nolte and McKee’s 2004 review [4].
Analytic methods
Mortality rates and corresponding 95% confidence intervals (95% CIs) were calculated for the death categories listed above using mortality data and mid-year population estimates from the SFSO 1996–2010. All rates were calculated as age-standardised mortality rates (ASMR) per 100 000 person-years (PY) for the age group 0–74 years, by use of the direct method and the European standard population as the reference population [32]. To minimise the effect of random variation, mortality rates were calculated grouped by three calendar years.
For international comparisons, Swiss mortality rates were calculated for the time periods 1997–1998 and 2006–2007, corresponding to those published by Nolte and McKee [18]. Unlike the present study, Nolte and McKee [18] did not separate amenable causes and IHD. To standardise, rates for amenable mortality and IHD mortality were recalculated to allow separate consideration of IHD deaths using the three categories specified above.
To estimate the association between amenable mortality and demographic characteristics, we calculated hazard ratios (HRs) and 95% CIs using Cox proportional hazard models based on the SNC dataset. Included persons were followed until death, 75th birthday, migration or 31 December 2008. Models included all SNC socioeconomic and demographic variables specified above and were adjusted for age using age at date of census as time-scale [33, 34]. To control for birth cohort and/or period effects, the models were stratified into five-year birth cohorts, allowing for different baseline hazards within each stratum [33]. Of available SNC persons, 3.9% (males) and 3.3% (females) were excluded because of missing SEP information.
All analyses were stratified by gender and performed using the statistical software package Stata, version 12.1 for Windows (StataCorp, College Station, Texas).
Results
Amenable mortality
ASMRs for amenable causes fell from 49.5 (95% CI 48.2–51.0) to 35.7 (34.6–36.9) per 100 000 PYs in males and from 55.0 (53.6–56.4) to 43.4 (42.2–44.6) per 100 000 PYs in females, when 1996–1998 was compared with 2008–2010 (table 2). For the same time periods, ASMRs for IHD declined from 64.7 (63.1–66.3) to 33.8 (32.8–34.8) per 100 000 PYs in males and from 18.0 (17.2–18.7) to 8.5 (8.0–9.0) per 100 000 PYs in females. For non-amenable causes, males showed a decline from 305.2 (301.8–308.6) to 218.7 (216.1–221.4) per 100 000 PYs and females from 137.1 (134.9–139.3) to 112.9 (111.0–114.7). Consequently, all-cause mortality fell from 419.4 (415.4–423.4) to 288.2 (285.2–291.2) per 100 000 PYs in males and from 210.1 (207.4–212.8) to 164.7 (162.5–167.0) per 100 000 PY in females.
Table 2 Three-year age-standardised mortality rates (ASMR) (European standard [32]) per 100 000 person-years, 95% confidence intervals (95% CI), age 0–74 years: amenable causes, ischaemic heart diseases, non-amenable causes and all causes by sex for the population of Switzerland, time period 1996–2010.
|
Year of death
|
Amenable causes
|
Ischaemic heart diseases
|
Non-amenable causes
|
All causes
|
|
ASMR
|
95% CI
|
ASMR
|
95% CI
|
ASMR
|
95% CI
|
ASMR
|
95% CI
|
|
Males
|
|
|
|
|
|
|
|
|
| 1996–1998 |
49.5 |
48.2–51.0 |
64.7 |
63.1–66.3 |
305.2 |
301.8–308.6 |
419.4 |
415.4–423.4 |
| 1999–2001 |
47.8 |
46.4–49.2 |
53.6 |
52.3–55.1 |
283.4 |
280.2–286.7 |
384.8 |
381.1–388.6 |
| 2002–2004 |
42.2 |
40.9–43.5 |
43.6 |
42.3–44.8 |
262.8 |
259.8–265.9 |
348.6 |
345.1–352.1 |
| 2005–2007 |
39.5 |
38.3–40.7 |
38.7 |
37.6–39.9 |
235.4 |
232.6–238.2 |
313.6 |
310.4–316.9 |
| 2008–2010 |
35.7 |
34.6–36.9 |
33.6 |
32.8–34.8 |
218.7 |
216.1–221.4 |
288.2 |
285.2–291.2 |
|
Females
|
|
|
|
|
|
|
|
|
| 1996–1998 |
55.0 |
53.6–56.4 |
18.0 |
17.2–18.7 |
137.1 |
134.9–139.3 |
210.1 |
207.4–212.8 |
| 1999–2001 |
50.3 |
48.9– 51.6 |
14.8 |
14.1–15.5 |
132.7 |
130.6–134.8 |
197.7 |
195.1–200.4 |
| 2002–2004 |
48.1 |
46.8–49.4 |
11.8 |
11.2–12.4 |
127.1 |
125.1–129.2 |
187 |
184.5–189.5 |
| 2005–2007 |
44.3 |
43.1–45.5 |
9.7 |
9.1–10.2 |
119.6 |
117.7–121.6 |
173.6 |
171.2–176.0 |
| 2008–2010 |
43.4 |
42.2–44.6 |
8.5 |
8.0–9.0 |
112.9 |
111.0–114.7 |
164.7 |
162.5–167.0 |
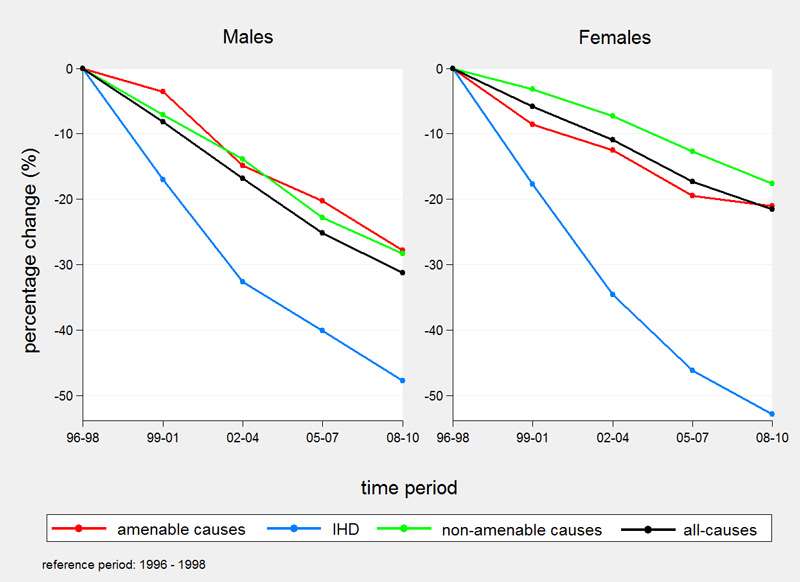
Percentage declines in 3-year Swiss ASMRs from 1996 up to and including 2010 were highest for IHD mortality (47.8% males, 52.9% females) (fig. 1). In males, decreases were similar for amenable (28.3%) and non-amenable causes of death (27.8%). In females, amenable mortality decreased slightly more than non-amenable mortality (21.1 vs 17.7%). Over the entire period all-cause mortality decreased by 31.3% in males and 21.6% in females.
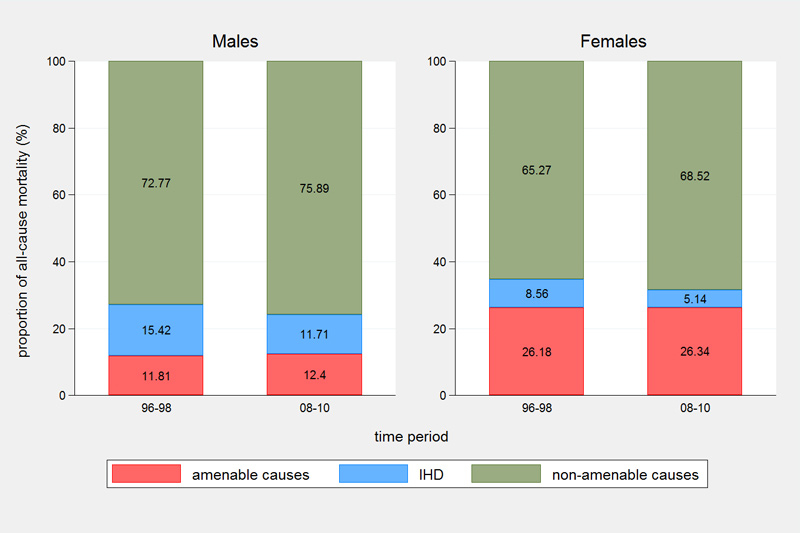
However, between 1996–1998 and 2008–2010 the proportion of all-cause mortality attributed to amenable causes remained stable in both sexes (around 12% in males and 26% in females) with a 2.2-fold higher proportion of amenable deaths in females (fig. 2). The proportion of IHD mortality decreased from 15.4 to 11.7% in males and from 8.6 to 5.1% in females. The proportion of deaths attributed to non-amenable causes increased slightly from 72.8 to 75.9% in males and from 65.3 to 68.5% in females.
In Switzerland 2008-2010, the five leading causes of amenable death in males were: colorectal cancer ASMR 10.6 (95% CI 10.0–11.2) per 100 000 PYs; cerebrovascular diseases ASMR 7.8 (7.3–8.3) per 100 000 PYs; perinatal deaths ASMR 4.0 (3.6–4.5) per 100 000 PYs; hypertensive diseases ASMR 4.0 (3.7–4.4) per 100 000 PYs; and pneumonia ASMR 2.5 (2.2–2.8) per 100 000 PYs (see supplementary table S1 in appendix 1). In Swiss females, the five leading causes of amenable mortality were: breast cancer ASMR 18.0 (17.3–18.8) per 100 000 PYs; colorectal cancer ASMR 6.5 (6.1–6.9) per 100 000 PYs; cerebrovascular diseases ASMR 5.8 (5.4–6.2) per 100 000 PYs; perinatal deaths ASMR 4.0 (3.5–4.5) per 100 000 PYs; and hypertensive diseases ASMR 2.2 (2.0–2.5) per 100 000 PYs. In both sexes, the five leading causes of death accounted for more than 80% of all amenable deaths.
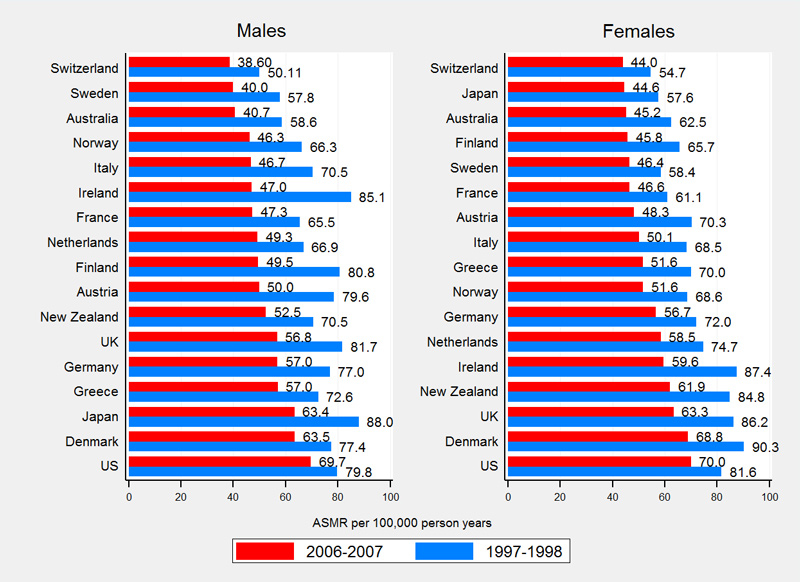
International comparisons
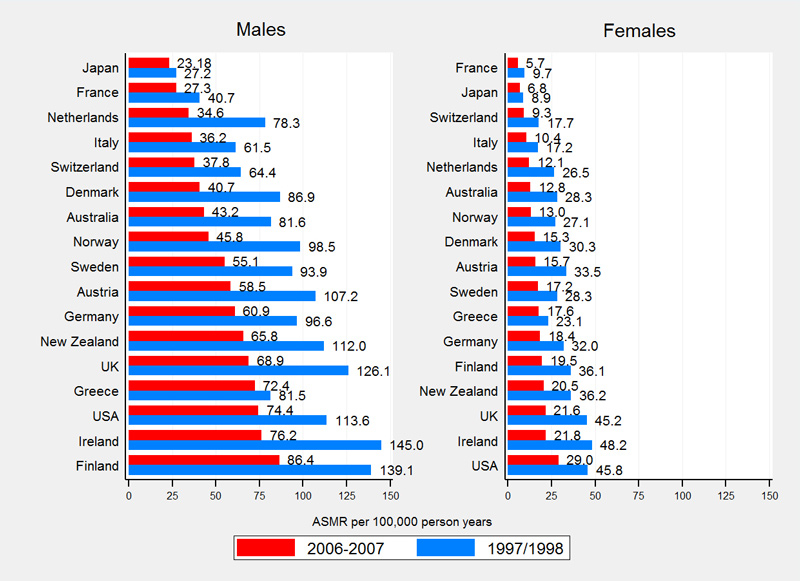
Compared with 16 other high-income countries, Switzerland had the lowest rates of amenable mortality (fig. 3). Swiss ASMRs were 50.1 (males) and 54.7 (females) per 100 000 PYs in 1997–1998 and 38.6 (males) and 44.0 (females) per 100 000 PYs in 2006–2007. Switzerland ranks among the top five countries with the lowest IHD mortality with ASRMs of 64.4 (males) and 17.7 (females) per 100 000 PYs in 1997–1998 and 37.8 (males) and 9.3 (females) per 100 000 PYs in 2006–2007 (fig. 4).
Overall international mortality rates of amenable causes, IHD and non-amenable causes declined substantially between observation periods. On average, amenable mortality declined by 28.5% in males (Switzerland 23.0%, supplementary table S2) and by 24.7% in females (Switzerland 19.6%, table S3). IHD mortality declined on average by 40.0% in males (Switzerland 41.2%) and by 44.3% in females (Switzerland 47.6%). Non-amenable mortality showed an average decline of 15.8% in males (Switzerland 22.9) and 11.3% in females (Switzerland 11.3%).
Amenable mortality and sociodemographic characteristics
The SNC analysis dataset included 3 198 927 males and 3 226 604 females, resulting in 24 402 938 PYs in males and 24 573 021 PYs in females. Overall, 85 773 males and 50 675 females died during follow up: 9604 males and 12 566 females died from amenable causes and 11 490 males and 3456 females from IHD. Non-amenable causes accounted for 64 679 and 34 653 deaths in males and females, respectively. Sociodemographic characteristics of the analysed study population are presented in table 3.
Table 3 Sociodemographic characteristics of the study population at census 2000, age 0–74 years: Swiss National Cohort (SNC).
|
Males
|
Females
|
|
n
|
%
|
n
|
(%)
|
|
Swiss-SEP index
|
|
|
|
|
| Quintile 5 (highest SEP) |
538 215 |
16.8% |
558 258 |
17.3% |
| Quintile 4 |
599 524 |
18.7% |
614 895 |
19.1% |
| Quintile 3 |
619 378 |
19.4% |
629 534 |
19.5% |
| Quintile 2 |
652 032 |
20.4% |
654 222 |
20.3% |
| Quintile 1 (lowest SEP) |
789 778 |
24.7% |
769 695 |
23.9% |
|
|
|
|
|
|
Language regions
|
|
|
|
|
| German |
2 320 080 |
72.5% |
2 319 457 |
71.9% |
| French |
739 592 |
23.1% |
761 905 |
23.6% |
| Italian |
139 255 |
4.4% |
145 242 |
4.5% |
|
|
|
|
|
|
Nationality
|
|
|
|
|
| Swiss |
2 470 355 |
77.2% |
2 593 872 |
80.4% |
| Non-Swiss |
728 572 |
22.8% |
632 732 |
19.6% |
|
|
|
|
|
|
Age at census (years)
|
|
|
|
|
| 0–14 |
584 598 |
18.3% |
557 153 |
17.3% |
| 15–39 |
1 226 154 |
38.3% |
1 213 223 |
37.6% |
| 40–64 |
1 135 584 |
35.5% |
1 143 686 |
35.5% |
| 65–74 |
252 591 |
7.9% |
312 542 |
9.7% |
| Total |
3 198 927 |
100.0% |
3 226 604 |
100.0% |
All types of mortality showed increasing hazards with lower socioeconomic position (table 4). Adjusted HRs of amenable causes in the lowest Swiss-SEP quintile were 1.77 (95% CI 1.66–1.90) for males and 1.78 (1.47-2.16) for females as compared with those in the highest quintile. Compared with the German-speaking region of Switzerland, living in the French- and/or Italian-speaking regions of Switzerland was consistently associated with lower HRs of amenable and IHD deaths in both sexes, although the difference was not statistically significant for amenable deaths in females. Male and female non-Swiss residents had consistently lower hazards for all types of mortality ranging from 0.77 (95% CI 0.74–0.79) (non-amenable deaths in females) to 0.91 (0.86–0.96) (amenable deaths in males).
Table 4 Hazard ratios of deaths and 95% confidence intervals (95% CI), age 0–74 years: amenable causes, ischaemic heart diseases and non-amenable causes by sex for the population of Switzerland at census 2000, followed until death, migration or the end of 2008.
|
Amenable causes
|
Ischaemic heart diseases
|
Non-amenable causes
|
|
Hazard ratio
|
95% CI
|
Hazard ratio
|
95% CI
|
Hazard ratio
|
95% CI
|
|
Males
|
|
|
|
|
|
|
|
|
|
|
|
|
|
| Swiss-SEP index |
|
|
|
|
|
|
| Quintile 5 (highest SEP) |
1.00 |
|
1.00 |
|
1.00 |
|
| Quintile 4 |
1.26 |
1.17–1.35 |
1.29 |
1.21–1.38 |
1.20 |
1.17–1.23 |
| Quintile 3 |
1.52 |
1.42–1.63 |
1.44 |
1.35–1.54 |
1.35 |
1.31–1.38 |
| Quintile 2 |
1.61 |
1.51–1.73 |
1.63 |
1.53–1.73 |
1.45 |
1.42–1.49 |
| Quintile 1 (lowest SEP) |
1.77 |
1.66–1.90 |
1.76 |
1.66–1.87 |
1.62 |
1.58–1.66 |
|
|
|
|
|
|
|
| Language region |
|
|
|
|
|
|
| German |
1.00 |
|
1.00 |
|
1.00 |
|
| French |
0.91 |
0.87–0.96 |
0.68 |
0.65–0.72 |
1.10 |
1.08–1.12 |
| Italian |
0.85 |
0.78–0.94 |
0.85 |
0.78–0.92 |
0.97 |
0.93–1.00 |
|
|
|
|
|
|
|
| Nationality |
|
|
|
|
|
|
| Swiss |
1.00 |
|
1.00 |
|
1.00 |
|
| Non-Swiss |
0.91 |
0.86–0.96 |
0.80 |
0.76–0.85 |
0.81 |
0.79–0.82 |
|
Females
|
|
|
|
|
|
|
|
|
|
|
|
|
|
| Swiss-SEP index |
|
|
|
|
|
|
| Quintile 5 (highest SEP) |
1.00 |
|
1.00 |
|
1.00 |
|
| Quintile 4 |
1.25 |
1.02–1.55 |
1.54 |
1.36–1.75 |
1.13 |
1.09–1.17 |
| Quintile 3 |
1.60 |
1.31–1.95 |
1.72 |
1.52–1.95 |
1.19 |
1.15–1.24 |
| Quintile 2 |
1.55 |
1.27–1.90 |
1.98 |
1.75–2.23 |
1.28 |
1.23–1.32 |
| Quintile 1 (lowest SEP) |
1.78 |
1.47–2.16 |
2.33 |
2.07–2.62 |
1.38 |
1.33–1.43 |
|
|
|
|
|
|
|
| Language region |
|
|
|
|
|
|
| German |
1.00 |
|
1.00 |
|
1.00 |
|
| French |
0.92 |
0.80–1.06 |
0.62 |
0.57–0.68 |
1.01 |
0.98–1.03 |
| Italian |
0.86 |
0.65–1.13 |
0.58 |
0.48–0.69 |
0.86 |
0.81–0.90 |
|
|
|
|
|
|
|
| Nationality |
|
|
|
|
|
|
| Swiss |
1.00 |
|
1.00 |
|
1.00 |
|
| Non-Swiss |
0.85 |
0.69–1.05 |
0.85 |
0.75–0.96 |
0.77 |
0.74–0.79 |
Discussion
Levels and trends of amenable mortality
In Switzerland 1996–2010, we found substantial decreases for all types of mortality. Women showed higher rates of amenable mortality than males. This result can be explained by taking a closer look at the distinct conditions classified as amenable and the individual rates of these conditions. The higher rate in females is mainly driven by breast cancer, which contributed more than 40% of all amenable deaths in Swiss women below the age of 75 years. In addition, IHD rates were considered separately and, therefore, higher IHD rates in males did not affect presented rates of amenable mortality.
However, only percentage declines in IHD mortality clearly outweighed reductions in non-amenable and all-cause mortality. Consequently, the contribution of amenable mortality to all-cause mortality remained stable, while the proportion of deaths caused by IHD decreased in both sexes. This is surprising, as the literature up to 2004 showed consistent patterns in time trends, with a more rapid decline of amenable mortality than non-amenable and all-cause mortality irrespective of differences in the conditions classified as amenable [4]. This pattern was confirmed by use of the list of amenable causes of deaths compiled by Nolte and McKee for 12 European countries and the time period 1980–1998 [4] and for 16 Western countries comparing the time periods 1996–1997 and 2006–2007 [18]. However, the more recent publication counted 50% of IHD deaths as amenable and included them in the overall number of amenable deaths, whereas IHD was treated separately in the publication of 2004. Nolte and McKee [18] themselves pointed out that falling amenable mortality in the more recent publication was driven to some extent by falling death rates from IHD. Therefore, it seems likely that large proportions of IHD deaths obscured the changes in mortality of other causes classified as amenable. In the context of the current work, figures from the more recent publication [18] were recalculated to enable an isolated consideration of deaths caused by IHD and to ensure comparability of the results. Using the recalculated figures and the Swiss results, four countries show lower (Denmark, Netherlands, Switzerland, US) or equal (New Zealand) percentage decreases for amenable mortality compared with all-cause mortality in males. These findings may indicate – at least for the male population in some Western countries – the beginning of changes in time trend patterns. One possible explanation might be that some Western countries reached the limits of improvements for at least some conditions classified as amenable [4, 35]. If IHD mortality is not taken into account, the Swiss results predominantly suggest that healthcare did not substantially contribute, over and above other determinants of population health, to continued mortality improvements in the time-period investigated.
On the basis of the leading causes of amenable deaths (breast cancer in females, colorectal cancer in males), enhancing early cancer detection and quality of cancer care might probably be most effective in further reducing mortality rates of amenable causes. For example, colorectal cancer screening prevalence among Swiss residents is low [36]. For female breast cancer, substantial socioeconomic inequalities in cancer screening, stage at presentation and treatment have been observed [37, 38]. These findings highlight the need to support early cancer detection and cancer awareness in the general population across all social groups. For IHD mortality, evidence from outside Switzerland suggests that around 50% of all IHD deaths are amenable to medical care [39]. Assuming a similar proportion for Switzerland, improvements in IHD care should also be a priority area to reduce amenable mortality.
When the Swiss results were compared with 16 Western countries, Switzerland showed the lowest rates of amenable mortality. Between 1997–1998 and 2006–2007, percentage declines for Swiss amenable mortality were distinctly below those from all included countries. These comparably low percentage declines may originate in the already low Swiss baseline levels of amenable mortality in 1997–1998. For IHD mortality, Switzerland shows percentage decreases above average, resulting in comparably low IHD mortality rates in 2006–2007. All in all, the results suggest that Switzerland reached a remarkable level of population health. This is supported by an internationally high ranking general [40] and healthy life expectancy of the Swiss population [41]. However, further Swiss studies are needed to investigate the actual contribution of healthcare quality to the good results.
Amenable mortality and socioeconomic position
Consistently with the previous literature outside of Switzerland, this study found substantial socioeconomic inequalities in amenable mortality [5, 7–9].
An international study on socioeconomic inequalities of amenable mortality undertaken by Plug et al. [7], found substantial social inequalities in amenable and non-amenable mortality for Switzerland and the other countries/regions included in the study [7]. Plug et al. [7] also presented Swiss results 1990–2000 based on the SNC. Unlike in the present study, socioeconomic position was defined by level of education, the investigation was based on the 1990 census, the selected conditions classified as amenable were based on an updated version of the original list of Rutstein et al. [2], and data were not stratified by gender. Plug et al. [7] also investigated whether inequalities in mortality are associated with inequalities in behavioural risk factors and/or medical use (used as proxy for healthcare access). They found no evidence that inequalities in amenable mortality are more strongly associated with differences in medical use than non-amenable mortality, arguing against a substantial association between amenable mortality and medical use and/or healthcare quality [7]. Overall, Plug et al. concluded that inequalities in amenable mortality might be caused by the same risk factors as those involved in non-amenable causes.
In summary, the present study detected substantial socioeconomic inequalities for amenable mortality and non-amenable mortality in Switzerland. Further investigations are needed to identify whether inequalities in amenable mortality are attributable to inequalities in medical use and/or healthcare quality.
Amenable mortality and language region
Living in the French- and/or Italian-speaking regions of Switzerland was associated with a reduced risk of dying from amenable causes or IHD as compared with living in the German-speaking region. Differences in the provision and quality of medical care may account for this result, although variations in incidence and/or disease severity among language regions should also be considered. As mentioned previously, in Switzerland healthcare services are organised at the cantonal level [42, 43]. For example, organised mammography screening programmes are currently available in only 50% of the Swiss cantons. In the cantons with organised mammography screening programmes, organised and opportunistic screening coexist, and distribution of organised versus opportunistic screening varies substantially across regions [44, 45]. For cardiovascular diseases, Marques-Vidal and Paccaud [26] observed substantial regional differences in self-reported risk factors, screening and disease management in Switzerland. Self-reported screening for diabetes, for example, was highest in the Italian-speaking region of Switzerland, whereas the lowest treatment rates in patients with high cholesterol levels and/or diabetes were observed in the German-speaking region of Switzerland. However, as mentioned above (parts of) the observed mortality differences may also reflect differences in underlying incidence rates rather than differences in the quality of medical care. This assumption is supported by the variation in IHD morbidity [46, 47] in Switzerland’s neighbouring countries (higher in Germany and Austria compared with Italy and France) and the cultural orientation (e.g., lifestyle, dietary habits) of the language regions towards their neighbouring country with the corresponding language.
Amenable mortality and nationality
Compared with male and female Swiss citizens, non-citizens showed reduced hazards for all types of death. One potential explanation for this might be the so-called “healthy migrant effect”. The healthy migrant effect describes an empirically observed mortality advantage of migrants relative to the population in the host country. This observation is usually explained as a preselection of healthy individuals at time of immigration, leading to better health outcomes in spite of potential social inequalities and discrimination. In this study, data quality issues might have affected nationality results. Death records of non-Swiss nationals showed an increased probability of not being linked to census data as compared with death records of Swiss nationals [19]. In addition, undocumented out-migration may have led to incomplete mortality follow-up [48].
The non-Swiss population is made of highly heterogeneous groups according to country of origin, migration status (first, second or third generation immigrants), type of residence permit, level of education, employment and income, to name a few. A supplementary analysis (not presented but available upon request) detected substantial variations in mortality between groups of nationalities even after adjusting for Swiss-SEP and other sociodemographic characteristics. Hence, this topic should be investigated further in future studies with particular regard to potential sources of bias. This is particularly important since there is a paucity of data on the health of immigrants or foreign nationals in Switzerland.
Strengths and limitations
The study is the first detailed population-based investigation of the effectiveness of healthcare in Switzerland with use of amenable mortality as quality indicator. We examined time trends of amenable mortality, the association between sociodemographic characteristics and amenable mortality and provided an international framework for the Swiss results.
There are some limitations in amenable mortality as a measure of the quality of medical care. In particular, studies investigating the association between amenable mortality and healthcare inputs have produced mixed findings and failed to identify strong and consistent relationships [3, 4, 29]. Therefore, the usefulness of amenable mortality as an indicator of the quality of medical care has been questioned [49–51]. However, most of these studies have looked at resources or supply of health services (e.g. percentage of gross domestic product spent on health services, number of healthcare professionals, hospitals or hospital beds per defined population, etc.) rather than quality measurements (e.g., effectiveness of healthcare services) [3, 4]. Furthermore, health expenditures may be affected by level of incidence and/or mortality rates, as resources may be diverted according to the specific needs of certain regions [29]. Our study did not include healthcare supply measures. However, the Swiss results can be interpreted as indirect evidence arguing predominantly against a strong association between amenable mortality and healthcare quality.
In addition, amenable mortality “is not a definitive source of evidence of differences in effectiveness of health care” [4]. Rather it is an indicator for estimating potential weaknesses and strengths of medical care that can or should be investigated in more depth, in the case of conspicuous results [4]. Moreover, mortality is affected by various factors outside the scope of the healthcare services. To identify underlying mechanisms and the contribution of components of the Swiss healthcare system, further research is needed.
Time trends and regional differences in amenable mortality might be affected by simultaneous changes in disease incidence or severity of disease at diagnosis [3, 4]. Some authors addressed this potential limitation and concluded that incidence-adjusted mortality rates are likely to enhance amenable mortality as quality indicator of healthcare systems [52, 53]. However, other authors have suggested that rates of amenable mortality should not be adjusted for incidence or severity at presentation since they are part of the population health needs and are within the responsibility of the healthcare services [54–57]. Further, precise Swiss incidence figures are not available for all conditions classified as amenable. However, it has been shown that differences in amenable mortality cannot simply be explained by variations in disease incidence [4].
Another point of criticism focuses on the variation of causes of deaths that were considered amenable by the various researchers and somewhat arbitrary age limits used to classify deaths as amenable. In this study, we used the version compiled by Nolte and McKee [4] which is based on an annotated review of the work that has been conducted worldwide and has been used by various researchers since its publication in 2004 [3, 28, 30, 58–60]. However, every list of causes of death considered as amenable is to some extent dependent on the view of the respective researcher(s) who developed it.
Finally, the concept of amenable mortality uses cause of death certification as data source. Observed differences at country or regional level and over time may be – at least partly – due to dissimilarities in diagnostic patterns for death certification or differences in coding practices of the underlying causes of death [4, 61, 62].
Conclusion
Amenable mortality constitutes a substantial proportion of all-cause mortality in Switzerland. As in other developed countries, amenable mortality declined substantially between 1996 and 2010. However, the proportion of all-cause mortality attributed to amenable causes remained stable. In contrast to other countries Switzerland showed comparably low death rates for amenable causes and IHD.
Similarly to previous international studies, these Swiss results showed substantial socioeconomic inequalities in amenable mortality. Unexpectedly, proportions of amenable mortality remained constant over time. Additional amenable mortality research is needed to better understand the factors contributing to inequalities and changes over time including information on disease characteristics and health care supply measures. In future Swiss research, in-depth studies should investigate cantonal/regional variations in the mortality declines and its association with cantonal/regional disparities in healthcare provision and/or utilisation. Further, the concept of amenable mortality should be adapted to the Swiss health profile by taking national or regional incidence trends into account. Finally, observed socioeconomic inequalities should be assessed in more detail (e.g., by cause of death, region, etc.).
Appendix 1 Supplementary tables
Table S1 Three-year age-standardised mortality rates (European standard [32]) per 100 000 person-years, 95% confidence intervals, age 0–74 years: cause-specific amenable mortality by sex for the population of Switzerland, time periods 1996–1998 and 2008–2010.
|
Cause of death
|
1996–1998
|
2008–2010
|
|
Male
|
Female
|
Male
|
Female
|
|
ASMR (Euro)
|
95% CI
|
ASMR (Euro)
|
95% CI
|
ASMR (Euro)
|
95% CI
|
ASMR (Euro)
|
95% CI
|
| Intestinal infections |
0.03 |
0.00–0.09 |
0.00 |
0.00–0.04 |
0.01 |
0.00–0.07 |
0.01 |
0.00–0.07 |
| Tuberculosis |
0.38 |
0.27–0.52 |
0.19 |
0.12–0.29 |
0.12 |
0.07–0.20 |
0.08 |
0.04–0.16 |
| Other infectious disease (diphtheria, tetanus, poliomyelitis) |
0.00 |
0.00–0.04 |
0.00 |
0.00–0.04 |
0.00 |
0.00–0.04 |
0.01 |
0.00–0.06 |
| Whooping cough |
0.00 |
0.00–0.04 |
0.03 |
0.00–0.09 |
0.00 |
0.00–0.04 |
0.02 |
0.00–0.07 |
| Septicaemia |
1.20 |
0.99–1.43 |
0.63 |
0.49–0.79 |
0.87 |
0.72–1.06 |
0.45 |
0.34–0.59 |
| Measles |
0.00 |
0.00–0.04 |
0.00 |
0.00–0.04 |
0.00 |
0.00–0.04 |
0.00 |
0.00–0.04 |
| Colorectal cancer |
13.26 |
12.56–13.99 |
7.69 |
7.19–8.22 |
10.59 |
10.03–11.18 |
6.49 |
6.06–6.94 |
| Skin cancer |
0.31 |
0.21–0.44 |
0.19 |
0.12–0.29 |
0.25 |
0.17–0.36 |
0.16 |
0.10–0.25 |
| Breast cancer |
0.15 |
0.08–0.24 |
22.51 |
21.63–23.43 |
0.10 |
0.05–0.18 |
18.04 |
17.32–18.79 |
| Cancer of the cervix uteri |
n.a. |
– |
1.83 |
1.59–2.11 |
n.a. |
– |
1.08 |
0.91–1.28 |
| Cancer of cervix uteri and body of the uterus |
n.a. |
– |
0.05 |
0.02–0.12 |
n.a. |
– |
0.04 |
0.01–0.10 |
| Malignant neoplasm of testis |
0.33 |
0.23–0.46 |
n.a. |
– |
0.23 |
0.15–0.34 |
n.a. |
– |
| Hodgkin's disease |
0.34 |
0.24–0.48 |
0.20 |
0.12–0.30 |
0.33 |
0.23–0.45 |
0.27 |
0.18–0.38 |
| Leukaemia |
0.85 |
0.68–1.05 |
0.61 |
0.46–0.78 |
0.49 |
0.36–0.64 |
0.30 |
0.20–0.43 |
| Diseases of the thyroid |
0.04 |
0.01–0.10 |
0.11 |
0.06–0.19 |
0.03 |
0.01–0.09 |
0.03 |
0.01–0.09 |
| Diabetes mellitus |
0.60 |
0.46–0.76 |
0.25 |
0.16–0.36 |
0.39 |
0.29–0.52 |
0.22 |
0.15–0.33 |
| Epilepsy |
1.04 |
0.85–1.26 |
0.74 |
0.58–0.93 |
0.82 |
0.67–1.01 |
0.55 |
0.42–0.70 |
| Chronic rheumatic heart disease |
0.40 |
0.29–0.54 |
0.35 |
0.25–0.48 |
0.16 |
0.10–0.25 |
0.27 |
0.19–0.38 |
| Hypertensive disease |
3.94 |
3.56–4.35 |
2.30 |
2.04–2.59 |
3.99 |
3.65–4.36 |
2.20 |
1.96–2.46 |
| Cerebrovascular disease |
14.90 |
14.16–15.67 |
9.19 |
8.65–9.75 |
7.75 |
7.27–8.25 |
5.79 |
5.39–6.21 |
| Respiratory diseases (excl. pneumonia/influenza) |
0.07 |
0.03–0.16 |
0.07 |
0.02–0.15 |
0.02 |
0.00–0.08 |
0.03 |
0.00–0.09 |
| Influenza |
0.30 |
0.20–0.43 |
0.21 |
0.13–0.31 |
0.04 |
0.01–0.11 |
0.03 |
0.01–0.08 |
| Pneumonia |
3.09 |
2.76–3.45 |
1.60 |
1.38–1.85 |
2.47 |
2.20–2.77 |
1.25 |
1.06–1.46 |
| Peptic ulcer |
0.76 |
0.60–0.95 |
0.52 |
0.40–0.67 |
0.45 |
0.34–0.58 |
0.27 |
0.19–0.38 |
| Appendicitis |
0.06 |
0.02–0.14 |
0.07 |
0.03–0.15 |
0.04 |
0.01–0.10 |
0.03 |
0.01–0.08 |
| Abdominal hernia |
0.17 |
0.10–0.28 |
0.11 |
0.06–0.19 |
0.15 |
0.09–0.24 |
0.13 |
0.08–0.21 |
| Cholelithiasis and cholecystitis |
0.22 |
0.13–0.33 |
0.13 |
0.07–0.21 |
0.21 |
0.14–0.31 |
0.12 |
0.07–0.20 |
| Nephritis and nephrosis |
1.10 |
0.91–1.33 |
0.78 |
0.63–0.95 |
1.00 |
0.83–1.19 |
0.53 |
0.41–0.67 |
| Benign prostatic hyperplasia |
0.07 |
0.03–0.14 |
n.a. |
– |
0.04 |
0.01–0.09 |
n.a. |
– |
| Maternal deaths |
n.a. |
– |
0.08 |
0.04–0.16 |
n.a. |
– |
0.12 |
0.07–0.21 |
| Congenital cardiovascular anomalies |
2.01 |
1.71–2.34 |
1.41 |
1.16–1.69 |
1.09 |
0.88–1.34 |
0.87 |
0.68–1.10 |
| Perinatal deaths (excl. stillbirths) |
3.90 |
3.47–4.37 |
3.10 |
2.70–3.53 |
4.01 |
3.56–4.49 |
3.97 |
3.51–4.47 |
| Misadventures to patients during surgical and medical care |
0.03 |
0.01–0.09 |
0.06 |
0.02–0.13 |
0.07 |
0.03–0.14 |
0.02 |
0.00–0.07 |
Table S2 Age-standardised mortality rates (European standard [32]) per 100 000 person-years and percentage changes in the male population of 17 high income countries, age 0–74 years: amenable causes, ischaemic heart diseases, non-amenable causes and all causes, time periods 1997/1998 and 2006/2007.
|
1997/1998
|
2006/2007
|
Change 1997/1998 – 2006/2007
|
|
Country
|
Am.
|
IHD
|
Non-am.
|
All
|
Am./ all (%)
|
IHD/all (%)
|
Am.
|
IHD
|
Non-am.
|
All
|
Am./ all (%)
|
IHD/all (%)
|
Am. (%)
|
IHD (%)
|
Non-am (%)
|
All (%)
|
| Australia |
58.6 |
81.6 |
272.6 |
412.9 |
14.2 |
19.8 |
40.7 |
43.2 |
213.8 |
297.7 |
13.7 |
14.5 |
˗30.6 |
˗47.0 |
˗21.6 |
˗27.9 |
| Austria |
78.6 |
107.2 |
328.7 |
514.5 |
15.3 |
20.8 |
50.0 |
58.5 |
278.9 |
387.4 |
12.9 |
15.1 |
˗36.4 |
˗45.4 |
˗15.1 |
˗24.7 |
| Denmark |
77.4 |
86.9 |
383.5 |
547.8 |
14.1 |
15.9 |
63.5 |
40.7 |
337.6 |
441.8 |
14.4 |
9.2 |
˗18.0 |
˗53.1 |
˗12.0 |
˗19.3 |
| Finland |
80.8 |
139.1 |
341.9 |
561.8 |
14.4 |
24.8 |
49.5 |
86.4 |
317.9 |
453.9 |
10.9 |
19.0 |
˗38.7 |
˗37.9 |
˗7.0 |
˗19.2 |
| France |
65.5 |
40.7 |
397.3 |
503.6 |
13.0 |
8.1 |
47.3 |
27.3 |
327.0 |
401.6 |
11.8 |
6.8 |
˗27.8 |
˗32.9 |
˗17.7 |
˗20.2 |
| Germany |
77.0 |
96.6 |
343.6 |
517.2 |
14.9 |
18.7 |
57.0 |
60.9 |
289.2 |
407.1 |
14.0 |
15.0 |
˗26.0 |
˗36.9 |
˗15.8 |
˗21.3 |
| Greece |
72.6 |
81.5 |
298.7 |
452.8 |
16.0 |
18.0 |
57.0 |
72.4 |
269.2 |
398.6 |
14.3 |
18.2 |
˗21.5 |
˗11.1 |
˗9.9 |
˗12.0 |
| Ireland |
85.1 |
144.9 |
322.3 |
552.4 |
15.4 |
26.2 |
47.0 |
76.2 |
250.5 |
373.8 |
12.6 |
20.4 |
˗44.7 |
˗47.4 |
˗22.3 |
˗32.3 |
| Italy |
70.5 |
61.5 |
321.3 |
453.2 |
15.5 |
13.6 |
46.7 |
36.2 |
244.6 |
327.4 |
14.3 |
11.1 |
˗33.8 |
˗41.1 |
˗23.9 |
˗27.8 |
| Japan |
88.0 |
27.2 |
277.0 |
392.2 |
22.4 |
6.9 |
63.4 |
23.2 |
238.5 |
325.1 |
19.5 |
7.1 |
˗28.0 |
˗14.8 |
˗13.9 |
˗17.1 |
| Netherlands |
66.9 |
78.3 |
322.2 |
467.4 |
14.3 |
16.8 |
49.3 |
34.6 |
256.3 |
340.2 |
14.5 |
10.2 |
˗26.3 |
˗55.8 |
˗20.5 |
˗27.2 |
| New Zealand |
70.5 |
112.0 |
289.2 |
471.7 |
15.0 |
23.7 |
52.5 |
65.8 |
232.9 |
351.1 |
14.9 |
18.7 |
˗25.6 |
˗41.3 |
˗19.5 |
˗25.6 |
| Norway |
66.3 |
98.5 |
286.6 |
451.3 |
14.7 |
21.8 |
46.3 |
45.8 |
239.5 |
331.6 |
14.0 |
13.8 |
˗30.2 |
˗53.5 |
˗16.4 |
˗26.5 |
| Sweden |
57.8 |
93.9 |
245.2 |
396.9 |
14.6 |
23.7 |
40.0 |
55.1 |
216.4 |
311.5 |
12.8 |
17.7 |
˗30.8 |
˗41.3 |
˗11.7 |
˗21.5 |
| Switzerland |
50.1 |
64.4 |
299.9 |
414.4 |
12.1 |
15.5 |
38.6 |
37.8 |
231.2 |
307.7 |
12.5 |
12.3 |
˗23.0 |
˗41.2 |
˗22.9 |
˗25.7 |
| UK |
81.7 |
126.1 |
284.3 |
492.1 |
16.6 |
25.6 |
56.8 |
68.9 |
253.8 |
379.5 |
15.0 |
18.2 |
˗30.5 |
˗45.3 |
˗10.7 |
˗22.9 |
| USA |
79.8 |
113.6 |
358.6 |
552.0 |
14.5 |
20.6 |
69.7 |
74.4 |
328.2 |
472.3 |
14.8 |
15.7 |
˗12.7 |
˗34.5 |
˗8.5 |
˗14.4 |
| Average |
72.2 |
91.4 |
316.1 |
479.6 |
15.1 |
18.8 |
51.5 |
53.4 |
266.2 |
371.1 |
13.9 |
14.3 |
˗28.5 |
˗40.0 |
˗15.8 |
˗22.7 |
Table S3 Age-standardised mortality rates (European standard) per 100 000 person-years and percentage changes in the female population of 17 high income countries, age 0–74 years: amenable causes, ischaemic heart diseases, non-amenable causes and all causes, time periods 1997/1998 and 2006/2007.
|
1997/1998
|
2006/2007
|
Change 1997/1998 – 2006/2007
|
|
Country
|
Am.
|
IHD
|
Non-am.
|
All
|
Am./ all (%)
|
IHD/all (%)
|
Am.
|
IHD
|
Non-am.
|
All
|
Am./ all (%)
|
IHD/all (%)
|
Am. (%)
|
IHD (%)
|
Non-am (%)
|
All (%)
|
| Australia |
62.5 |
28.3 |
135.7 |
226.4 |
27.6 |
12.5 |
45.2 |
12.8 |
116.0 |
174.1 |
26.0 |
7.4 |
˗27.7 |
˗54.6 |
˗14.5 |
˗23.1 |
| Austria |
70.3 |
33.5 |
141.3 |
245.0 |
28.7 |
13.7 |
48.3 |
15.7 |
128.5 |
192.4 |
25.1 |
8.1 |
˗31.3 |
˗53.2 |
˗9.0 |
˗21.5 |
| Denmark |
90.3 |
30.3 |
232.8 |
353.3 |
25.5 |
8.6 |
68.8 |
15.3 |
195.1 |
279.3 |
24.6 |
5.5 |
˗23.7 |
˗49.3 |
˗16.2 |
˗20.9 |
| Finland |
65.7 |
36.1 |
141.7 |
243.5 |
27.0 |
14.8 |
45.8 |
19.5 |
132.6 |
197.9 |
23.2 |
9.8 |
˗30.2 |
˗46.0 |
˗6.4 |
˗18.7 |
| France |
61.1 |
9.7 |
144.6 |
215.3 |
28.4 |
4.5 |
46.6 |
5.7 |
126.9 |
179.1 |
26.0 |
3.2 |
˗23.8 |
˗41.2 |
˗12.3 |
˗16.8 |
| Germany |
72.0 |
32.0 |
152.8 |
256.9 |
28.0 |
12.5 |
56.7 |
18.4 |
133.1 |
208.2 |
27.2 |
8.9 |
˗21.4 |
˗42.4 |
˗12.9 |
˗19.0 |
| Greece |
70.0 |
23.1 |
129.9 |
223.0 |
31.4 |
10.4 |
51.6 |
17.6 |
105.9 |
175.1 |
29.5 |
10.1 |
˗26.3 |
˗23.6 |
˗18.5 |
˗21.5 |
| Ireland |
87.4 |
48.2 |
175.6 |
311.1 |
28.1 |
15.5 |
59.6 |
21.8 |
143.0 |
224.4 |
26.6 |
9.7 |
˗31.8 |
˗54.8 |
˗18.6 |
˗27.9 |
| Italy |
68.5 |
17.2 |
133.4 |
219.1 |
31.2 |
7.9 |
50.1 |
10.4 |
108.6 |
169.1 |
29.6 |
6.2 |
˗26.9 |
˗39.6 |
˗18.6 |
˗22.9 |
| Japan |
57.6 |
8.9 |
112.4 |
178.9 |
32.2 |
5.0 |
44.6 |
6.8 |
97.1 |
148.5 |
30.0 |
4.6 |
˗22.6 |
˗23.5 |
˗13.6 |
˗17.0 |
| Nether-lands |
74.7 |
26.5 |
158.4 |
259.6 |
28.8 |
10.2 |
58.5 |
12.1 |
146.6 |
217.2 |
26.9 |
5.6 |
˗21.7 |
˗54.3 |
˗7.4 |
˗16.3 |
| New Zealand |
84.8 |
36.2 |
164.3 |
285.3 |
29.7 |
12.7 |
61.9 |
20.5 |
148.2 |
230.7 |
26.8 |
8.9 |
˗27.0 |
˗43.3 |
˗9.8 |
˗19.1 |
| Norway |
68.6 |
27.1 |
146.8 |
242.5 |
28.3 |
11.2 |
51.6 |
13.0 |
138.9 |
203.6 |
25.4 |
6.4 |
˗24.7 |
˗52.0 |
˗5.3 |
˗16.0 |
| Sweden |
58.4 |
28.3 |
138.0 |
224.6 |
26.0 |
12.6 |
46.4 |
17.2 |
130.8 |
194.4 |
23.9 |
8.9 |
˗20.5 |
˗39.1 |
˗5.2 |
˗13.4 |
| Switzer-land |
54.7 |
17.7 |
135.4 |
207.8 |
26.3 |
8.5 |
44.0 |
9.3 |
120.2 |
173.4 |
25.4 |
5.3 |
˗19.6 |
˗47.6 |
˗11.3 |
˗16.6 |
| UK |
86.2 |
45.2 |
167.3 |
298.7 |
28.9 |
15.1 |
63.3 |
21.6 |
153.8 |
238.8 |
26.5 |
9.1 |
˗26.6 |
˗52.1 |
˗8.1 |
˗20.1 |
| USA |
81.6 |
45.8 |
201.2 |
328.7 |
24.8 |
13.9 |
70.0 |
29.0 |
191.5 |
290.5 |
24.1 |
10.0 |
˗14.3 |
˗36.6 |
˗4.8 |
˗11.6 |
| Average |
71.4 |
29.1 |
153.6 |
254.1 |
28.3 |
11.1 |
53.7 |
15.7 |
136.3 |
205.7 |
26.3 |
7.5 |
˗24.7 |
˗44.3 |
˗11.3 |
˗19.0 |
References
1
Murray
CJ
,
Frenk
J
. A framework for assessing the performance of health systems. Bull World Health Organ. 2000;78(6):717–31.
2
Rutstein
DD
,
Berenberg
W
,
Chalmers
TC
,
Child
CG, 3rd
,
Fishman
AP
,
Perrin
EB
, et al.
Measuring the quality of medical care. A clinical method. N Engl J Med. 1976;294(11):582–8. doi:.https://doi.org/10.1056/NEJM197603112941104
3Castelli A, Nizalova O. Avoidable mortality: What it means and how it is measured. Center for Health Economics, 2011.
4Nolte E, McKee M. Does Health Care Save Lives? Avoidable Mortality Revisited. Research Report. Nuffield Trust; 2004.
5
Korda
RJ
,
Butler
JR
,
Clements
MS
,
Kunitz
SJ
. Differential impacts of health care in Australia: trend analysis of socioeconomic inequalities in avoidable mortality. Int J Epidemiol. 2007;36(1):157–65. doi:.https://doi.org/10.1093/ije/dyl282
6
Manderbacka
K
,
Peltonen
R
,
Martikainen
P
. Amenable mortality by household income and living arrangements: a linked register-based study of Finnish men and women in 2000-2007. J Epidemiol Community Health. 2014;68(10):965–70. doi:.https://doi.org/10.1136/jech-2014-204272
7
Plug
I
,
Hoffmann
R
,
Artnik
B
,
Bopp
M
,
Borrell
C
,
Costa
G
, et al.
Socioeconomic inequalities in mortality from conditions amenable to medical interventions: do they reflect inequalities in access or quality of health care?
BMC Public Health. 2012;12(1):346. doi:.https://doi.org/10.1186/1471-2458-12-346
8
Stirbu
I
,
Kunst
AE
,
Bopp
M
,
Leinsalu
M
,
Regidor
E
,
Esnaola
S
, et al.
Educational inequalities in avoidable mortality in Europe. J Epidemiol Community Health. 2010;64(10):913–20. doi:.https://doi.org/10.1136/jech.2008.081737
9
Yates
M
,
Dundas
R
,
Katikireddi
S
,
McKee
M
,
Pell
J
,
Stuckler
D
, et al. Trends in inequalities in amenable mortality in England: 1990–2010. European Journal of Public Health. 2015;25(suppl 3):ckv170.049.
10Brandmeir K, Grimm M, Heise M, Holzhausen A. Global Wealth Report. Munich: 2015.
11
Biller-Andorno
N
,
Zeltner
T
. Individual Responsibility and Community Solidarity--The Swiss Health Care System. N Engl J Med. 2015;373(23):2193–7. doi:.https://doi.org/10.1056/NEJMp1508256
12Daley C, Gubb J, Clarke E, Bidgood E. Healthcare Systems: Switzerland. Available from The Institute for the Study of Civil Society, London, UK website: http://www civitas org uk/nhs/download/switzerland pdf. 2007.
13
van Ginneken
E
,
Swartz
K
,
Van der Wees
P
. Health insurance exchanges in Switzerland and the Netherlands offer five key lessons for the operations of US exchanges. Health Aff (Millwood). 2013;32(4):744–52. doi:.https://doi.org/10.1377/hlthaff.2012.0948
14Davis K, Stremikis K, Squires D, Schoen C. Mirror, mirror on the wall- 2014 Update. How the performance of the US Health care system compares internationally, New York: Common Wealth Fund, 2014.
15Cayotte E, Buchow H. Who dies of what in Europe before the age of 65. Eurostat Statistics in Focus. 2009;67
16
Lutz
JM
,
Pury
P
,
Fioretta
G
,
Raymond
L
. The impact of coding process on observed cancer mortality trends in Switzerland. Eur J Cancer Prev. 2004;13(1):77–81. doi:.https://doi.org/10.1097/00008469-200402000-00012
17
Schmidlin
K
,
Clough-Gorr
KM
,
Spoerri
A
,
Egger
M
,
Zwahlen
M
; Swiss National Cohort. Impact of unlinked deaths and coding changes on mortality trends in the Swiss National Cohort. BMC Med Inform Decis Mak. 2013;13(1):1. doi:.https://doi.org/10.1186/1472-6947-13-1
18
Nolte
E
,
McKee
M
. Variations in amenable mortality--trends in 16 high-income nations. Health Policy. 2011;103(1):47–52. doi:.https://doi.org/10.1016/j.healthpol.2011.08.002
19
Bopp
M
,
Spoerri
A
,
Zwahlen
M
,
Gutzwiller
F
,
Paccaud
F
,
Braun-Fahrländer
C
, et al.
Cohort Profile: the Swiss National Cohort--a longitudinal study of 6.8 million people. Int J Epidemiol. 2009;38(2):379–84. doi:.https://doi.org/10.1093/ije/dyn042
20
Spoerri
A
,
Zwahlen
M
,
Egger
M
,
Bopp
M
. The Swiss National Cohort: a unique database for national and international researchers. Int J Public Health. 2010;55(4):239–42. doi:.https://doi.org/10.1007/s00038-010-0160-5
21
Panczak
R
,
Galobardes
B
,
Voorpostel
M
,
Spoerri
A
,
Zwahlen
M
,
Egger
M
; Swiss National Cohort and Swiss Household Panel. A Swiss neighbourhood index of socioeconomic position: development and association with mortality. J Epidemiol Community Health. 2012;66(12):1129–36. doi:.https://doi.org/10.1136/jech-2011-200699
22Renaud A. Methodology Report–Coverage Estimation for the Swiss Population Census 2000. Neuchâtel: Swiss Federal Statistical Office. 2004.
23
Bollini
P
,
Wanner
P
,
Pampallona
S
. Trends in maternal mortality in Switzerland among Swiss and foreign nationals, 1969-2006. Int J Public Health. 2011;56(5):515–21. doi:.https://doi.org/10.1007/s00038-010-0213-9
24
Feller
A
,
Mark
MT
,
Steiner
A
,
Clough-Gorr
KM
. Time trends in avoidable cancer mortality in Switzerland and neighbouring European countries 1996-2010. Swiss Med Wkly. 2015;145:w14184.
25
Ess
S
,
Savidan
A
,
Frick
H
,
Rageth
Ch
,
Vlastos
G
,
Lütolf
U
, et al.
Geographic variation in breast cancer care in Switzerland. Cancer Epidemiol. 2010;34(2):116–21. doi:.https://doi.org/10.1016/j.canep.2010.01.008
26
Marques-Vidal
P
,
Paccaud
F
. Regional differences in self-reported screening, prevalence and management of cardiovascular risk factors in Switzerland. BMC Public Health. 2012;12(1):246. doi:.https://doi.org/10.1186/1471-2458-12-246
27
Feng
X
,
Liu
Y
,
Astell-Burt
T
,
Yin
P
,
Page
A
,
Liu
S
, et al.
Analysis of health service amenable and non-amenable mortality before and since China’s expansion of health coverage in 2009. BMJ Open. 2016;6(1):e009370. doi:.https://doi.org/10.1136/bmjopen-2015-009370
28
Gusmano
MK
,
Rodwin
VG
,
Wang
C
,
Weisz
D
,
Luo
L
,
Hua
F
. Shanghai rising: health improvements as measured by avoidable mortality since 2000. Int J Health Policy Manag. 2014;4(1):7–12. doi:.https://doi.org/10.15171/ijhpm.2015.07
29
Kamarudeen
S
. Amenable mortality as an indicator of healthcare quality - a literature review. Health Stat Q. 2010;47:66–80. doi:.https://doi.org/10.1057/hsq.2010.16
30
McCallum
AK
,
Manderbacka
K
,
Arffman
M
,
Leyland
AH
,
Keskimäki
I
. Socioeconomic differences in mortality amenable to health care among Finnish adults 1992-2003: 12 year follow up using individual level linked population register data. BMC Health Serv Res. 2013;13(1):3. doi:.https://doi.org/10.1186/1472-6963-13-3
31
Nolte
E
,
McKee
CM
. Measuring the health of nations: updating an earlier analysis. Health Aff (Millwood). 2008;27(1):58–71. doi:.https://doi.org/10.1377/hlthaff.27.1.58
32Doll R. Comparison between Registries. Age-Standardized Rates. In: Waterhouse J, Muir C, Correa P, Powell J, editors. Cancer incidence in five continents. Lyon: International Agency for Research on Cancer; 1976. p. 453–9.
33
Korm
EL
,
Graubard
BI
,
Midthune
D
. Time-to-event analysis of longitudinal follow-up of a survey: choice of the time-scale. Am J Epidemiol. 1997;145(1):72–80. doi:.https://doi.org/10.1093/oxfordjournals.aje.a009034
34
Thiébaut
AC
,
Bénichou
J
. Choice of time-scale in Cox’s model analysis of epidemiologic cohort data: a simulation study. Stat Med. 2004;23(24):3803–20. doi:.https://doi.org/10.1002/sim.2098
35
Garne
E
. Perinatal mortality rates can no longer be used for comparing quality of perinatal health services between countries. Paediatr Perinat Epidemiol. 2001;15(3):315–6. doi:.https://doi.org/10.1046/j.1365-3016.2001.00356.x
36
Fedewa
SA
,
Cullati
S
,
Bouchardy
C
,
Welle
I
,
Burton-Jeangros
C
,
Manor
O
, et al.
Colorectal Cancer Screening in Switzerland: Cross-Sectional Trends (2007-2012) in Socioeconomic Disparities. PLoS One. 2015;10(7):e0131205. doi:.https://doi.org/10.1371/journal.pone.0131205
37
Bouchardy
C
,
Verkooijen
HM
,
Fioretta
G
. Social class is an important and independent prognostic factor of breast cancer mortality. Int J Cancer. 2006;119(5):1145–51. doi:.https://doi.org/10.1002/ijc.21889
38Rapiti E, Blanc A, Benhamou S, Schubert H, Vlastos G, Schaffar R, et al. Strong Socioeconomic Disparities in Breast Cancer Quality of Care in Switzerland. Cancer Res. 2011;71(24 Suppl.):abstract no. P1-11-01.
39
Ford
ES
,
Ajani
UA
,
Croft
JB
,
Critchley
JA
,
Labarthe
DR
,
Kottke
TE
, et al.
Explaining the decrease in U.S. deaths from coronary disease, 1980-2000. N Engl J Med. 2007;356(23):2388–98. doi:.https://doi.org/10.1056/NEJMsa053935
40World Population Prospects. The 2015 revision. New York: United Nations, Department of Economic and Social Affairs, Population Division, 2015.
41
Salomon
JA
,
Wang
H
,
Freeman
MK
,
Vos
T
,
Flaxman
AD
,
Lopez
AD
, et al.
Healthy life expectancy for 187 countries, 1990-2010: a systematic analysis for the Global Burden Disease Study 2010. Lancet. 2012;380(9859):2144–62. doi:.https://doi.org/10.1016/S0140-6736(12)61690-0
42
Frei
A
,
Hunsche
E
. The Swiss health care system. Eur J Health Econ. 2001;2(2):76–8. doi:.https://doi.org/10.1007/PL00012220
43
Wegmüller
B
,
Bienlein
M
. The Swiss health care system. World Hosp Health Serv. 2007;43(1):10–1.
44
Bulliard
JL
,
Ducros
C
,
Jemelin
C
,
Arzel
B
,
Fioretta
G
,
Levi
F
. Effectiveness of organised versus opportunistic mammography screening. Ann Oncol. 2009;20(7):1199–202. doi:.https://doi.org/10.1093/annonc/mdn770
45
Vassilakos
P
,
Catarino
R
,
Boulvain
M
,
Petignat
P
. Controversies in the mammography screening programme in Switzerland. Swiss Med Wkly. 2014;144:w13969.
46
Marques-Vidal
P
,
Ferrières
J
,
Metzger
MH
,
Cambou
JP
,
Filipiak
B
,
Löwel
H
, et al.
Trends in coronary heart disease morbidity and mortality and acute coronary care and case fatality from 1985-1989 in southern Germany and south-western France. Eur Heart J. 1997;18(5):816–21. doi:.https://doi.org/10.1093/oxfordjournals.eurheartj.a015347
47
Nichols
M
,
Townsend
N
,
Scarborough
P
,
Rayner
M
. Cardiovascular disease in Europe 2014: epidemiological update. Eur Heart J. 2014;35(42):2950. doi:.https://doi.org/10.1093/eurheartj/ehu299
48
Egger
M
,
Minder
CE
,
Smith
GD
. Health inequalities and migrant workers in Switzerland. Lancet. 1990;336(8718):816. doi:.https://doi.org/10.1016/0140-6736(90)93284-V
49
Carr-Hill
RA
,
Hardman
GF
,
Russell
IT
. Variations in avoidable mortality and variations in health care resources. Lancet. 1987;329(8536):789–92. doi:.https://doi.org/10.1016/S0140-6736(87)92810-8
50
Kunst
AE
,
Looman
CW
,
Mackenbach
JP
. Medical care and regional mortality differences within the countries of the European community. Eur J Popul. 1988;4(3):223–45. doi:.https://doi.org/10.1007/BF01796895
51
Mackenbach
JP
,
Hoffmann
R
,
Khoshaba
B
,
Plug
I
,
Rey
G
,
Westerling
R
, et al.
Using ‘amenable mortality’ as indicator of healthcare effectiveness in international comparisons: results of a validation study. J Epidemiol Community Health. 2013;67(2):139–46. doi:.https://doi.org/10.1136/jech-2012-201471
52
Bauer
RL
,
Charlton
JR
. Area variation in mortality from diseases amenable to medical intervention: the contribution of differences in morbidity. Int J Epidemiol. 1986;15(3):408–12. doi:.https://doi.org/10.1093/ije/15.3.408
53
Treurniet
HF
,
Looman
CW
,
van der Maas
PJ
,
Mackenbach
JP
. Variations in ‘avoidable’ mortality: a reflection of variations in incidence?
Int J Epidemiol. 1999;28(2):225–32. doi:.https://doi.org/10.1093/ije/28.2.225
54
Charlton
JR
,
Hartley
RM
,
Silver
R
,
Holland
WW
. Geographical variation in mortality from conditions amenable to medical intervention in England and Wales. Lancet. 1983;321(8326):691–6. doi:.https://doi.org/10.1016/S0140-6736(83)91981-5
55
Charlton
JR
,
Holland
WW
,
Lakhani
A
,
Paul
EA
. Variations in avoidable mortality and variations in health care. Lancet. 1987;329(8537):858. doi:.https://doi.org/10.1016/S0140-6736(87)91630-8
56
Holland
WW
,
Fitzgerald
AP
,
Hildrey
SJ
,
Phillips
SJ
. Heaven can wait. J Public Health Med. 1994;16(3):321–30.
57
Manuel
DG
,
Mao
Y
. Avoidable mortality in the United States and Canada, 1980-1996. Am J Public Health. 2002;92(9):1481–4. doi:.https://doi.org/10.2105/AJPH.92.9.1481
58
Lumme
S
,
Sund
R
,
Leyland
AH
,
Keskimäki
I
. Socioeconomic equity in amenable mortality in Finland 1992-2008. Soc Sci Med. 2012;75(5):905–13. doi:.https://doi.org/10.1016/j.socscimed.2012.04.007
59
Nolasco
A
,
Quesada
JA
,
Moncho
J
,
Melchor
I
,
Pereyra-Zamora
P
,
Tamayo-Fonseca
N
, et al.
Trends in socioeconomic inequalities in amenable mortality in urban areas of Spanish cities, 1996-2007. BMC Public Health. 2014;14(1):299. doi:.https://doi.org/10.1186/1471-2458-14-299
60
Schoenbaum
SC
,
Schoen
C
,
Nicholson
JL
,
Cantor
JC
. Mortality amenable to health care in the United States: the roles of demographics and health systems performance. J Public Health Policy. 2011;32(4):407–29. doi:.https://doi.org/10.1057/jphp.2011.42
61
Janssen
F
,
Kunst
AE
. ICD coding changes and discontinuities in trends in cause-specific mortality in six European countries, 1950-99. Bull World Health Organ. 2004;82(12):904–13.
62
Mathers
CD
,
Fat
DM
,
Inoue
M
,
Rao
C
,
Lopez
AD
. Counting the dead and what they died from: an assessment of the global status of cause of death data. Bull World Health Organ. 2005;83(3):171–7.