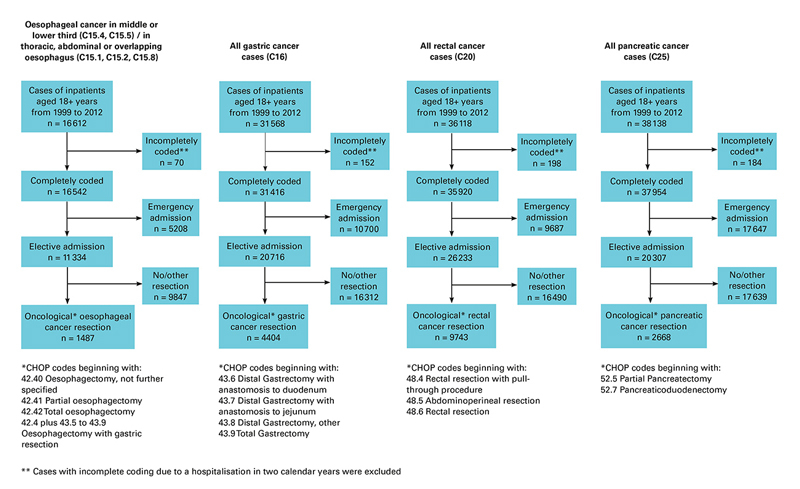
Figure 1 Definition of patient cohorts.
DOI: https://doi.org/10.4414/smw.2017.14473
For most early stage solid tumours, modern cancer management consists of complete resection of the primary tumour combined with other local and systemic therapies. Surgical skills, experienced clinical judgment, accurate staging and multidisciplinary treatments are key components of high-quality oncological care [1, 2]. Advances in the understanding of cancer biology, pathology, interventional radiology, radiation oncology and systemic therapy, combined with the rapid progress of sophisticated imaging techniques and molecular analyses have dramatically increased the level of knowledge required to deliver high-quality oncological care. Hence, an optimal management of oncological patients is best met in multidisciplinary teams existing at high-volume hospitals [1, 3].
The impact of hospital volume on short- and long-term outcomes in cancer patients has been extensively studied. Indeed, many investigations over the past decade provided compelling evidence that patient outcomes, including postoperative morbidity and mortality, are improved – especially for complex surgical procedures – if performed within high-volume hospitals and by high-volume surgeons [4–15]. It is intuitive that improvements in outcomes result from the enhanced performance gained through increased practice and experience – “practice makes perfect”! This volume-outcomes relationship exists on different levels. At the individual level, a surgeon is able to reduce operative time and blood loss as well as intra- and postoperative complications through increasing expertise in the field [16–20]. At the structural level, a high-volume hospital is able to implement evidence-based guidelines and provide excellence through multidisciplinary team work [2, 21–23].
The volume-outcomes relationship for high-risk gastrointestinal cancer surgery has been demonstrated in various studies in several countries [10, 11, 20, 24, 25]. However, to the best of our knowledge, there are no data in Switzerland concerning the type of institutions where patients undergo high-risk cancer surgery and if, as shown in other countries, a relationship exists between low hospital volume and worse patient outcomes. It is of utmost importance to understand where high-risk cancer surgery procedures in Switzerland are performed and whether a volume-outcomes relationship does exist. Such knowledge represents a key prerequisite of quality of care improvement in Switzerland.
Therefore, the primary objective of this study was to assess whether high-risk surgical procedures for oesophageal, gastric, pancreatic and rectal cancer types are centralised in Switzerland and whether low-volume hospitals have higher rates of postoperative mortality.
Since 1998 the Federal Statistical Office (FSO) has prospectively collected information on all hospitalisations in Switzerland. This database includes detailed information on up to 99 diagnoses and procedures for each individual patient, intensive care unit stay, type of admission and discharge, as well as an identification number and type of the hospital where a specific procedure takes place. The identification number enables calculation of the hospital caseload, such as the number of a specific surgical procedure that has been performed per year at a certain hospital. Based on a federal law, all in-patients with a hospital stay exceeding 24 hours must be recorded. No data are recorded after patient discharge. Hence, this database represents an invaluable, nationwide complete data source to gain insight regarding important aspects of patterns of care in Swiss cancer patients.
The inpatient database from 1999–2012 of the Swiss Federal Statistical Office served as the data source of the present investigation. In this database inpatient treatments in Switzerland are covered with annual reporting from each Swiss hospital. Patients with oesophageal cancer were identified by one of the International Classification of Diseases tenth edition (ICD-10) codes C15.1, C15.2, C15.4, C15.5, or C15.8 in either the primary diagnosis field or in one of 49 secondary diagnosis fields. For patients with gastric, rectal, and pancreatic cancer, the ICD-10 codes C16, C20, and C25 were used. The Swiss Federal Statistical Office data are strictly based on full calendar years from 1 January to 31 December. Data from patients with a hospital stay over 31 December are therefore incomplete. Patients with incomplete coding due to a hospitalisation in two calendar years, patients with emergency admission and patients not undergoing primary cancer resection were excluded (fig. 1).
Figure 1 Definition of patient cohorts.
The 2014 data were imported into a PostgreSQL database and thereafter the above-described selection procedures were performed. Two authors (U. G. and R. W) checked the various analytical steps to create the final data set. The R statistical software (www.r-project.org) was used for statistical analyses. A two-sided p-value <0.05 was considered statistically significant. Chi-square statistics were used to analyse proportions. The primary endpoint of this study was postoperative mortality, defined as in-hospital death after the surgical procedures chosen for the study. As a secondary endpoint, treatment centralisation was assessed. Trends between year and treatment centralisation, as well as hospital volume and mortality were assessed with Spearman’s rank correlation coefficient rho, serving as a nonparametric measure of statistical dependence. Additionally, linear regression analyses were performed to visualise these trends. To further assess the relationship between hospital volume and mortality, univariable and multivariable conditional logistic regression analyses were performed. This was done with stratification for year of diagnosis and dichotomised annual numbers of patients per hospital (low- vs high-volume hospitals), according to the predefined following cut-off values: for oesophageal and gastric cancer, high-volume hospitals were defined by a minimum of more than 10 patients per year; for rectal and pancreatic cancer high-volume hospitals were defined by more than 20 patients per year. These cut-offs were based on the discussions of the Swiss Scientific HSM (highly specialised medicine) board on defining the minimal thresholds for a given hospital to perform a certain high-risk surgical procedure. These analyses were stratified by year to optimally adjust for differences in the coding quality and completeness. We refrained from data-driven “best” cut-off definition, as this approach is methodologically questionable from a statistical point of view and prone to bias.
In addition to univariable and multivariable analyses, propensity score adjusted analyses were performed, with use of the “MatchIt” and the “optmatch” R packages to optimally adjust for potential baseline confounding [26–28]. The distance measure was estimated with a logistic link function of the main effects and interaction to minimise bias. Patients from high-volume hospitals not having a counterpart regarding the distance measure among the patients from low-volume hospitals and vice versa were excluded. Finally, a logistic regression conditional on the subsets obtained by the propensity score matching (“paired analysis”) was performed.
The a priori hypothesis of the analysis was that low-volume hospitals in Switzerland have a higher rate of postoperative mortality after oesophageal, gastric, pancreatic and rectal cancer resection. Based on these a priori stated hypotheses with one primary predictor (hospital volume) and one primary endpoint (in-hospital mortality) per tumour entity no adjustments were made for multiple testing.
Overall, 1487 patients with oesophageal cancer, 4404 patients with gastric cancer, 2668 patients with pancreatic cancer and 9743 patients with rectal cancer underwent cancer resection between 1999 and 2012 (fig. 1). Tables 1, 2, 3 and 4 depict the patient characteristics for the four different cancer entities.
Table 1 Patient characteristics and logistic regression for mortality in oesophageal cancer.
| Patient characteristics | Conditional logistic regression for mortality | ||||||||||
|---|---|---|---|---|---|---|---|---|---|---|---|
| Total |
Low volume
(1–10 per year) |
High volume
(11+ per year) |
Unadjusted analyses | Multivariable analyses | Propensity score-adjusted analyses | ||||||
| n = 1487 | n = 1305 | n = 182 | p-value* |
OR
(95% CI) |
p-value† |
OR
(95% CI) |
p-value† |
OR
(95% CI) |
p-value† | ||
| Hospital volume | 1–10 per year | 1305 (87.8%) | 1305 (100%) | – | – | Reference | 0.087 | Reference | 0.085 | Reference | 0.034 |
| 11+ per year | 182 (12.2%) | – | 182 (100%) | 0.52 (0.22–1.19) |
0.5 (0.22–1.18) |
0.40 (0.16–0.99) |
|||||
| Age | <50 years | 120 (8.1%) | 109 (8.4%) | 11 (6.0%) | 0.738 | Reference | <0.001 | Reference | <0.001 | – | – |
| 50–64 years | 660 (44.4%) | 578 (44.3%) | 82 (45.1%) | 1.23 (0.43–3.52) |
1.26 (0.44–3.62) |
– | |||||
| 65–79 years | 642 (43.2%) | 562 (43.1%) | 80 (44.0%) | 2.20 (0.79–6.10) |
2.25 (0.80–6.31) |
– | |||||
| 80+ years | 65 (4.4%) | 56 (4.3%) | 9 (4.9%) | 5.44 (1.73–17.08) |
5.51 (1.74–17.50) |
– | |||||
| Gender | Male | 1193 (80.2%) | 1048 (80.3%) | 145 (79.7%) | 0.840 | Reference | 0.665 | Reference | 0.896 | – | – |
| Female | 294 (19.8%) | 257 (19.7%) | 37 (20.3%) | 1.12 (0.67–1.86) |
1.03 (0.62–1.73) |
– | |||||
| Swiss nationality | No | 182 (12.2%) | 153 (11.7%) | 29 (15.9%) | 0.105 | Reference | 0.545 | Reference | 0.778 | – | – |
| Yes | 1305 (87.8%) | 1152 (88.3%) | 153 (84.1%) | 1.23 (0.62–2.45) |
1.10 (0.55–2.21) |
– | |||||
| Oesophagectomy | Partial | 722 (48.6%) | 621 (47.6%) | 101 (55.5%) | 0.038 | Reference | 0.532 | Reference | 0.657 | – | – |
| Total | 380 (25.6%) | 347 (26.6%) | 33 (18.1%) | 1.09 (0.64–1.85) |
1.08 (0.64–1.84) |
– | |||||
| With gastrectomy | 385 (25.9%) | 337 (25.8%) | 48 (26.4%) | 1.34 (0.80–2.25) |
1.27 (0.76–2.14) |
– | |||||
| Insurance | General | 974 (65.5%) | 867 (66.4%) | 107 (58.8%) | 0.042 | Reference | 0.759 | Reference | 0.639 | – | – |
| Private | 513 (34.5%) | 438 (33.6%) | 75 (41.2%) | 0.93 (0.60–1.46) |
0.90 (0.57–1.41) |
– | |||||
| Year | 1999–2003 | 430 (28.9%) | 369 (28.3%) | 61 (33.5%) | <0.001 | – | – | – | |||
| 2004–2008 | 546 (36.7%) | 503 (38.5%) | 43 (23.6%) | – | – | – | |||||
| 2009–2012 | 511 (34.4%) | 433 (33.2%) | 78 (42.9%) | – | – | – | |||||
| Mortality | No | 1399 (94.1%) | 1223 (93.7%) | 176 (96.7%) | 0.110 | – | – | – | |||
| Yes | 88 (5.9%) | 82 (6.3%) | 6 (3.3%) | – | – | – | |||||
* Chi-square test; † likelihood ratio test n (%) for patient characteristics and odds ratio (OR) with 95% confidence interval (95% CI)
Table 2 Patient characteristics and logistic regression for mortality in gastric cancer.
| Patient characteristics | Conditional logistic regression for mortality | ||||||||||
|---|---|---|---|---|---|---|---|---|---|---|---|
| Total |
Low volume
(1–10 per year) |
High volume
(11+ per year) |
Unadjusted analyses | Multivariable analyses | Propensity score-adjusted analyses | ||||||
| n = 4404 | n = 3245 | n = 1159 | p-value* |
OR
(95% CI) |
p-value† |
OR
(95% CI) |
p-value† |
OR
(95% CI) |
p-value† | ||
| Hospital volume | 1–10 per year | 3245 (73.7%) | 3245 (100%) | – | Reference | 0.013 | Reference | 0.032 | Reference | 0.048 | |
| 11+ per year | 1159 (26.3%) | 1159 (100%) | 0.65 (0.45–0.93) |
0.68 (0.48–0.98) |
0.67 (0.45–1.00) |
||||||
| Age | <50 years | 564 (12.8%) | 366 (11.3%) | 198 (17.1%) | <0.001 | Reference | <0.001 | Reference | <0.001 | – | – |
| 50–64 years | 1175 (26.7%) | 859 (26.5%) | 316 (27.3%) | 2.74 (1.15–6.54) |
2.64 (1.10–6.31) |
– | |||||
| 65–79 years | 1968 (44.7%) | 1471 (45.3%) | 497 (42.9%) | 4.99 (2.19–11.38) |
5.09 (2.21–11.71) |
– | |||||
| 80+ years | 697 (15.8%) | 549 (16.9%) | 148 (12.8%) | 8.21 (3.54–19.04) |
9.48 (4.02–22.38) |
– | |||||
| Gender | Male | 2675 (60.7%) | 1968 (60.6%) | 707 (61.0%) | 0.832 | Reference | 0.002 | Reference | 0.001 | – | – |
| Female | 1729 (39.3%) | 1277 (39.4%) | 452 (39.0%) | 0.62 (0.45–0.84) |
0.61 (0.45–0.84) |
– | |||||
| Swiss nationality | No | 1042 (23.7%) | 700 (21.6%) | 342 (29.5%) | <0.001 | Reference | 0.023 | Reference | 0.717 | – | – |
| Yes | 3362 (76.3%) | 2545 (78.4%) | 817 (70.5%) | 1.51 (1.04–2.18) |
1.07 (0.73–1.58) |
– | |||||
| Gastrectomy | Distal | 2095 (47.6%) | 1597 (49.2%) | 498 (43.0%) | <0.001 | Reference | 0.005 | Reference | <0.001 | – | – |
| Total | 2309 (52.4%) | 1648 (50.8%) | 661 (57.0%) | 1.50 (1.13–2.01) |
1.85 (1.38–2.48) |
– | |||||
| Insurance | General | 3245 (73.7%) | 2371 (73.1%) | 874 (75.4%) | 0.120 | Reference | 0.310 | Reference | 0.223 | – | |
| Private | 1159 (26.3%) | 874 (26.9%) | 285 (24.6%) | 0.85 (0.61–1.18) |
0.82 (0.58–1.14) |
– | – | ||||
| Year | 1999–2003 | 1500 (34.1%) | 1212 (37.3%) | 288 (24.8%) | <0.001 | – | – | – | |||
| 2004–2008 | 1590 (36.1%) | 1181 (36.4%) | 409 (35.3%) | – | – | – | |||||
| 2009–2012 | 1314 (29.8%) | 852 (26.3%) | 462 (39.9%) | – | – | – | |||||
| Mortality | No | 4206 (95.5%) | 3085 (95.1%) | 1121 (96.7%) | 0.020 | – | – | – | |||
| Yes | 198 (4.5%) | 160 (4.9%) | 38 (3.3%) | – | – | – | |||||
* Chi-square test; † likelihood ratio test n (%) for patient characteristics and odds ratio (OR) with 95% confidence interval (95% CI)
Table 3 Patient characteristics and logistic regression for mortality in pancreatic cancer.
| Patient characteristics | Conditional logistic regression for mortality | ||||||||||
|---|---|---|---|---|---|---|---|---|---|---|---|
| Total |
Low volume
(1–20 per year) |
High volume
(21+ per year) |
Unadjusted analyses | Multivariable analyses | Propensity score-adjusted analyses | ||||||
| n = 2668 | n = 2467 | n = 201 | p-value* |
OR
(95% CI) |
p-value† |
OR
(95% CI) |
p-value† |
OR
(95% CI) |
p-value† | ||
| Hospital volume | 1–20 per year | 2467 (92.5%) | 2467 (100%) | – | Reference | 0.005 | Reference | 0.011 | Reference | 0.027 | |
| 21+ per year | 201 (7.5%) | 201 (100%) | 0.29 (0.10–0.81) |
0.32 (0.11–0.89) |
0.32 (0.10–1.00) |
||||||
| Age | <50 years | 261 (9.8%) | 234 (9.5%) | 27 (13.4%) | 0.099 | Reference | <0.001 | Reference | <0.001 | – | – |
| 50–64 years | 898 (33.7%) | 831 (33.7%) | 67 (33.3%) | 4.41 (1.05–18.46) |
4.49 (1.07–18.87) |
– | |||||
| 65–79 years | 1298 (48.7%) | 1212 (49.1%) | 86 (42.8%) | 8.92 (2.19–36.22) |
9.24 (2.26–37.75) |
– | |||||
| 80+ years | 211 (7.9%) | 190 (7.7%) | 21 (10.4%) | 11.60 2.69–50.03) |
12.96 (2.98–56.28) |
– | |||||
| Gender | Male | 1368 (51.3%) | 1265 (51.3%) | 103 (51.2%) | 0.993 | Reference | 0.189 | Reference | 0.164 | – | – |
| Female | 1300 (48.7%) | 1202 (48.7%) | 98 (48.8%) | 0.80 (0.57–1.12) |
0.79 (0.56–1.10) |
– | |||||
| Swiss nationality | No | 356 (13.3%) | 333 (13.5%) | 23 (11.4%) | 0.410 | Reference | 0.871 | Reference | 0.433 | – | – |
| Yes | 2312 (86.7%) | 2134 (86.5%) | 178 (88.6%) | 0.96 (0.59–1.56) |
0.82 (0.50–1.34) |
– | |||||
| OP | Pancreatico-duodenectomy | 1334 (50.0%) | 1263 (51.2%) | 71 (35.3%) | <0.001 | Reference | 0.006 | Reference | 0.023 | – | – |
| Partial pancreatectomy | 1334 (50.0%) | 1204 (48.8%) | 130 (64.7%) | 0.62 (0.44–0.88) |
0.67 (0.48–0.95) |
– | |||||
| Insurance | General | 1572 (58.9%) | 1432 (58.0%) | 140 (69.7%) | 0.001 | Reference | 0.123 | Reference | 0.030 | – | |
| Private | 1096 (41.1%) | 1035 (42.0%) | 61 (30.3%) | 0.76 (0.54–1.08) |
0.68 (0.48–0.97) |
– | – | ||||
| Year | 1999–2003 | 639 (24.0%) | 639 (25.9%) | 0 (0.0%) | <0.001 | – | – | – | |||
| 2004–2008 | 998 (37.4%) | 950 (38.5%) | 48 (23.9%) | – | – | – | |||||
| 2009–2012 | 1031 (38.6%) | 878 (35.6%) | 153 (76.1%) | – | – | – | |||||
| Mortality | No | 2530 (94.8%) | 2333 (94.6%) | 197 (98.0%) | 0.034 | – | – | – | |||
| Yes | 138 (5.2%) | 134 (5.4%) | 4 (2.0%) | – | – | – | |||||
OP = operation * Chi-square test; † likelihood ratio test n (%) for patient characteristics and odds ratio (OR) with 95% confidence interval (95% CI)
To assess the treatment centralisation, the mean annual number of patients per hospital undergoing resection of a certain cancer was correlated with the year of diagnosis. For all cancer entities, a relevant treatment centralisation was observed, with a significantly increasing mean annual numbers of patients per hospital (fig. 2a, b, c and d). For pancreatic cancer, the mean number of patients per hospital and annum increased from 1999 to 2012 from 3 to 7 patients (p <0.001), for rectal cancer from 6 to 12 patients (p <0.001), for gastric cancer from 3 to 5 patients (p <0.001) and for oesophageal cancer from 3 to 4 patients (p <0.001).
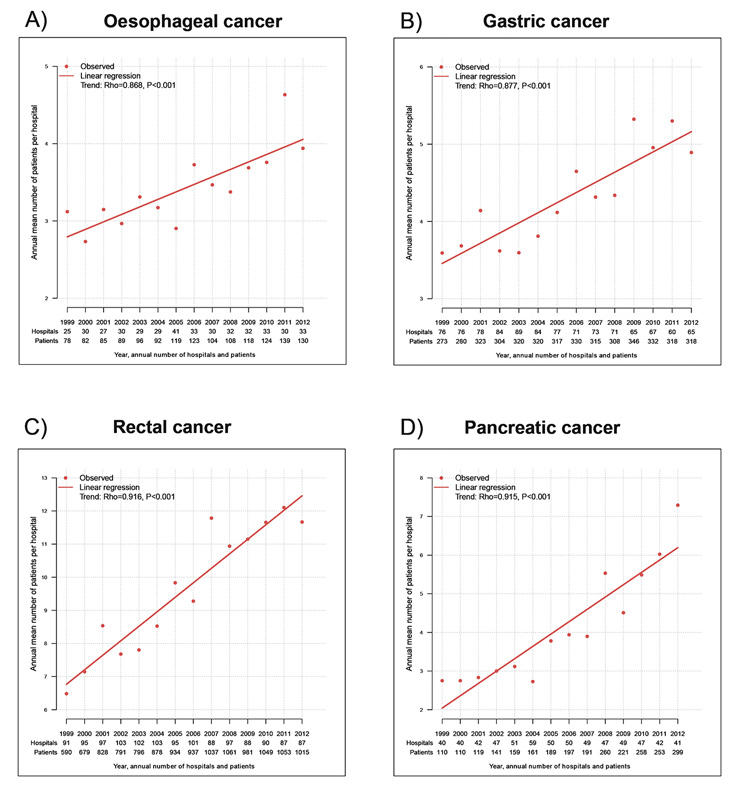
Figure 2 Treatment centralisation.
The annual number of hospitals/patients is displayed on the x-axes, the annual mean number of patients per hospital shown on the y-axes. The time trend analyses were performed using Spearman`s rank correlation.
To assess the impact of hospital volume on postoperative mortality, the association between the annual numbers of patients per hospital undergoing resection for a certain cancer were correlated with the rate of mortality (fig. 3). For all four cancer entities, a significant inverse association was observed, with higher mortality rates for hospitals with lower volumes and vice versa. The decrease of postoperative mortality from low-volume to high-volume hospitals was from 6.3 to 3.3% for oesophageal cancer (p = 0.019), 4.9 to 3.3% for gastric cancer (p = 0.023), 5.4 to 2.0% for pancreatic cancer (p = 0.037) and 2.4 to 1.6% for rectal cancer (p = 0.008).
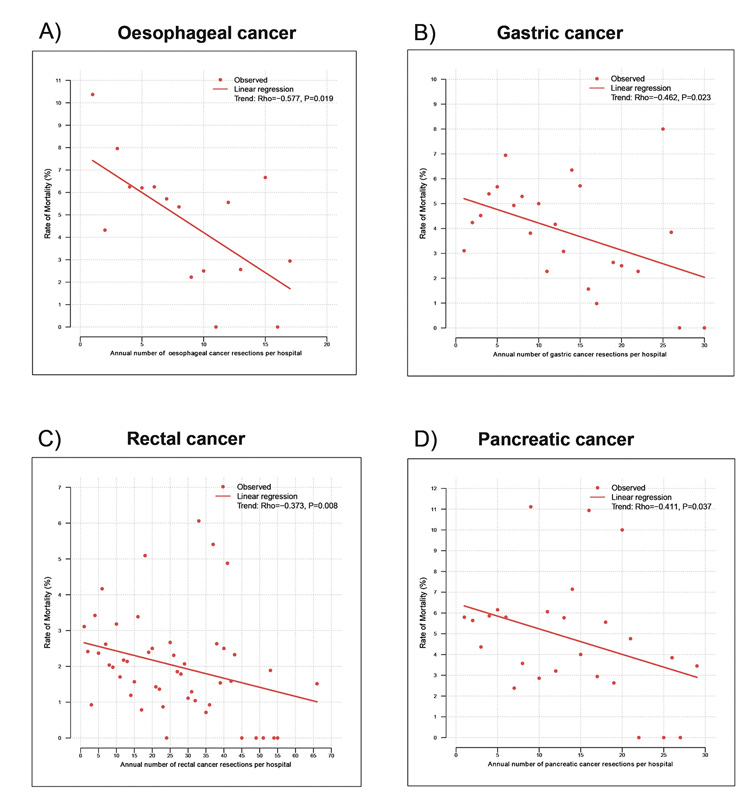
Figure 3 Hospital volume and mortality.
Panels A, B, C and D demonstrate a significant correlation between hospital volume and mortality after resection of oesophageal, gastric, pancreatic and rectal cancer. For each tumour entity the annual number of patients per hospital is plotted against the mortality rate. A trend analysis was performed with Spearman’s rank correlation.
These results were confirmed in risk-adjusted analyses with a decreased odds of postoperative death by of 49% for oesophageal (odds ratio [OR] 0.51, 95% confidence interval [CI] 0.22–1.18; p = 0.085), 32% for gastric (OR 0.68, 95% CI 0.48–0.98; p = 0.032), 68% for pancreatic (OR 0.32, 95% CI 0.11–0.89; p = 0.011) and 29% for rectal cancer (OR 0.71, 95% CI 0.52–0.98; p = 0.033). These findings were further supported by a significantly reduced odds for mortality in propensity score matched analyses for all entities (tables 1, 2, 3, 4 ).
Table 4 Patient characteristics and logistic regression for mortality in rectal cancer.
| Patient characteristics | Conditional logistic regression for mortality | ||||||||||
|---|---|---|---|---|---|---|---|---|---|---|---|
| Total |
Low volume
(1–20 per year) |
High volume
(21+ per year) |
Unadjusted analyses | Multivariable analyses | Propensity score-adjusted analyses | ||||||
| n = 9743 | n = 6552 | n = 3191 | p-value* |
OR
(95% CI) |
p-value† |
OR
(95% CI) |
p-value† |
OR
(95% CI) |
p-value† | ||
| Hospital volume | 1–20 per year | 6552 (67.2%) | 6552 (100%) | – | Reference | 0.008 | Reference | 0.033 | Reference | 0.014 | |
| 21+ per year | 3191 (32.8%) | 3191 (100%) | 0.66 (0.48–0.90) |
0.71 (0.52–0.98) |
0.65 (0.45–0.92) |
||||||
| Age | <50 years | 751 (7.7%) | 474 (7.2%) | 277 (8.7%) | 0.001 | Reference | <0.001 | Reference | <0.001 | – | – |
| 50–64 years | 3072 (31.5%) | 2014 (30.7%) | 1058 (33.2%) | 1.17 (0.45–3.07) |
1.11 (0.42–2.92) |
– | |||||
| 65–79 years | 4497 (46.2%) | 3065 (46.8%) | 1432 (44.9%) | 2.95 (1.20–7.26) |
2.73 (1.11–6.76) |
– | |||||
| 80+ years | 1423 (14.6%) | 999 (15.2%) | 424 (13.3%) | 10.15 (4.13–24.96) |
9.95 (4.02–24.59) |
– | |||||
| Gender | Male | 6101 (62.6%) | 4069 (62.1%) | 2032 (63.7%) | 0.131 | Reference | <0.001 | Reference | <0.001 | – | – |
| Female | 3642 (37.4%) | 2483 (37.9%) | 1159 (36.3%) | 0.59 (0.43–0.80) |
0.50 (0.37–0.69) |
– | |||||
| Swiss nationality | No | 1398 (14.3%) | 905 (13.8%) | 493 (15.4%) | 0.031 | Reference | 0.037 | Reference | 0.453 | – | – |
| Yes | 8345 (85.7%) | 5647 (86.2%) | 2698 (84.6%) | 1.58 (1.00–2.51) |
1.19 (0.75–1.90) |
– | |||||
| Rectal resection | Rectal resection | 7230 (74.2%) | 4821 (73.6%) | 2409 (75.5%) | 0.049 | Reference | 0.616 | Reference | 0.772 | – | – |
| Pull-through | 495 (5.1%) | 354 (5.4%) | 141 (4.4%) | 1.19 (0.66–2.14) |
1.25 (0.69–2.26) |
– | |||||
| Abdomino-perineal | 2018 (20.7%) | 1377 (21.0%) | 641 (20.1%) | 1.16 (0.84–1.60) |
1.02 (0.73–1.41) |
– | |||||
| Insurance | General | 6459 (66.3%) | 4459 (68.1%) | 2000 (62.7%) | <0.001 | Reference | 0.098 | Reference | 0.281 | – | – |
| Private | 3284 (33.7%) | 2093 (31.9%) | 1191 (37.3%) | 0.78 (0.58–1.05) |
0.85 (0.63–1.15) |
– | |||||
| Year | 1999–2003 | 2895 (29.7%) | 2023 (30.9%) | 872 (27.3%) | <0.001 | – | – | – | |||
| 2004–2008 | 3718 (38.2%) | 2572 (39.3%) | 1146 (35.9%) | – | – | – | |||||
| 2009-2012 | 3130 (32.1%) | 1957 (29.9%) | 1173 (36.8%) | – | – | – | |||||
| Mortality | No | 9532 (97.8%) | 6393 (97.6%) | 3139 (98.4%) | 0.011 | – | – | – | |||
| Yes | 211 (2.2%) | 159 (2.4%) | 52 (1.6%) | – | – | – | |||||
* Chi-square test; † likelihood ratio test n (%) for patient characteristics and odds ratio (OR) with 95% confidence interval (95% CI)
Our population-based analyses provide evidence that patients undergoing oesophageal, gastric, pancreatic and rectal cancer resection in low-volume hospitals in Switzerland have remarkably higher postoperative mortality rates compared with those in high-volume hospitals. Indeed, for all cancer entities there was a relative decrease of postoperative mortality of between 29 and 68% in high-volume hospitals. These clinically relevant results demonstrate that high-risk surgical procedures such as oesophageal, gastric, pancreatic and rectal cancer resection must be performed in high-volume hospitals in Switzerland.
The awareness of the hospital volume-outcomes relationship for high-risk surgical procedures started with the landmark publication by Birkmeyer and colleagues in the New England Journal of Medicine in 2002 [11]. In this key study, the investigators convincingly showed that lower hospital volume is associated with significantly increased mortality for different cancer surgeries. Indeed, the postoperative mortality for pancreatic cancer resections decreased from 16.3% in low-volume hospitals to 3.8% in high-volume centres. Similarly, the postoperative mortality for oesophageal cancer resection decreased from 20.3% in low-volume hospitals to only 8.4% in high-volume centres [11].
A year later, the same group of investigators reported on surgeon experience and postoperative mortality after various cancer operations in the US [10]. They concluded that patients have the lowest risk of dying of a cancer surgery if operated in a high-volume hospital by a surgeon who performs the specific cancer operation frequently.
The observed relationship between hospital volume and patient outcomes may be explained by several factors. A mortality decrease was shown to be associated with repetition of a specific operational procedure [29]. It is intuitive that a well-trained and experienced surgeon is able to reduce operative time, blood loss, and intra- and postoperative complications through increasing expertise in the field [2, 16, 20, 30]. Furthermore, at the structural level, high-volume hospitals are able to provide excellence through multidisciplinary teamwork [4, 17, 21]. For the treatment of oesophageal, gastric, pancreatic and rectal cancer, the collaboration between medical oncologists, radiation oncologists, gastroenterologists, radiologists, interventional radiologists and pathologists are of key importance [2, 30] and have become increasingly relevant over recent years. Moreover, there also needs to be an experienced hospital team, including nurses, physical therapists and technical staff, to look after these patients. This multidisciplinary care is not a given at smaller hospitals and exists usually only in larger health care centres. Nonetheless, although this study demonstrates a clear relationship between lower hospital volume and higher mortality, there are small-volume hospitals with low mortality as well as high-volume hospitals with a high rate of post-operative deaths (fig. 3).
There is no doubt that many patient lives could be saved if all surgeons in Switzerland performing complex cancer resections were operating above a certain minimum number of patients per year to improve and maintain their surgical skills. Although we did see some centralisation of high-risk cancer surgery in Switzerland over time, our study demonstrates that there are still many low-volume hospitals and low-volume surgeons. Most importantly, even in later time periods, the vast majority of high-risk cancer surgery in Switzerland is still being performed in low-volume hospitals. In the present investigation in Swiss patients, cut-off values of more than 10 patients per year were chosen for oesophageal and gastric cancer and above 20 patients per year for rectal and pancreatic cancer. There was a longstanding debate within the highly specialised Medicine Scientific Board in Switzerland (HSM) about defining cut-offs of operations/year, below which a hospital is not allowed to perform a specific cancer surgery. The debated cut-offs fluctuated between 10 and 20 operations per annum, which is the reason for choosing such predefined limits for the present investigation. However, there is compelling evidence that these cut-offs are too low. Henneman and colleagues convincingly demonstrated, on the basis of over 10 000 patients from the Netherlands Cancer Registry, that for oesophageal cancer resections at least 40 to 60 operations per annum are necessary for each centre [31]. In this Dutch cohort, a patient undergoing an oesophageal cancer resection at a hospital with a volume above 60 operations/year had a 33% mortality reduction compared with a patient operated in a hospital with less than 20 per year. Similarly, cut-offs higher than 10 to 20/annum for pancreatic and gastric cancer surgeries were shown to be associated with lower postoperative mortality rates [20, 32].
In an investigation by Mariette and colleagues presented at the annual conference of the ESMO 2016, the authors convincingly showed a clear relationship between low-volume hospitals and higher mortality in oesophageal and gastric cancer patients [32]. It is noteworthy that the cut-off value for low-volume was set at 20 specific cancer operations per year, not – as in the present investigation – at 10 per year. In the highest volume category, defined as having a case load of 60 oesophageal or gastric cancer resections or higher, the 30-day postoperative mortality reduction was from 5.7% in low-volume hospitals to 1.7% in high-volume hospitals, the 90-day mortality rate from 10.2% in low-volume to 3.6% in high-volume hospitals.
The limitations of the present investigation arise from information, which cannot be ascertained from the database of the Federal Statistical Office such as pathological stages, grading, chemotherapeutic treatments, comorbidities and performance status. Hence, it cannot be determined to what extent these factors might have influenced our analysis. However, the population-based nature of the database, with a large number of patients, is associated with a high degree of generalisability and mirrors the real-world situation in Switzerland. Furthermore, the results of unadjusted analysis were confirmed by multivariable and propensity score adjusted analyses.
The present population-based analysis – the first of its kind in the literature - demonstrates that post-operative mortality rates after oesophageal, gastric, pancreatic and rectal cancer resection are increased in low-volume hospitals in Switzerland. Therefore, high-risk operations should preferably be performed in high-volume hospitals to ensure optimal patient outcomes in Switzerland.
This study was supported through a grant of the Swiss Cancer Foundation. The grant was used to compensate the data manager and statistician (RW) of the present study. The authors have no conflict of interest.
1 Douek M , Taylor I . Good practice and quality assurance in surgical oncology. Lancet Oncol. 2003;4(10):626–30. doi:.https://doi.org/10.1016/S1470-2045(03)01222-1
2 Hohenberger W , Merkel S , Hermanek P . Volume and outcome in rectal cancer surgery: the importance of quality management. Int J Colorectal Dis. 2013;28(2):197–206. doi:.https://doi.org/10.1007/s00384-012-1596-2
3 Aquina CT , Probst CP , Becerra AZ , Iannuzzi JC , Kelly KN , Hensley BJ , et al. High volume improves outcomes: The argument for centralization of rectal cancer surgery. Surgery. 2016;159(3):736–48. doi:.https://doi.org/10.1016/j.surg.2015.09.021
4 Markar SR , Karthikesalingam A , Thrumurthy S , Low DE . Volume-outcome relationship in surgery for esophageal malignancy: systematic review and meta-analysis 2000-2011. J Gastrointest Surg. 2012;16(5):1055–63. doi:.https://doi.org/10.1007/s11605-011-1731-3
5 Hata T , Motoi F , Ishida M , Naitoh T , Katayose Y , Egawa S , et al. Effect of Hospital Volume on Surgical Outcomes After Pancreaticoduodenectomy: A Systematic Review and Meta-analysis. Ann Surg. 2016;263(4):664–72. doi:.https://doi.org/10.1097/SLA.0000000000001437
6 Dikken JL , Dassen AE , Lemmens VE , Putter H , Krijnen P , van der Geest L , et al. Effect of hospital volume on postoperative mortality and survival after oesophageal and gastric cancer surgery in the Netherlands between 1989 and 2009. Eur J Cancer. 2012;48(7):1004–13. doi:.https://doi.org/10.1016/j.ejca.2012.02.064
7 Coupland VH , Lagergren J , Lüchtenborg M , Jack RH , Allum W , Holmberg L , et al. Hospital volume, proportion resected and mortality from oesophageal and gastric cancer: a population-based study in England, 2004-2008. Gut. 2013;62(7):961–6. doi:.https://doi.org/10.1136/gutjnl-2012-303008
8 Colavita PD , Tsirline VB , Belyansky I , Swan RZ , Walters AL , Lincourt AE , et al. Regionalization and outcomes of hepato-pancreato-biliary cancer surgery in USA. J Gastrointest Surg. 2014;18(3):532–41. doi:.https://doi.org/10.1007/s11605-014-2454-z
9 Yoshioka R , Yasunaga H , Hasegawa K , Horiguchi H , Fushimi K , Aoki T , et al. Impact of hospital volume on hospital mortality, length of stay and total costs after pancreaticoduodenectomy. Br J Surg. 2014;101(5):523–9. doi:.https://doi.org/10.1002/bjs.9420
10 Birkmeyer JD , Stukel TA , Siewers AE , Goodney PP , Wennberg DE , Lucas FL . Surgeon volume and operative mortality in the United States. N Engl J Med. 2003;349(22):2117–27. doi:.https://doi.org/10.1056/NEJMsa035205
11 Birkmeyer JD , Siewers AE , Finlayson EV , Stukel TA , Lucas FL , Batista I , et al. Hospital volume and surgical mortality in the United States. N Engl J Med. 2002;346(15):1128–37. doi:.https://doi.org/10.1056/NEJMsa012337
12 Meagher AP . Colorectal cancer: is the surgeon a prognostic factor? A systematic review. Med J Aust. 1999;171(6):308–10.
13 Guller U , Safford S , Pietrobon R , Heberer M , Oertli D , Jain NB . High hospital volume is associated with better outcomes for breast cancer surgery: analysis of 233,247 patients. World J Surg. 2005;29(8):994–9, discussion 999–1000. doi:.https://doi.org/10.1007/s00268-005-7831-z
14 Finks JF , Osborne NH , Birkmeyer JD . Trends in hospital volume and operative mortality for high-risk surgery. N Engl J Med. 2011;364(22):2128–37. doi:.https://doi.org/10.1056/NEJMsa1010705
15 Begg CB , Cramer LD , Hoskins WJ , Brennan MF . Impact of hospital volume on operative mortality for major cancer surgery. JAMA. 1998;280(20):1747–51. doi:.https://doi.org/10.1001/jama.280.20.1747
16 Derogar M , Sadr-Azodi O , Johar A , Lagergren P , Lagergren J . Hospital and surgeon volume in relation to survival after esophageal cancer surgery in a population-based study. J Clin Oncol. 2013;31(5):551–7. doi:.https://doi.org/10.1200/JCO.2012.46.1517
17 Pecorelli N , Balzano G , Capretti G , Zerbi A , Di Carlo V , Braga M . Effect of surgeon volume on outcome following pancreaticoduodenectomy in a high-volume hospital. J Gastrointest Surg. 2012;16(3):518–23. doi:.https://doi.org/10.1007/s11605-011-1777-2
18 Yeo HL , Abelson JS , Mao J , O’Mahoney PR , Milsom JW , Sedrakyan A . Surgeon Annual and Cumulative Volumes Predict Early Postoperative Outcomes after Rectal Cancer Resection. Ann Surg. 2017;265(1):151–7.
19 Liu CJ , Chou YJ , Teng CJ , Lin CC , Lee YT , Hu YW , et al. Association of surgeon volume and hospital volume with the outcome of patients receiving definitive surgery for colorectal cancer: A nationwide population-based study. Cancer. 2015;121(16):2782–90. doi:.https://doi.org/10.1002/cncr.29356
20 Mamidanna R , Ni Z , Anderson O , Spiegelhalter SD , Bottle A , Aylin P , et al. Surgeon Volume and Cancer Esophagectomy, Gastrectomy, and Pancreatectomy: A Population-based Study in England. Ann Surg. 2016;263(4):727–32. doi:.https://doi.org/10.1097/SLA.0000000000001490
21 Derogar M , Blomberg J , Sadr-Azodi O . Hospital teaching status and volume related to mortality after pancreatic cancer surgery in a national cohort. Br J Surg. 2015;102(5):548–57, discussion 557. doi:.https://doi.org/10.1002/bjs.9754
22 Sutton JM , Wilson GC , Wima K , Hoehn RS , Cutler Quillin R, 3rd , Hanseman DJ , et al. Readmission After Pancreaticoduodenectomy: The Influence of the Volume Effect Beyond Mortality. Ann Surg Oncol. 2015;22(12):3785–92. doi:.https://doi.org/10.1245/s10434-015-4451-1
23 Ess S , Joerger M , Frick H , Probst-Hensch N , Vlastos G , Rageth C , et al. Predictors of state-of-the-art management of early breast cancer in Switzerland. Ann Oncol. 2011;22(3):618–24. doi:.https://doi.org/10.1093/annonc/mdq404
24 Munasinghe A , Markar SR , Mamidanna R , Darzi AW , Faiz OD , Hanna GB , et al. Is It Time to Centralize High-risk Cancer Care in the United States? Comparison of Outcomes of Esophagectomy Between England and the United States. Ann Surg. 2015;262(1):79–85. doi:.https://doi.org/10.1097/SLA.0000000000000805
25 Brusselaers N , Mattsson F , Lagergren J . Hospital and surgeon volume in relation to long-term survival after oesophagectomy: systematic review and meta-analysis. Gut. 2014;63(9):1393–400. doi:.https://doi.org/10.1136/gutjnl-2013-306074
26 Rosenbaum PR . Model-Based Direct Adjustment. J Am Stat Assoc. 1987;82(398):387–94. doi:.https://doi.org/10.1080/01621459.1987.10478441
27 Ho DE , Imai K , King G , Stuart EA . MatchIt: Nonparametric preprocessing for parametric causal inference. J Stat Softw. 2011;42(8):1–28. doi:.https://doi.org/10.18637/jss.v042.i08
28 Hansen BB , Klopfer SO . Optimal full matching and related designs via network flows. J Comput Graph Stat. 2006;15(3):609–27. doi:.https://doi.org/10.1198/106186006X137047
29 Seymour NE , Gallagher AG , Roman SA , O’Brien MK , Bansal VK , Andersen DK , et al. Virtual reality training improves operating room performance: results of a randomized, double-blinded study. Ann Surg. 2002;236(4):458–63, discussion 463–4. doi:.https://doi.org/10.1097/00000658-200210000-00008
30 Hall GM , Shanmugan S , Bleier JI , Jeganathan AN , Epstein AJ , Paulson EC . Colorectal specialization and survival in colorectal cancer. Colorectal Dis. 2016;18(2):O51–60. doi:.https://doi.org/10.1111/codi.13246
31 Henneman D , Dikken JL , Putter H , Lemmens VE , Van der Geest LG , van Hillegersberg R , et al. Centralization of esophagectomy: how far should we go? Ann Surg Oncol. 2014;21(13):4068–74. doi:.https://doi.org/10.1245/s10434-014-3873-5
32Gronnier C, Pasquer A, Renaud F, Hec F, Gandon A, Vanderbeken M, et al. Is centralization needed for esophago-gastric cancer patients with low operative risk? a nationwide study, in ESMO 2016, oral presentation. 2016: Copenhagen.
This study was supported through a grant of the Swiss Cancer Foundation. The grant was used to compensate the data manager and statistician (RW) of the present study. The authors have no conflict of interest.