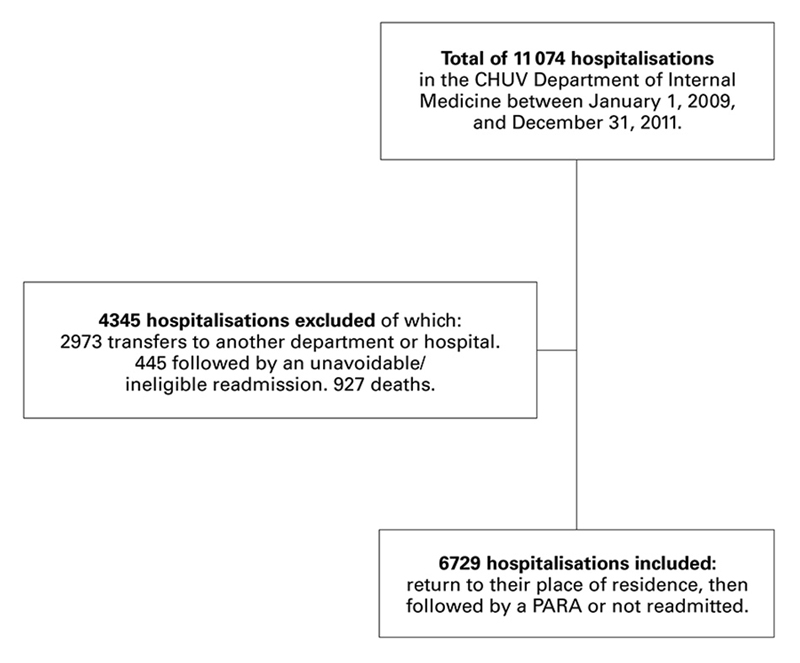
Figure 1 Details of hospitalisations included in and excluded from the analysis to develop a risk prediction model for potentially avoidable readmission (PARA).
DOI: https://doi.org/10.4414/smw.2017.14470
Identifying patients at high risk of post-discharge readmission is a crucial step in lowering readmission rates. However, there is a need to distinguish between an unavoidable readmission and a potentially avoidable readmission (PARA). PARA is defined as unforeseen readmission related to a condition already known during the index hospitalisation. The PARA rate is the main indicator of a successful transition between hospital and home. These particular readmissions represent the improvement margin for implementing specific interventions that may reduce readmission rates.
A computerised validated algorithm, SQLape® (Striving for Quality Level and analysing of patient expenditures) was developed to identify PARAs. It is calculated from Swiss medical statistics, in particular International Classification of Diseases (ICD) and Swiss Procedure codes (abridged CHOP). It retrospectively identified PARAs with high sensitivity (96%) and specificity (96%) when compared with medical record review in a random sample of admission-readmission pair [1, 2]. However, since first publication, the Swiss classification has been adapted, and specificity and/or sensitivity have not been evaluated in other studies. This indicator is also employed on a wider scale in Switzerland by the Swiss Association for Quality in Hospitals and Clinics in order to better evaluate quality of care.
Several risk factors for unplanned readmission within 30 days of hospital discharge have been identified in various studies [3–7]. This has led to the development of risk prediction models for readmission. Their goal is to help clinicians to identify patients at high risk of readmission so that preventive strategies may be put in place. However, these models have often been validated in very different settings (surgical vs medical wards, hospitals of different sizes, and different countries with specific healthcare systems). Moreover, many models have investigated all readmissions together rather than PARAs. These various models have ultimately proved to only moderately predict readmission, as demonstrated by two publications, including a systematic review [8, 9] in which only one of 36 models investigated PARA [2]. Several models used the Charlson index, which was developed over 20 years ago and specifically designed to predict mortality. In view of the complexity of current care, this index alone does not suffice to predict PARAs. More recently, the HOSPITAL score has been developed and validated in Boston [7]. This score predicts PARAs, but, since health systems differ, a single score is not enough to predict PARAs. The LACE score predicts the risk of early death or unplanned readmission. The performance of the LACE seems to be poor in older people and in any case lower than the HOSPITAL score [10, 11]. The LACE and the HOSPITAL scores were externally validated. The HOSPITAL score was validated externally in a large cohort of 117 065 patients in four countries, including Bern for Switzerland [12]. An adapted HOSPITAL score was validated with 346 patients >50 years old in Fribourg, Switzerland [13]. Thus, a wider application of the original HOSPITAL score in Switzerland may be limited: (1) the mean length of hospital stay is longer in Switzerland than in the USA; (2) a specific oncology division is not available in all hospitals; (3) most admissions in a service of internal medicine are urgent and not elective.
Our study had two aims, of which the first was to retrospectively calculate the proportion of PARAs at day 30 following discharge for all hospitalisations in the Department of Internal Medicine of the Centre Hospitalier Universitaire Vaudois (CHUV) in Lausanne, Switzerland. Our teaching hospital department contains 187 acute care beds, including 14 intermediate care beds. It is the only internal medicine department for around 300 000 patients. Secondly, we sought to develop a model to predict PARAs for the patients returning back home, identifying factors able to discriminate between the groups “hospitalisation followed by PARA” and “hospitalisation not followed by readmission”. The performance of this model was then compared with the LACE and the HOSPITAL scores.
From the 11 074 hospitalisations between 1 January 2009, and 31 December 2011, we included those whose destination after discharge was their place of residence, i.e., their home or a residential care centre. Hospitalisations that ended in a transfer to another department, another hospital, intensive care, or a rehabilitation centre were excluded, this being considered as treatment continuation and not discharge. The aim was to build a risk prediction model for PARA of a population for whom improvement measures could be put in place. Thus, we excluded from the analysis hospitalisations that were interrupted by death, hospitalisations followed by a readmission that was ineligible for the algorithm and hospitalisations followed by an unavoidable readmission according to SQLape®. The question that we needed to answer was therefore: in the population of patients who leave our department to return to their place of residence, what differentiates those who will be readmitted for potentially avoidable reasons from those who will not be readmitted? This question enabled us to define the inclusion and exclusion criteria for all the hospitalisations (fig. 1).
Figure 1 Details of hospitalisations included in and excluded from the analysis to develop a risk prediction model for potentially avoidable readmission (PARA).
Data relating to the hospitalisations was extracted from the hospital data system. It was drawn from three categories: medical-administrative data, laboratory results and information on pharmacological treatments.
With these data, we were able to identify hospitalisation durations, diagnoses and procedures. The readmissions and times to readmission were calculated from the database using patient numbers, as well as the dates of both admission and discharge. Only patients readmitted to the CHUV could be identified as readmitted. Data extracted were: age, gender, where the patient came from on admission, where the patient went to at discharge, diagnosis-related group and severity, Charlson score [14] as calculated according to diagnosis codes (ICD-10), Swiss procedure codes (CHOP), duration of index admission, and number of admissions to the CHUV at 6 and 12 months beforehand. When a patient was hospitalised several times, each readmission became the index stay for the following readmission.
PARAs were identified by means of the computer program SQLape® (version 2011). All patients were considered eligible, except those who died or were transferred to another hospital, those who were outpatient surgery candidates and those living abroad. Readmission (of eligible patients only) was deemed potentially avoidable if it was related to a diagnosis already known during the index stay, was not foreseeable during the index stay, and occurred within 30 days of discharge after the index stay. The following readmissions were considered to be planned and, therefore, unavoidable: organ transplantation, chemotherapy or radiotherapy, specific surgical procedures or childbirth. Readmissions owing to new conditions that were not known during the index day were deemed unavoidable.
The hospital stays studied were divided into five groups (see fig. 2 in the Results section): (1) interrupted by death; (2) not followed by readmission within 30 days; and (3) followed by readmission within 30 days. This last group was subdivided into: (3a) ineligible according to SQLape® (mostly transferred patients); (3b) unavoidable according to SQLape® (planned readmission or related to a new diagnosis); and (3c) PARA according to SQLape®.
We retained the last value available during the index stay to correlate with the state of the patient at discharge, at the beginning of the transition of care period. We chose parameters identified in the literature as being of prognostic value for morbidity and mortality, such as anaemia [3, 7] or low blood sodium levels [15]. Taking the literature into account, and for simplicity's sake, we opted for a dichotomous distinction of “risk value” versus “non-risk or unavailable value”. We defined risk laboratory values as: blood sodium <135 mmol/l; blood haemoglobin male <133 g/l or female <117 g/l; blood creatinine: male >106 μmol/l or female >80 μmol/l; blood urea male >7.7 mmol/l or female >6.4 mmol/l; blood albumin <35 g/l; serum alanine aminotransferase male >60 U/l or female >36 U/l.
From among the 5000 medications available in the hospital, we defined the following categories: oral or parenteral anticoagulants, oral or parenteral antidiabetics, nonsteroidal anti-inflammatory drugs and antiaggregants, systemic steroids, diuretics, opioids, benzodiazepines, antidepressants, neuroleptics, and, lastly, all the others. We based our selection of these different categories on literature regarding early readmissions in general and emergency admissions owing to drug-related adverse events [9, 16–25]. The following data were extracted: number of medications prescribed during the stay, number of different prescribers during the stay and number of medications prescribed at discharge. For these data, all the medications available in the hospital were considered.
We compared the performance of our score with the LACE and HOSPITAL scores. We collected the information on the four variables included in the LACE score and the seven variables included in the HOSPITAL score, using the same definitions as the derivation studies [3, 7]. We calculated then the C-statistic for both scores in our cohort. The LACE score is the acronym for four variables: Length of stay, Acuity of the admission; Comorbidity (Charlson comorbidity index score) and Emergency department use (number of visits in the 6 months before admission). The scoring system ranges from 0 to a maximum of 19 points. The HOSPITAL score is the acronym for seven variables: Haemoglobin at discharge (<120g/l), Oncology service, Sodium at discharge (<135 mmol/l), Procedures performed, Index admission Type (emergency), number of Admissions in the previous year and Length of stay (>5 days). The scoring system ranges from 0 to a maximum of 13 points. The risk for PARA is classified as low (0–4 points), intermediate (5–6 points) or high (>7 points). In our cohort, 79.9%, 18.8% and 1.3%, respectively, of the patients were classified as low, intermediate or high risk of PARA.
Among all variables described in the previous sections, bivariate analysis was used to select the factors that discriminate between stays followed by a PARA and those that were not followed by any readmission within 30 days in the included population. The nonparametric two-tailed Wilcoxon test was used for all continuous variables, as some of the variables were highly non-normal. The chi-square test was used for categorical variables. The threshold for significance was 0.05 for all tests. A multivariate regression was then applied with stepwise inclusion of the retained factors, and age and gender as these variables might have an impact on the outcome when associated with other frailty scores. On bivariate analysis, the following factors were highly associated with PARA: length of stay (mean ± standard deviation, p <0.001), length of stay >11 days (p <0.001), cancer diagnosis (oncological diagnosis on admission or during hospitalisation, p <0.001), cancer diagnosis with metastasis (p <0.001), ≥1 admission in the previous 12 months (p <0.001), ≥15 different medications prescribed during the stay (p <0.001), Charlson score >1 (p <0.001), blood sodium <135 mmol/l (p <0.001), female sex (p = 0.007). The stepwise threshold level for addition of the model was 0.1, and for removal from the model was 0.2. The following variables were retained in the stepwise procedure: at least one hospitalisation in the 12 months preceding the index admission, cancer diagnosis with metastasis, cancer diagnosis without metastasis and without antidepressant, blood sodium <135 mmol/l, Charlson score >1, length of stay >11 days, and the prescription of at least 15 different medications during the stay. Adjusted odds ratios were calculated. A score was then created to define three levels of risk for PARA: low (≈5%), intermediate (≈10%), and high (≈20%). The resulting model was then tested for validity (assumptions), sensitivity, and specificity. The discrimination power of the score was tested with the C-statistic (or area under receiver operating characteristic [ROC] curve). The calibration of the score was tested using the Hosmer-Lemeshow goodness-of-fit test. Stata® Statistical Software Release 13 was used for all statistical analysis (StataCorp. 2013. College Station, TX: StataCorp LP).
Overall, 11 074 hospitalisations were recorded in the CHUV Department of Internal Medicine between 1 January 2009, and 31 December, 2011. In total, 777 stays (7.02%) were followed by a PARA according to SQLape®. After exclusion of stays interrupted by death (n = 927; 8.37%), transfers to places other than the place of residence (n = 2973; 26.85%), and unavoidable or ineligible readmissions according to SQLape® (n = 445; 4.02%), we retained an analysis group of 6729 hospital stays that were followed by a return to the place of residence. Of these, 777 stays were followed by a PARA; 5952 patients were not readmitted (fig. 2).
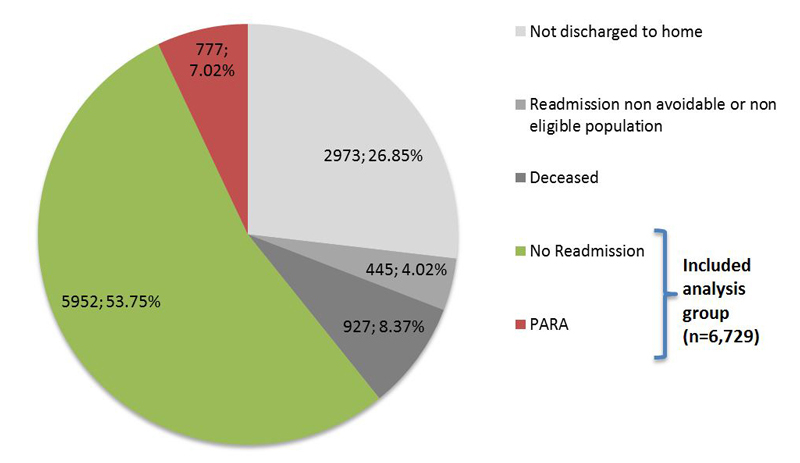
Figure 2 Situation at 30 days after discharge for all hospital stays in the CHUV Department of Internal Medicine (n = 11 074).
PARA = potentially avoidable readmission
The main characteristics distinguishing patients of all hospital stays (n = 11 074) from those included in the analysis (n = 6729) have been provided in Table 1. Table 2 shows the main distinctions between stays followed by a PARA and those not followed by readmission among eligible stays, on bivariate analysis, (n = 6729).
Table 1 Patient characteristics of stays included in the analysis (n = 6729) compared with total stays (n = 11 074).
| Patient characteristics |
All stays
(n = 11 074) |
Stays included
(n = 6729) |
|---|---|---|
| Age (mean ± SD) | 72.0 ± 16.8 | 69.4 ± 17.7 |
| Women (%) | 50.3% | 49.6% |
| Came from place of residence (%) | 92.7% | 96.0% |
| ≥1 admission in the previous 12 months (%) | 49.7% | 46.9% |
| Cancer diagnosis without metastasis (%) | 20.9% | 16.7% |
| Cancer diagnosis with metastasis (%) | 11.1% | 7.3% |
| Length of stay, mean ± SD (median) | 15.9 ± 14.7 (11) | 13.9 ± 12.1 (12) |
SD = standard deviation
Table 2 Patient characteristics that distinguish stays followed by a PARA (n = 777) from those not followed by readmission (n = 5952) among eligible hospital stays (n = 6729).
| Variables |
Not readmitted 30 days after discharge
(n = 5952) |
PARA
(n = 777) |
p-value |
|---|---|---|---|
| Age (mean ± SD) | 69.4 ± 17.8 | 69.0 ± 16.9 | 0.148 |
| Length of stay, mean ± SD (median) | 13.6 ± 12.0 (11) | 16.0 ± 12.7 (12) | <0.001 |
| Length of stay >11 days (%) | 47.0% | 57.1% | <0.001 |
| Women (%) | 50.2% | 45.0% | 0.007 |
| Cancer diagnosis | 14.3% | 34.7% | <0.001 |
| Cancer diagnosis with metastasis (%) | 5.7% | 19.2% | <0.001 |
| ≥1 admission in the previous 12 months (%) | 44.5% | 64.7% | <0.001 |
| ≥15 different medications prescribed during the stay | 45.3% | 56. 9% | <0.001 |
| Charlson score >1 | 45.9% | 67.2% | <0.001 |
| Blood sodium <135 mmol/l | 4.7% | 11.3% | <0.001 |
SD = standard deviation
On multivariate analysis, the variables significantly predictive of readmission were: at least one hospitalisation in the 12 months preceding the index admission, cancer diagnosis, blood sodium <135 mmol/, Charlson score >1, length of stay >11 days, and the prescription of at least 15 different medications during the stay (table 3). The prescription of an antidepressant or neuroleptic during the stay had a protective effect in cancer patients. We observed that the “female” variable was no longer significantly discriminative on multivariate analysis. A score was then created. It ranged from 0 to 10.5 according to the points given at each variable. Three risk categories of PARA were determined: low (0–1.5 points), intermediate (1.5–5 points), high (>5 points).
Table 3 Variables from the multivariate model predicting PARA 30 days after discharge in the included population.
| Variable | Adj OR | Z | p-value | 95% CI | Points |
|---|---|---|---|---|---|
| ≥1 admission in the previous 12 months (%) | 1.96 | 8.10 | <0.001 | 1.67–2.31 | 2 |
| Charlson score >1 | 1.46 | 3.93 | <0.001 | 1.21–1.76 | 1.5 |
| Blood sodium <135 mmol/l | 2.15 | 5.63 | <0.001 | 1.65–2.80 | 2 |
| Length of stay >11 days (%) | 1.36 | 3.66 | <0.001 | 1.15–1.61 | 1.5 |
| ≥15 different medications prescribed during the stay | 1.27 | 2.63 | 0.009 | 1.06–1.52 | 1.5 |
| Cancer diagnosis; interaction with antidepressant therapy: | |||||
| Cancer diagnosis without metastasis, with antidepressant | 1.25 | 0.94 | 0.345 | 0.79–2.00 | |
| Cancer diagnosis without metastasis, without antidepressant | 1.81 | 4.38 | <0.001 | 1.39–2.36 | 2 |
| Cancer diagnosis with metastasis | 3.14 | 9.22 | <0.001 | 2.46–4.00 | 3 |
| Adj = adjusted; CI = confidence interval; OR = odds ratio; PARA = potentially avoidable readmission | |||||
The model thus developed has good predictive value for the risk of PARA, with an area under the ROC curve of 0.696 (fig. 3). The p-value of the Hosmer-Lemeshow goodness-of-fit statistic was 0.69, indicating a good calibration. The patients were then classified as low (n = 1106, 16.4%), intermediate (n = 3322, 49.4%) or high (n = 2301, 34.2%) risk of PARA. The estimated risk of PARA for each category was 3.5%, 8.7% and 19.6%, respectively. The C-statistic for the level of risk was good, but slightly lower at 0.65. The LACE and the HOSPITAL scores were both significantly correlated with the risk of PARA. The discriminatory power of the LACE was lower than our model, with a C-statistic of 0.61. The discriminatory power of the HOSPITAL score to predict PARA was lower than the LACE score and our model, with a C-statistic of 0.54. The C-statistic increased at 0.59 when the HOSPITAL score was used as a continuous variable.
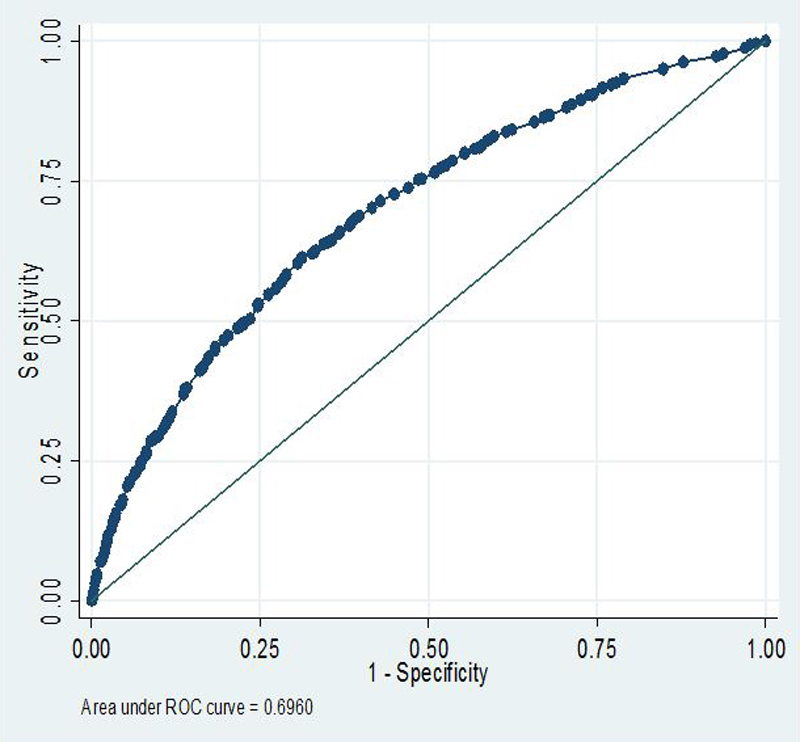
Figure 3 Area under the receiver operating characteristic (ROC) curve of the risk prediction model for potentially avoidable readmission.
Our study aimed to retrospectively analyse hospital stays of patients readmitted to the CHUV Department of Internal Medicine, in order to quantify the proportion of PARAs and then derive from it a risk prediction model. Of the 11 074 hospital stays analysed, 777 stays (7%) were followed by a PARA within 30 days of discharge according to the SQLape® algorithm. Analysis of our group of hospitalisations of interest (n = 6729) enabled us to identify the following risk factors: at least one hospitalisation during the year preceding the index admission, a Charlson score >1, cancer diagnosis, hyponatraemia, a hospital stay >11 days or the prescription of at least 15 different medications during the stay. These variables were used to derive a good quality predictive model for PARA (area under the ROC curve 0.70).
Hospitalisation or emergency department attendance during the months preceding the index admission is a risk factor for readmission that is widely found in the literature [3, 7]. It indicates the patient’s fragility. The Charlson comorbidity score has also been highlighted in certain models, as has the LACE score [3]. It conveys the fact that an accumulation of comorbidities increases the risk of death and also unplanned readmission. The presence of cancer diagnosis was clearly more prevalent in the group of patients readmitted for potentially avoidable reasons than in those who were not readmitted, as in other studies [7]. It may seem surprising that antidepressants had an apparently protective effect against PARAs in cancer patients. This class of drugs is often described as being associated with a high risk of adverse events [17, 25]. Nevertheless, a protective effect with antidepressants has at times been noted in other studies [26]. Of note is that the presence of cancer is also taken into account in the Charlson comorbidity score; this information may thus be partly superfluous. We nevertheless detected no multicollinearity problems in our model. Low blood sodium levels doubled the risk of PARA in our study. This confirms the observations in other scores, like LACE [3] or HOSPITAL [7]. This biological characteristic is often the manifestation of a poorly compensated comorbidity (e.g., cirrhosis or heart failure), a drug-related adverse effect (thiazide diuretic or aldosterone antagonist), or inappropriate antidiuretic hormone secretion syndrome (e.g., due to medication, infection or neoplasia). Median length of stay was slightly longer in patients readmitted for potentially avoidable reasons compared with those not readmitted. This seems logical, since the sickest patients (according to the Charlson score) exhibit a higher risk of being readmitted, and since they are also hospitalised for longer [27]. A longer index stay also increased the risk of readmission in the LACE [3] and HOSPITAL [7] scores, since it expresses the greater complexity and fragility of these patients from medical and social perspectives. Nosocomial illness, deconditioning and undernourishment in the hospital may well contribute to lengthening the duration of the stay. The “prescription of at least 15 different medications during the stay” variable remained associated with readmission after multivariate analysis, which undoubtedly reflected the complexity of the case. To the best of our knowledge, this is to date the only model predictive of readmission that takes this variable into account.
Our model had good ability (C-statistic 0.70) and calibration (Hosmer-Lemeshow 0.69) for predicting the 30-day risk of PARA. The performance was slightly lower with a C-statistic at 0.65 for the level of risk. Our model was compared with the LACE and HOSPITAL scores. The C-statistic was 0.61 for the LACE score and 0.54 for the HOSPITAL score. The C-statistic increased, at 0.59, when the HOSPITAL score was used as a continuous variable.
The HOSPITAL score was externally validated in an international multicentre study of 117 065 patients discharged from the medical departments of nine hospitals in four countries [12]. The discriminatory power of the HOSPITAL score to predict PARA was good, with a C-statistic at 0.72. The C-statistic ranged from 0.78 in Canada to 0.68 in Israel and Switzerland (Bern, University Hospital). The performance of the HOSPITAL score was lower in our cohort since three of seven variables are not discriminative: oncology service, index admission type and length of stay (>5 days). These three variables were modified by Aubert et al. to create an adaptation of the HOSPITAL score [13]. This “new” score showed a good discriminatory power (C-statistic 0.70) and calibration (Hosmer-Lemeshow 0.77) to predict the 30-day risk of PARA or death in the department of general internal medicine of the Fribourg Cantonal Hospital. Owing to the differences within the healthcare system in the same country, three different models are needed in Bern, Fribourg and Lausanne to obtain a good discriminatory power (C-statistic ≈0.70) to predict PARA. In the large external validation cohort, the risk of PARA for the patients with a HOSPITAL score in the low, intermediate and high risk groups were 5.8%, 11.9% and 22.8%, respectively [12]. In the Fribourg study, the estimated risks of PARA or death for each category (calculated with an adapted HOSPITAL score) were 8.2%, 11.3% and 21.6%, respectively [13]. In our cohort, the estimated risk of PARA for each category was 3.5%, 8.7% and 19.6%, respectively. All these results are very close to the categories created in the derivation study of the HOSPITAL score [7], corresponding to 5%, 10% and 20% risk of PARA.
The C-statistic of the LACE score to predict the 30 days risk of PARA or death was 0.56 in Fribourg, very close to the 0.61 described in our cohort [13]. However, the comparison with the LACE score has some limitations: (1) it was derived from a large population of medical and surgical patients; (2) it quantifies the 30-day risk of unplanned readmission or death; and (3) its performance seems to be poor in older people [3, 10].
Except for the number of admissions before the index hospitalisation, all the variables of our model could change during hospitalisation. We decided to take into account the last data available before discharge, because we sought to highlight “the state of the patient” when he or she left the hospital. This impedes, however, early identification of patients at risk of readmission and delays the implementation of means to reduce this risk. Patient computer files should provide a risk prediction score for readmission that evolves during the stay. Certain variables might remain stable (for instance the number of different medications prescribed), while others could only worsen (length of stay). We might also observe an improvement in other variables (e.g., blood sodium levels and Charlson score). Our model could thus be used as a dynamic measure, during the stay, of the risk of PARA. This may render it possible to plan preventive steps, which often take time to initiate. Nevertheless, the retrospective design of our study limits the prospective use of our model. The inclusion of the Charlson score limits the dynamic aspect of the measure and adds complexity for real-life use as it refers to 18 clinical diagnoses. Automated calculation of the score would require all ICD codes, only available after discharge, and manual calculation of the Charlson score could be judged too complicated. Contrariwise, the HOSPITAL score can be easily calculated before discharge, and the interventions to prevent readmission can be started in the hospital.
Our model performed fairly well in predicting PARAs (C-statistic 0.70), although it still needs to be validated. The definition of PARAs has some limitations: (1) PARAs were identified with the validated algorithm, SQLape® and not with an adjudication made by medical chart review; and (2) the algorithm SQLape® is regularly adapted. Its sensitivity/specificity, as well as the accuracy of the developed model, may change. That said, the limited predictive ability of our model, like other existing models, illustrates the difficulty in developing models that possess high predictive power, thereby restricting their use in clinical practice. It is conceivable that use of clinical data, such as patient functional scores and intensity of nursing care, may fine-tune prediction [28–32]. The development of computerised medical files containing prospectively recorded medical and nursing data should render it possible to improve existing models.
Now that 30-day post-discharge unplanned readmission rates are being used as quality and benchmarking indicators between hospitals, it should be remembered that caution is required when interpreting these rates. For this reason, the absolute value appears of little importance; it is the “expected” versus “observed” ratio that is determinant. Precisely estimating these rates is still so complex that even this ratio proves controversial [28]. A systematic review followed by a meta-analysis by van Walraven et al. [33, 34] underlined the high variability in readmission rates deemed to be avoidable. On average, around a quarter of readmissions were deemed to be avoidable, with rates varying greatly between the different studies (from 9.9% to 59%). These rates differed depending on the number of examiners or type of hospital (teaching hospital versus non-teaching hospital). Studies in which avoidability was based on administrative data recorded mean rates of 59%, as opposed to only 12% in those in which clinical data was used.
Beside the retrospective design leading to possible missing data in the patients’ records, our study displayed several other limitations. First, our model has not been validated in another dataset. Internal validation will be indispensable if we wish to develop a tailored predictive model for our department, as will external validation prior to generalising the model. Secondly, the SQLape® algorithm that we employed for distinguishing PARAs uses strict definitions and may over- or even underestimate some readmissions. For example, the admission of a patient for a femoral neck fracture following hospitalisation for pneumonia was deemed to be unavoidable, even if a soporific had been initiated during the index hospitalisation. It must, however, be stressed that SQLape® has several advantages: it detects PARAs with high specificity and sensitivity. It is an algorithm that has been validated with use of Swiss data. Lastly, since it is a computerised tool, it has the advantage of avoiding individual sorting, which is subjective and tedious. Thirdly, we have no data on patients readmitted to other hospitals than the CHUV. The consequence of this may be an underestimation of the readmission rate. Nevertheless, readmissions to other hospitals are rare in our region since the CHUV is the only public acute care hospital for Lausanne and its region. Furthermore, the readmission rate given by the Swiss Association for Quality in Hospitals and Clinics for the CHUV internal medicine department is one of the highest in Switzerland. Fourthly, deaths that occurred outside the CHUV are not known. Several deaths are thus “hidden” within the category of hospital stays of non-readmitted patients, which may overestimate success rates in terms of non-readmission.
As the PARA rate represents an improvement margin for which implementation of specific interventions may be effective, risk prediction scores for readmission are only a part of the process. Therefore continued efforts are needed to identify the patients most at risk of PARA. There are factors that cannot be influenced, whereas others can be improved, for example through medication reconciliation, the creation of a personalised discharge plan, or the participation of a nurse for health coaching and follow-up [35–37]. Other improvement avenues may also involve better communication with the doctors and caregivers taking over outside the hospital.
Our model identifies patients at high risk of 30-day potentially avoidable readmission with a fairly good performance. It could be used to target transition of care interventions. Nevertheless, this model should be validated on more data and could be improved with additional parameters. Even though our study confirms some recurrent risk factors of readmission found in other studies (previous admission, longer length of stay, presence of cancer, anaemia and hyponatraemia) other variables, more “locally tailored”, are probably necessary to improve accuracy of future models. A higher number of medications prescribed during the stay is an original parameter we found in our model, to point out complexity of the case, associated with an increased risk of preventable readmission.
The authors are greatly thankful to the following contributors: Prof Gérard Waeber, Prof Bernard Burnand, Dr Jacques Donzé, Mrs Srives Philipona Nadsutta, Mr Zandi Rad Behrouz, and Mr Renaud Kern.
This contents of this article are approved by all authors. There is no potential conflict of interest.
1 Halfon P , Eggli Y , van Melle G , Chevalier J , Wasserfallen JB , Burnand B . Measuring potentially avoidable hospital readmissions. J Clin Epidemiol. 2002;55(6):573–87. doi:.https://doi.org/10.1016/S0895-4356(01)00521-2
2 Halfon P , Eggli Y , Prêtre-Rohrbach I , Meylan D , Marazzi A , Burnand B . Validation of the potentially avoidable hospital readmission rate as a routine indicator of the quality of hospital care. Med Care. 2006;44(11):972–81. doi:.https://doi.org/10.1097/01.mlr.0000228002.43688.c2
3 van Walraven C , Dhalla IA , Bell C , Etchells E , Stiell IG , Zarnke K , et al. Derivation and validation of an index to predict early death or unplanned readmission after discharge from hospital to the community. CMAJ. 2010;182(6):551–7. doi:.https://doi.org/10.1503/cmaj.091117
4 Gruneir A , Dhalla IA , van Walraven C , Fischer HD , Camacho X , Rochon PA , et al. Unplanned readmissions after hospital discharge among patients identified as being at high risk for readmission using a validated predictive algorithm. Open Med. 2011;5(2):e104–11.
5 Hasan O , Meltzer DO , Shaykevich SA , Bell CM , Kaboli PJ , Auerbach AD , et al. Hospital readmission in general medicine patients: a prediction model. J Gen Intern Med. 2010;25(3):211–9. doi:.https://doi.org/10.1007/s11606-009-1196-1
6 Billings J , Dixon J , Mijanovich T , Wennberg D . Case finding for patients at risk of readmission to hospital: development of algorithm to identify high risk patients. BMJ. 2006;333(7563):327. doi:.https://doi.org/10.1136/bmj.38870.657917.AE
7 Donzé J , Aujesky D , Williams D , Schnipper JL . Potentially avoidable 30-day hospital readmissions in medical patients: derivation and validation of a prediction model. JAMA Intern Med. 2013;173(8):632–8. doi:.https://doi.org/10.1001/jamainternmed.2013.3023
8 Kansagara D , Englander H , Salanitro A , Kagen D , Theobald C , Freeman M , et al. Risk prediction models for hospital readmission: a systematic review. JAMA. 2011;306(15):1688–98. doi:.https://doi.org/10.1001/jama.2011.1515
9 Allaudeen N , Schnipper JL , Orav EJ , Wachter RM , Vidyarthi AR . Inability of providers to predict unplanned readmissions. J Gen Intern Med. 2011;26(7):771–6. doi:.https://doi.org/10.1007/s11606-011-1663-3
10 Cotter PE , Bhalla VK , Wallis SJ , Biram RW . Predicting readmissions: poor performance of the LACE index in an older UK population. Age Ageing. 2012;41(6):784–9. doi:.https://doi.org/10.1093/ageing/afs073
11 Cooksley T , Nanayakkara PW , Nickel CH , Subbe CP , Kellett J , Kidney R , et al.; safer@home consortium. Readmissions of medical patients: an external validation of two existing prediction scores. QJM. 2016;109(4):245–8. doi:.https://doi.org/10.1093/qjmed/hcv130
12 Donzé JD , Williams MV , Robinson EJ , Zimlichman E , Aujesky D , Vasilevskis EE , et al. International Validity of the HOSPITAL Score to Predict 30-Day Potentially Avoidable Hospital Readmissions. JAMA Intern Med. 2016;176(4):496–502. doi:.https://doi.org/10.1001/jamainternmed.2015.8462
13 Aubert CE , Folly A , Mancinetti M , Hayoz D , Donzé J . Prospective validation and adaptation of the HOSPITAL score to predict high risk of unplanned readmission of medical patients. Swiss Med Wkly. 2016;146:w14335.
14 Charlson ME , Pompei P , Ales KL , MacKenzie CR . A new method of classifying prognostic comorbidity in longitudinal studies: development and validation. J Chronic Dis. 1987;40(5):373–83. doi:.https://doi.org/10.1016/0021-9681(87)90171-8
15 Zilberberg MD , Exuzides A , Spalding J , Foreman A , Jones AG , Colby C , et al. Hyponatremia and hospital outcomes among patients with pneumonia: a retrospective cohort study. BMC Pulm Med. 2008;8(1):16. doi:.https://doi.org/10.1186/1471-2466-8-16
16 McDonnell PJ , Jacobs MR . Hospital admissions resulting from preventable adverse drug reactions. Ann Pharmacother. 2002;36(9):1331–6. doi:.https://doi.org/10.1345/aph.1A333
17 Budnitz DS , Lovegrove MC , Shehab N , Richards CL . Emergency hospitalizations for adverse drug events in older Americans. N Engl J Med. 2011;365(21):2002–12. doi:.https://doi.org/10.1056/NEJMsa1103053
18 Fick DM , Cooper JW , Wade WE , Waller JL , Maclean JR , Beers MH . Updating the Beers criteria for potentially inappropriate medication use in older adults: results of a US consensus panel of experts. Arch Intern Med. 2003;163(22):2716–24. doi:.https://doi.org/10.1001/archinte.163.22.2716
19National Committee on Quality Insurance. Final NDC lists: use of high-risk medications in the elderly (DAE). Washington, DC: National Committee on Quality Assurance; 2011.
20 Balla U , Malnick S , Schattner A . Early readmissions to the department of medicine as a screening tool for monitoring quality of care problems. Medicine (Baltimore). 2008;87(5):294–300. doi:.https://doi.org/10.1097/MD.0b013e3181886f93
21 Witherington EM , Pirzada OM , Avery AJ . Communication gaps and readmissions to hospital for patients aged 75 years and older: observational study. Qual Saf Health Care. 2008;17(1):71–5. doi:.https://doi.org/10.1136/qshc.2006.020842
22 Campbell SE , Seymour DG , Primrose WR ; ACMEPLUS Project. A systematic literature review of factors affecting outcome in older medical patients admitted to hospital. Age Ageing. 2004;33(2):110–5. doi:.https://doi.org/10.1093/ageing/afh036
23 Harris CMSA , Sridharan A , Landis R , Howell E , Wright S . What happens to the medication regimens of older adults during and after an acute hospitalization? J Patient Saf. 2013;9(3):150–3. doi:.https://doi.org/10.1097/PTS.0b013e318286f87d
24 Davies EC , Green CF , Mottram DR , Rowe PH , Pirmohamed M . Emergency re-admissions to hospital due to adverse drug reactions within 1 year of the index admission. Br J Clin Pharmacol. 2010;70(5):749–55. doi:.https://doi.org/10.1111/j.1365-2125.2010.03751.x
25 Forster AJ , Clark HD , Menard A , Dupuis N , Chernish R , Chandok N , et al. Adverse events among medical patients after discharge from hospital. CMAJ. 2004;170(3):345–9.
26 Alassaad A , Melhus H , Hammarlund-Udenaes M , Bertilsson M , Gillespie U , Sundström J . A tool for prediction of risk of rehospitalisation and mortality in the hospitalised elderly: secondary analysis of clinical trial data. BMJ Open. 2015;5(2):e007259. doi:.https://doi.org/10.1136/bmjopen-2014-007259
27 Goldfield NI , McCullough EC , Hughes JS , Tang AM , Eastman B , Rawlins LK , et al. Identifying potentially preventable readmissions. Health Care Financ Rev. 2008;30(1):75–91.
28 Joynt KE , Jha AK . Thirty-day readmissions--truth and consequences. N Engl J Med. 2012;366(15):1366–9. doi:.https://doi.org/10.1056/NEJMp1201598
29 Mabire CEY , Junger A . Analyse des séjours hospitaliers: apport des données infirmières. Swiss Medical Informatics. 2009;66:6–14.
30 Tinetti ME . Clinical practice. Preventing falls in elderly persons. N Engl J Med. 2003;348(1):42–9. doi:.https://doi.org/10.1056/NEJMcp020719
31 Tinetti ME , Ginter SF . Identifying mobility dysfunctions in elderly patients. Standard neuromuscular examination or direct assessment? JAMA. 1988;259(8):1190–3. doi:.https://doi.org/10.1001/jama.1988.03720080024022
32 Gandek B , Ware JE , Aaronson NK , Apolone G , Bjorner JB , Brazier JE , et al. Cross-validation of item selection and scoring for the SF-12 Health Survey in nine countries: results from the IQOLA Project. International Quality of Life Assessment. J Clin Epidemiol. 1998;51(11):1171–8. doi:.https://doi.org/10.1016/S0895-4356(98)00109-7
33 van Walraven C , Bennett C , Jennings A , Austin PC , Forster AJ . Proportion of hospital readmissions deemed avoidable: a systematic review. CMAJ. 2011;183(7):E391–402. doi:.https://doi.org/10.1503/cmaj.101860
34 van Walraven C , Jennings A , Forster AJ . A meta-analysis of hospital 30-day avoidable readmission rates. J Eval Clin Pract. 2012;18(6):1211–8. doi:.https://doi.org/10.1111/j.1365-2753.2011.01773.x
35 Kilcup M , Schultz D , Carlson J , Wilson B . Postdischarge pharmacist medication reconciliation: impact on readmission rates and financial savings. J Am Pharm Assoc (2003). 2013;53(1):78–84. doi:.https://doi.org/10.1331/JAPhA.2013.11250
36 Initiative leads to 11% drop in HF readmissions. Hosp Case Manag. 2013;21(4):48–9.
37 Garnier A , Uhlmann M , Griesser AC , Lamy O . [Discharge from hospital: how to improve continuity of medical care?]. Rev Med Suisse. 2015;11(493):2064 , 2066–9. [Article in French]
This contents of this article are approved by all authors. There is no potential conflict of interest.