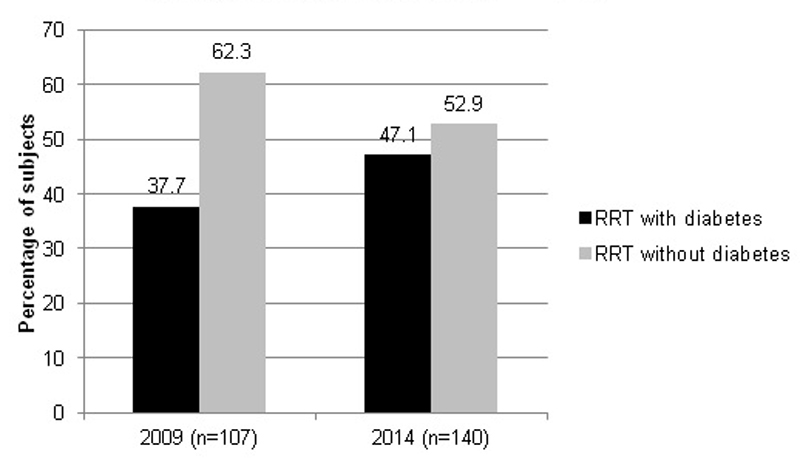
Figure 1 Percentage of subjects on renal replacement therapy (RRT) in the Canton of Vaud with and without diabetes on day of listing.
DOI: https://doi.org/10.4414/smw.2017.14458
Diabetes, one of the major noncommunicable diseases in global health, has become the most common cause of end-stage renal disease (ESRD) in most countries. The total cost of renal replacement therapy (RRT) to the global health insurance system has increased owing to the aging population and high prevalence of type 2 diabetes. The number of patients with ESRD receiving RRT is projected to reach 2.2 million by the year 2030 [1–3].
Overall incidence rates of ESRD, which rose for decades, began to stabilise or even fall after 2006 in several European countries (Austria, Spain, Denmark, Sweden, Norway, Finland) [4], although they continued to increase in the USA [5], the UK [6], Taiwan [7] and Japan [8]. Trends in ESRD with diabetes (ESRD-DM) incidence also differed according to geography [9]. The incidence of ESRD-DM has increased in the UK over the past 10 years [6], as well as in France [10], while it stabilised at the end of the 2000s in the USA and has decreased since 2006 in the USA, Denmark [11], Australia and New Zealand [12].
An understanding of these basic differences in the epidemiology of diabetic nephropathy is of great importance to the development and implementation of prevention and management strategies. Several prospective and observational studies, including those from the Dialysis Outcomes and Practice Patterns Study (DOPPS), the United States Renal Data System (USRDS) and the European Renal Association – European Dialysis and Transplantation Association (ERA-EDTA) Registry have offered insights into the characteristics and prognosis of patients with ESRD, including ESRD-DM patients. Since Switzerland is not represented in these databases, local epidemiological data are largely lacking.
In order to evaluate the prevalence of ESRD-DM and its possible progression over time, we carried out a multicentre study in the Canton of Vaud of Switzerland with a referral population of around 750 000 inhabitants. The primary goal of this study was to assess the prevalence and compare the characteristics of diabetic subjects on renal replacement therapy (RRT) on 31 December 2009 with those on RRT on 31 December 2014. The secondary goals were to examine the 5-year mortality rate of diabetic subjects on RRT on 31 December 2009 and to examine the total number of new cases of diabetic patients on RRT during the 5-year period.
In collaboration with the dialysis facilities of the Canton of Vaud, all files of patients with the diagnosis of diabetes and on RRT for more than 3 months on 31 December 2009 and on 31 December 2014 were carefully examined onsite. We collected the sociodemographic, clinical, laboratory and healthcare characteristics of patients actively on RRT on 31 December 2009 and 2014 and their 5-y survival rate. The body mass index (BMI) calculation was based on the dry weights listed at the end of 2009 and 2014. Laboratory values were considered valid for listing if obtained within 3 months prior to data collection. Systolic and diastolic blood pressure values before dialysis were averaged from three listed blood pressure measurements from the three last consecutive dialysis sessions of the year. The same was done for systolic and diastolic blood pressure values measured at the end of dialysis. The diagnostic criteria for diabetes were consistent with the American Diabetes Association (ADA) 2008 clinical practice guideline [13]. The diagnosis of macrovascular complications, coronary artery disease, peripheral artery disease, stroke and other complications were based on the listing of diagnoses in the patient file. The analysis of medications was based on prescriptions in patient files for the two time-points: the end of 2009 and end of 2014. The frequency of therapies in the intervening period was not evaluated.
The following seven dialysis centres participated to this study: the Service of Nephrology, University Hospital of Lausanne (CHUV); Cecil Clinic, Lausanne; Northern Vaud Hospital, Yverdon; Broye Intercantonal Hospital, Payerne; Nyon Hospital; EHC Hospital, Morges, the Hem Unit; Riviera Providence Hospital, Vevey. All study participants provided written informed consent. This study was approved by the Human Research Ethics Committee, Lausanne University Hospital and University of Lausanne.
Patients with diabetes who started dialysis after 31 December 2009 and continued it for more than 3 months, but were not listed on 31 December 2014 were identified retrospectively in 2015 and included in the assessment of the total number of diabetic subjects on RRT during the 5-year period.
All statistical analyses were conducted with Stata 14.1 (Stata College Station, TX). The first analysis compared characteristics of patients listed in 2009 and 2014. Differences in baseline characteristics were tested with Fisher’s exact test for categorical variables and Student’s test for normally distributed continuous variables; otherwise the Wilcoxon rank-sum test was used. The normality assumption was checked graphically using the quantile-quantile plots and tested with the Shapiro-Francia tests. The second analysis concerned only the cohort of 2009, the purpose being to identify factors associated with the survival 5 years after. Complete data sets were available for 101 of 107 patients in 2009, among whom 3 were lost to follow-up by 2014. The clinical characteristics and survival curve were thus analysed for the 98 remaining. Overall cumulative survival by time since 2009 was calculated by the Kaplan-Meier estimator. A univariate Cox regression model was used to assess differences in clinical characteristics of survivors and nonsurvivors. The strength of the association was measured using the calculated HR (hazard ratio) and associated p-value. A level of p <0.05 was considered statistically significant. We did not adjust a multivariable model because of the insufficient size of the sample.
On 31 December 2009 and on 31 December 2014, the number of patients with ESRD-DM and the number of those on RRT in the Canton of Vaud were 107 and 140, respectively, corresponding to an increase in prevalence of diabetes in the dialysis centres of the Canton de Vaud from 38% in 2009 to 47% in 2014 (fig. 1).
Figure 1 Percentage of subjects on renal replacement therapy (RRT) in the Canton of Vaud with and without diabetes on day of listing.
When those who underwent RRT for more than 3 months during the 5-year period, but were not listed at the dates mentioned above were included, an additional 167 new patients with ESRD-DM required dialysis in the Canton of Vaud. This corresponds to a total number of 274 patients with ESRD-DM during the 5-year interval and a 31% increase in the number of ESRD-DM patients on RRT in 2014 compared with 2009. There was no clear trend in the annual incidence during the 5-year period (incidental cases: 2010, 37; 2011, 24; 2012, 46; 2013, 25; 2014, 35). The estimated number of adult diabetics in the Canton de Vaud provided by the Programme Cantonal Diabète (pcd.diabete-vaud.ch) was 40 000. The average annual incidence rate was therefore calculated as: (167/(40 000*5))*1000 = 0.835.
The clinical characteristics of ESRD-DM patients on 31 December 2009 and on 31 December 2014 are shown in tables 1 and 2 . Complete data sets were available for 101 of 107 patients in 2009 and 132 of 140 patients in 2014; thus the detailed characteristics of these patients are presented. Mean age of patients was 69.5±10.5 years in 2009 and 68.9±11.7 years in 2014; over 85% had type 2 diabetes. There was no difference in age, sex, BMI, type of diabetes, duration of diabetes, cause of ESRD, dialysis duration or type of vascular access between the groups. Duration of diabetes was available for 47 patients in 2009 and 51 patients in 2014 and did not differ between groups. Some of the patients developed diabetes after dialysis (8.5% in 2009; 5.9% in 2014). Only 27.3% of patients had a kidney biopsy, and thus the cause of ESRD was most often clinically based. Diabetes alone as a primary and unique cause of ESRD was reported in 15.2% of ESRD-DM patients in 2009 and in 8.5% of patients in 2014. On the other hand, 66.7% ESRD patients had begun dialysis with diabetes and other kidney diseases in 2009 and 75.2% in 2014. The mean dialysis duration was 3.3 years and was not significantly different between the two groups. In 2009, no dialysed patients with diabetes were on peritoneal dialysis. In contrast, five patients were on peritoneal dialysis in 2014.
Table 1 Basic characteristics of end-stage renal disease patients with diabetes in 2009 and 2014.
| 2009 (n = 101) | 2014 (n = 132) | ||||||
|---|---|---|---|---|---|---|---|
| Mean | SD | n (%) | Mean | SD | n (%) | p-value | |
| Age (y) | 69.5 | 10.5 | 68.9 | 11.7 | 0.8 | ||
| Sex | 0.9 | ||||||
| Male | 69 (68.3%) | 91 (68.9%) | |||||
| Female | 32 (31.7%) | 41 (31.1%) | |||||
| BMI (kg/m2) | 27.0 | 4.4 | 27.9 | 5.2 | 0.3 | ||
| Diabetes type | 0.8 | ||||||
| 1 | 10 (10.3%) | 11 (8.4%) | |||||
| 2 | 86 (88.7%) | 118 (90.1%) | |||||
| MODY | 1 (1.0%) | 1 (0.8%) | |||||
| LADA | 0 | 1 (0.8%) | |||||
| NODAT | 0 | 1 (0.8%) | |||||
| Diabetes duration (y) (range) | 19.4 (3–42) | 9.7 | 18.5 (0–47) | 11.3 | 0.5 | ||
| % diabetes diagnosed after start of RRT | 8.5% | 5.9% | |||||
| Cause of ESRD | 0.2 | ||||||
| Diabetes as a unique cause | 15 (15.2%) | 11 (8.5%) | |||||
| Diabetes and other causes | 66 (66.7%) | 97 (75.2%) | |||||
| Not diabetic | 18 (18.2%) | 21 (16.3%) | |||||
| Missing | 4 | 5 | |||||
| Dialysis duration (y) | 3.3 | 3.6 | 2.7 | 3.1 | 0.2 | ||
| <1 y | 18 (18.6%) | 31 (23.7%) | |||||
| 1–2 y | 20 (20.6%) | 19 (14.5%) | |||||
| 2–3 y | 11 (11.3%) | 33 (25.2%) | |||||
| 3–4 y | 16 (16.5%) | 12 (9.2%) | |||||
| 4–5 y | 7 (7.2%) | 14 (10.7%) | |||||
| >5 y | 25 (25.9%) | 22 (16.9%) | |||||
| Mode of renal replacement therapy | 0.05 | ||||||
| HD | 101 (100%) | 127 (96.2%) | |||||
| PD | 0 | 5 (3.8%) | |||||
| Number of dialysis sessions of HD | 0.1 | ||||||
| 3/w | 97 (97%) | 123 (93.2%) | |||||
| 2/w | 2 (2%) | 1 (0.8%) | |||||
| Other | 1 (1%) | 8 (6.1%) | |||||
| Type of access | 0.2 | ||||||
| Native AV fistula | 57 (56.4%) | 66 (50.8%) | |||||
| Tunnalised catheter | 19 (18.8%) | 26 (20%) | |||||
| Prosthetic AV graft | 25 (24.8%) | 33 (25.4%) | |||||
| PD catheter | 0 | 5 (3.9%) | |||||
AV = arteriovenous; BMI = body mass index; ESRD = end-stage renal diseaseHD = haemodialysis; LADA = latent autoimmune diabetes of the adult; MODY = maturity onset diabetes of the young; NODAT = new onset diabetes after transplantation; PD = peritoneal dialysis; SD = standard deviation
Table 2 Clinical characteristics of end-stage renal disease patients with diabetes in 2009 and 2014.
| 2009 (n = 101) | 2014 (n = 132) | ||||||
|---|---|---|---|---|---|---|---|
| Mean | SD | n (%) | Mean | SD | n (%) | p-value | |
| SBP (mm Hg) | |||||||
| Before dialysis | 145.9 | 19.6 | 145.1 | 20.4 | 0.8 | ||
| After dialysis | 136.5 | 19.8 | 139.1 | 20.9 | 0.3 | ||
| Difference | 9.4 (˗33–63) | 17.6 | 5.6 (˗50–48) | 17.7 | 0.1 | ||
| DBP (mm Hg) | |||||||
| Before dialysis | 69.8 | 12.9 | 66.4 | 12.8 | 0.08 | ||
| After dialysis | 68.1 | 12.8 | 64.9 | 12.4 | 0.08 | ||
| Difference | 1.7 (˗29–33) | 10.8 | 1.3 (˗40–37) | 9.5 | 0.7 | ||
| HR (bpm) | |||||||
| Before dialysis | 75.5 | 11 | 76.1 | 13.9 | 0.7 | ||
| After dialysis | 76.3 | 12.7 | 75.1 | 11.9 | 0.5 | ||
| Difference | ˗0.8 (˗30–18) | 8.1 | 0.7 (˗31–26) | 9.1 | 0.2 | ||
| Reported comorbidities | |||||||
| Macrovascular | 57 (56.4%) | 109 (82.6%) | <0.001 | ||||
| CAD alone | 13 (12.9%) | 23 (17.4%) | |||||
| Stroke alone | 4 (4.0%) | 2 (1.5.%) | |||||
| PAD alone | 15 (14.9%) | 29 (21.8%) | |||||
| CAD and stroke | 3 (3.0%) | 7 (5.3%) | |||||
| CAD and PAD | 17 (16.8%) | 38 (28.8%) | |||||
| Stroke and PAD | 2 (2.0%) | 2 (1.5%) | |||||
| CAD, stroke and PAD | 3 (3.0%) | 11 (8.3%) | |||||
| Amputation | 21 (20.8%) | 20 (15.2%) | 0.2 | ||||
| Diabetic foot ulcer | 22 (21.8%) | 37 (28%) | 0.4 | ||||
| Biochemistry | |||||||
| HbA1c (%) | 6.9 | 1.8 | 6.9 | 1.1 | 0.7 | ||
| Haemoglobin (g/l) | 117.9 | 10.9 | 112.3 | 11.6 | p<0.001 | ||
CAD = coronary artery disease; DBP = diastolic blood pressure; HbA1c = glycated haemoglobin; HR = heart rate; PAD = peripheral artery disease; SBP = systolic blood pressure
Patients with diabetes on dialysis in 2014 had significantly more reported macrovascular complications than those in 2009 (82.6% vs 56.4%, p <0.001), with a predominance of coronary artery disease and peripheral artery disease. There was no difference in amputation or diabetic foot ulcer rates between the two groups. Ophthalmology reports were most often lacking; it was thus not possible to evaluate accurately the prevalence of diabetic retinopathy.
There was no difference in glycated haemoglobin (HbA1c) level (table 2) and insulin treatment between the two groups (table 3). Haemoglobin level decreased significantly from 117. ±10.9 g/l in 2009 to 112.3±11.6 g/l in 2014 (p <0.001).
Table 3 Medications used by end-stage renal disease patients with diabetes in 2009 and 2014.
| 2009 (n = 101) | 2014 (n = 132) | p-value | |
|---|---|---|---|
| n (%) | n (%) | ||
| Insulin | 68 (71.6%) | 95 (72%) | 0.8 |
| Antihypertensive drugs | 90 (89%) | 112 (84.8%) | 0.4 |
| ACEI | 19 (18.8%) | 10 (7.6%) | 0.017 |
| ARB | 37 (36.6%) | 44 (33.3%) | 0.6 |
| CCB | 45 (44.6%) | 44 (33.3%) | 0.2 |
| BB | 48 (47.5%) | 60 (45.5%) | 0.7 |
| Diuretics | 52 (52.5%) | 75 (56.8%) | 0.6 |
| Spironolactone | 2 (2%) | 3 (2.3%) | 0.9 |
| Minoxidil | 2 (2%) | 1 (1%) | 0.4 |
| Clonidine | 3 (3%) | 0 (0%) | 0.05 |
| Moxonidine | 4 (4%) | 11 (8.3%) | 0.2 |
| Phosphate binders | 83 (82.2%) | 67 (50.8%) | <0.001 |
| Calcium-containing | 79 (78.2%) | 61 (46.2%) | <0.001 |
| Aluminium-containing | 5 (4.9%) | 4 (3,0%) | 0.5 |
| Sevelamer | 17 (16.8%) | 11 (8.3%) | 0.05 |
| 25-hydroxy-vitamin D | 30 (29.7%) | 35 (26.5%) | 0.2 |
| 1,25-hydroxy-vitamin D | 39 (38.6%) | 42 (32.1%) | 0.3 |
| Cinacalcet | 10 (9.9%) | 18 (13.6%) | 0.4 |
| Statins | 58 (57.4%) | 81 (61.4%) | 0.9 |
| Iron | 66 (65.35%) | 104 (78.8%) | 0.017 |
| ESA | 85 (84.2%) | 104 (78.8%) | 0.2 |
| Darbepoetin | 46 (45.5%) | 79 (59.9%) | 0.03 |
| Epoetin alpha | 0 (0%) | 0 (0%) | |
| Epoetin beta | 15 (14.9%) | 1 (0.8%) | <0.001 |
| Methoxypolyethylene glycol-epoetin beta | 25 (24.8%) | 25 (19.7%) | 0.3 |
ACEI = angiotensin-converting enzyme inhibitors; ARB = angiotensin II receptor blockers; BB = beta blockers; CCB = calcium channel blockers; ESA = erythropoiesis stimulating agents
There was no difference in erythropoietin therapy between the two groups, but the use of intravenous iron therapy increased significantly during the study period (65.4% vs 78.8%, p = 0.02). Use of angiotensin-converting enzyme inhibitors (ACEIs) decreased significantly (18.8% vs 7.6%, p = 0.04). On the other hand, there was no difference in use of other antihypertensive drugs between two groups. Use of calcium-containing phosphate binders also decreased (78.2% vs 46.2%, p <0.001), but there was no increase in use of other phosphate binders. There was no difference in vitamin D, calcimimetics and statin therapies between two groups.
The estimated 5-year mortality rate was 61.7%, based on the outcomes of 98 diabetic patients listed by the end of 2009 and followed up for 5 years (fig. 2). Factors significantly associated with mortality rate were age, BMI and dialysis duration (table 4 ). The total number of patients receiving a kidney transplant during the 5-year period was 23 out of a total of 274 on RRT during the 5-year period.

Figure 2 Kaplan Meier 5-year survival curve for patients listed in 2009.
Table 4 Clinical characteristics of 5-year survivors vs nonsurvivors (total n = 98) and comparison by univariate Cox regression analysis.
|
Nonsurvivors*
(n = 60) |
Survivors*
(n = 38) |
Cox univariate analysis | ||
|---|---|---|---|---|
| HR (95% CI) | p-value | |||
| Age (y) | 72.1±10.1 | 64.9± 0.1 | 1.04 (1.01–1.07) | 0.002 |
| Sex (M/F) | 68/32% | 69/31% | 1.10 (0.6–1.9) | 0.7 |
| Diabetes type (1/2/other) | 3.5/95/1.5% | 21.6/78.4/0% | 2.02 (0.7–5.5) | 0.13 |
| Duration of dialysis (y) | 3.3±3.9 | 3.0±3.0 | 0.86 (0.76–0.96) | 0.003 |
| Duration of diabetes (y) | 18±8.7 | 21±2.3 | 1.0 (0.94–1.02) | 0.3 |
| BMI (kg/m2) | 26.1±4.1 | 28.3±0.7 | 0.93 (0.87–0.99) | 0.02 |
| SBP (mm Hg) | 144.6±2.5 | 146.6±3.0 | 1.00 (0.98–1.02) | 0.9 |
| DBP (mm Hg) | 68.5±13 | 70.8±11.9 | 1.00 (0.98–1.02) | 1.0 |
| ΔSBP (before and after dialysis) | 8.7±15 | 9.0±20.4 | 1.00 (0.99–1.02) | 0.8 |
| ΔDBP (before and after dialysis) | 2.2±9.3 | 0.05±12 | 1.01 (0.99–1.04) | 0.4 |
| Pulse (bpm) | 75.8±11.6 | 74.5±10.2 | 1.00 (0.98–1.03) | 0.8 |
| Δ pulse | ˗0.45±8.8 | ˗1.32±7.3 | 1.00 (0.97–1.04) | 0.8 |
| HbA1c | 6.8±1.9 | 7.0±1.7 | 0.94 (0.78–1.13) | 0.5 |
| Haemoglobin (g/l) | 116.2±10.6 | 120.3±11.1 | 0.98 (0.95–1.0) | 0.08 |
| Drug therapy | ||||
| Statins | 69% | 56% | 0.76 (0.46–1.29) | 0.3 |
| Calcium-containing phosphate binders | 77% | 79% | 1.10 (0.56–2.18) | 0.8 |
| EPO | 79% | 87% | 1.37 (0.65–2.89) | 0.4 |
BMI = body mass index; DBP = diastolic blood pressure; EPO = erythropoietin; HbA1c = glycated haemoglobin; SBP = systolic blood pressure * Mean ± standard deviation or frequency (%)
According to data from the International Diabetes Federation [14], the prevalence of diabetes in adults aged between 20 and 79 years was 7.7% in 2015, with a total estimated number of 480 700 adults with diabetes in Switzerland. Diabetes has already become the most prevalent noncommunicable disease in developed countries, and its epidemic increase has also reached developing countries. Data from USRDS has demonstrated that the number of incident ESRD cases with diabetes as the primary cause has been rising rapidly since 1980 [4]. Data from Switzerland are lacking. The Swiss Society of Nephrology has only recently (in 2013) created the Swiss Renal Registry and Quality Assessment Program (SRRQAP) in order to collect information in the dialysis population. Other epidemiological RRT studies in Switzerland have demonstrated that quality of care influences survival [15], that survival rates compared favourably with those in other countries and did not differ in diabetic patients [16], and finally that there was an overall increase in the elderly dialysis population with time [17]. In a prior study reported by Golshayan et al. [18], the prevalence of diabetes among ESRD patients was 23% in 1999 in Canton Vaud, with a total of 43 diabetic patients on RRT. Our study is the first to focus specifically on the clinical characteristics of patients with diabetes on RRT and to describe the epidemiological changes over 5 years of ESRD-DM patients in Canton Vaud, Switzerland.
In our study, the prevalence of ESRD-DM was 38% in 2009, and increased to 47% in 2014. The increase between 1999 (23%) and 2009 (38%) could be due to aging of the population (62.1±11.2 years in 1999 vs 69.5±10.5 years in 2009). However, the mean age did not differ between 2009 and 2014, suggesting that other contributors are involved, such as the increasing prevalence of type 2 diabetes and a growing population (1.6% annual increase). Of interest, at the end of 2015, the SRRQAP register included 4215 dialysed patients. The median age of the dialysis population was 70.2 years and 33.7% had diabetes as a comorbidity, among whom 19.7% had diabetes as the primary cause of ESRD. We could not find an explanation for the difference in prevalence of diabetes in ESRD patients according to the SRRQAP registry and in our study. On the other hand, the increased prevalence of ESRD-DM and the characteristics of these patients in our study were consistent with other studies in Europe [6, 10]. From these results, we extrapolate around 400 incidental cases of ESRD-DM patients per year starting RRT in Switzerland, corresponding to 49.4 per million population which is slightly higher than the average of 32 p.m.p in most European countries [19].
Several important points were observed in our study.
Firstly, there was no use of peritoneal dialysis in the treatment of ESRD-DM in 2009. The choice of dialysis modality is based on financial, cultural and socioeconomic factors, as well as experience with peritoneal dialysis and availability of haemodialysis [20]. However, after a recent Swiss national effort to promote home dialysis and to reduce the costs of RRT, more diabetic patients used peritoneal dialysis, as observed in our study, in 2014.
Secondly, patients with diabetes in 2014 had more macrovascular complications than those dialysed in 2009, a difference that was mainly dictated by the increase in peripheral arterial disease. As the amputation rate had not increased, we believe that this observation was due to the increased awareness and care of the diabetic foot implemented in the Canton de Vaud in recent years, with a programme supported by the cantonal authority (Programme Cantonal Diabète). In addition, there may be a reporting bias resulting from an increase in disease listing by hospitalists under economic pressure after diagnosis-related groups (DRGs) were introduced into the payment system for inpatient care in 2012, with the intention to improve cost efficiency [21].
Thirdly, haemoglobin level decreased significantly during the study period from 117.9 g/l to 112.3 g/l, although it remained at the target level recommended by the guidelines [15]. Collectively, TREAT [22], CREATE [23], CHOIR [24] studies have shown that higher haemoglobin targets are associated with an increased risk of stroke and thromboembolic events in patients with chronic renal disease. Another meta-analysis has demonstrated increased mortality associated with higher haemoglobin targets [25]. Therefore, international guidelines recommend haemoglobin levels of between 100 and 110 g/l [26], which probably explains the decrease in haemoglobin levels observed in this study.
Fourthly, there was a decreased use of calcium-containing phosphate binders. Of note, calcium administration significantly increases calcium balance [27, 28], which could aggravate vascular calcification and lead to increased cardiovascular mortality.
The 5-year survival rate for patients on RRT in 2009 was around 40%. Similar numbers for diabetic and nondiabetic patients have already been reported by Breidhardt et al. in a Swiss cohort study of haemodialysis patients [16]. Interestingly, in contrast to their cohort, in our study BMI was significantly higher in survivors, which is in accordance with the well-described reverse paradox in dialysis patients [29]. It also suggests that body protein-energy wasting in diabetic patients with RRT may be specifically linked to a worse outcome, as found in patients presenting with “burnt out diabetes” [30]. The finding that survival was associated with dialysis duration is possibly explained by selection bias due to the cross-sectional design of the study: patients were in general included not at the initiation of haemodialysis, but years later. It is well known that mortality rates are high the first year after dialysis initiation; these patients were underrepresented in this study [31].
Of all the 274 ESRD-DM patients treated during the 5 years, only 8.4% received a kidney transplant, which is low and underscores the need for improving access to kidney transplantation in diabetic patients.
The main limitation of the study is the retrospective analysis of patients with diabetes starting RRT but not listed in 2009 and 2014. We believe that some patients may have been missed, although the error is presumably weak. The diagnosis of diabetes may have been missed in patients presenting with burnt out diabetes and no longer on antidiabetic medication. Accurate prevalence of diabetic retinopathy is lacking in our study owing to incomplete reporting of ophthalmological examinations. Reported comorbidities were based only on the listing of diagnosis, which may have been incomplete.
In conclusion, epidemiological changes in diabetes mellitus, especially type 2 diabetes, over the past 20 years have greatly influenced the epidemiology of diabetes-related kidney diseases. The marked increase in the prevalence of ESRD-DM in the Canton of Vaud, may represent a socioeconomic pressure on Swiss public health provisions.
We thank the Programme Cantonal Diabète Vaud for supporting this study.
Programme Cantonal Diabète Vaud.
1 Levey AS , Atkins R , Coresh J , Cohen EP , Collins AJ , Eckardt KU , et al. Chronic kidney disease as a global public health problem: approaches and initiatives - a position statement from Kidney Disease Improving Global Outcomes. Kidney Int. 2007;72(3):247–59. https://doi.org/10.1038/sj.ki.5002343
2 Meguid El Nahas A , Bello AK . Chronic kidney disease: the global challenge. Lancet. 2005;365(9456):331–40. https://doi.org/10.1016/S0140-6736(05)17789-7
3 Snyder JJ , Collins AJ . KDOQI hypertension, dyslipidemia, and diabetes care guidelines and current care patterns in the United States CKD population: National Health and Nutrition Examination Survey 1999-2004. Am J Nephrol. 2009;30(1):44–54. https://doi.org/10.1159/000201014
4United States Renal Data System. 2015 USRDS annual data report: Epidemiology of kidney disease in the United States. National Institutes of Health, National Institute of Diabetes and Digestive and Kidney Diseases, Bethesda, MD. 2015.
5 Foley RN , Collins AJ . End-stage renal disease in the United States: an update from the United States Renal Data System. J Am Soc Nephrol. 2007;18(10):2644–8. https://doi.org/10.1681/ASN.2007020220
6 Hill CJ , Fogarty DG . Changing trends in end-stage renal disease due to diabetes in the United kingdom. J Ren Care. 2012;38(Suppl 1):12–22. https://doi.org/10.1111/j.1755-6686.2012.00273.x
7 Huang YY , Lin KD , Jiang YD , Chang CH , Chung CH , Chuang LM , et al. Diabetes-related kidney, eye, and foot disease in Taiwan: an analysis of the nationwide data for 2000-2009. J Formos Med Assoc. 2012;111(11):637–44. https://doi.org/10.1016/j.jfma.2012.09.006
8 Hanafusa N , Nakai S , Iseki K , Tsubakihara Y . Japanese society for dialysis therapy renal data registry-a window through which we can view the details of Japanese dialysis population. Kidney Int Suppl (2011). 2015;5(1):15–22. https://doi.org/10.1038/kisup.2015.5
9Annual Report of the Dialysis Outcomes and Practice Patterns Study: Hemodialysis Data 1997-2011. Ann Arbor, MI: Arbor Research Collaborative for Health; 2012.
10 Lassalle M , Ayav C , Frimat L , Jacquelinet C , Couchoud C ; Au Nom du Registre REIN. The essential of 2012 results from the French Renal Epidemiology and Information Network (REIN) ESRD registry. Nephrol Ther. 2015;11(2):78–87. https://doi.org/10.1016/j.nephro.2014.08.002
11 Sørensen VR , Hansen PM , Heaf J , Feldt-Rasmussen B . Stabilized incidence of diabetic patients referred for renal replacement therapy in Denmark. Kidney Int. 2006;70(1):187–91. https://doi.org/10.1038/sj.ki.5001516
12 Grace BS , Clayton P , McDonald SP . Increases in renal replacement therapy in Australia and New Zealand: understanding trends in diabetic nephropathy. Nephrology (Carlton). 2012;17(1):76–84. https://doi.org/10.1111/j.1440-1797.2011.01512.x
13 American Diabetes Association. Standards of medical care in diabetes--2008. Diabetes Care. 2008;31(Suppl 1):S12–54. https://doi.org/10.2337/dc08-S012
14International Diabetes Federation. Diabetes in Switzerland - 2015 [Internet]. 2015 Dec [cited 2016 Mar 15] Available from: http://www.idf.org/membership/eur/Switzerland.
15 Saudan P , Kossovsky M , Halabi G , Martin PY , Perneger TV ; Western Switzerland Dialysis Study Group. Quality of care and survival of haemodialysed patients in western Switzerland. Nephrol Dial Transplant. 2008;23(6):1975–81. Published online December 25, 2007. https://doi.org/10.1093/ndt/gfm915
16 Breidthardt T , Moser-Bucher CN , Praehauser C , Garzoni D , Bächler K , Steiger J , et al. Morbidity and mortality on chronic haemodialysis: a 10-year Swiss single centre analysis. Swiss Med Wkly. 2011;141:w13150. Published online February 18, 2011. doi:.https://doi.org/10.4414/smw.2011.13150
17 Lehmann PR , Ambühl M , Corleto D , Klaghofer R , Ambühl PM . Epidemiologic trends in chronic renal replacement therapy over forty years: a Swiss dialysis experience. BMC Nephrol. 2012;13(1):52. Published online July 04, 2012. https://doi.org/10.1186/1471-2369-13-52
18 Golshayan D , Paccaud F , Wauters JP . [Epidemiology of end-stage renal failure: comparison between 2 Swiss cantons]. Nephrologie. 2002;23(4):179–84. Article in French.
19Registry ERA-EDTA. ERA-EDTA Registry Annual Report 2014. Academic Medical Center, Department of Medical Informatics, Amsterdam, the Netherlands, 2016.
20 Wauters JP , Uehlinger D . Non-medical factors influencing peritoneal dialysis utilization: the Swiss experience. Nephrol Dial Transplant. 2004;19(6):1363–7. https://doi.org/10.1093/ndt/gfh090
21 Biller-Andorno N , Zeltner T . Individual Responsibility and Community Solidarity--The Swiss Health Care System. N Engl J Med. 2015;373(23):2193–7. https://doi.org/10.1056/NEJMp1508256
22 Pfeffer MA , Burdmann EA , Chen CY , Cooper ME , de Zeeuw D , Eckardt KU , et al.; TREAT Investigators. A trial of darbepoetin alfa in type 2 diabetes and chronic kidney disease. N Engl J Med. 2009;361(21):2019–32. https://doi.org/10.1056/NEJMoa0907845
23 Drüeke TB , Locatelli F , Clyne N , Eckardt KU , Macdougall IC , Tsakiris D , et al.; CREATE Investigators. Normalization of hemoglobin level in patients with chronic kidney disease and anemia. N Engl J Med. 2006;355(20):2071–84. https://doi.org/10.1056/NEJMoa062276
24 Singh AK , Szczech L , Tang KL , Barnhart H , Sapp S , Wolfson M , et al.; CHOIR Investigators. Correction of anemia with epoetin alfa in chronic kidney disease. N Engl J Med. 2006;355(20):2085–98. https://doi.org/10.1056/NEJMoa065485
25 Palmer SC , Navaneethan SD , Craig JC , Johnson DW , Tonelli M , Garg AX , et al. Meta-analysis: erythropoiesis-stimulating agents in patients with chronic kidney disease. Ann Intern Med. 2010;153(1):23–33. https://doi.org/10.7326/0003-4819-153-1-201007060-00252
26 Kidney Disease: Improving Global Outcomes (KDIGO) Anemia Work Group. KDIGO clinical practice guideline for anemia in chronic kidney disease. Kidney Int. 2012;2 (suppl).
27 Hill KM , Martin BR , Wastney ME , McCabe GP , Moe SM , Weaver CM , et al. Oral calcium carbonate affects calcium but not phosphorus balance in stage 3-4 chronic kidney disease. Kidney Int. 2013;83(5):959–66. https://doi.org/10.1038/ki.2012.403
28 Spiegel DM , Brady K . Calcium balance in normal individuals and in patients with chronic kidney disease on low- and high-calcium diets. Kidney Int. 2012;81(11):1116–22. https://doi.org/10.1038/ki.2011.490
29 Mafra D , Guebre-Egziabher F , Fouque D . Body mass index, muscle and fat in chronic kidney disease: questions about survival. Nephrol Dial Transplant. 2008;23(8):2461–6. Published online April 09, 2008. https://doi.org/10.1093/ndt/gfn053
30 Kovesdy CP , Park JC , Kalantar-Zadeh K . Glycemic control and burnt-out diabetes in ESRD. Semin Dial. 2010;23(2):148–56. Published online April 09, 2010. https://doi.org/10.1111/j.1525-139X.2010.00701.x
31 Eckardt KU , Gillespie IA , Kronenberg F , Richards S , Stenvinkel P , Anker SD , et al.; ARO Steering Committee. High cardiovascular event rates occur within the first weeks of starting hemodialysis. Kidney Int. 2015;88(5):1117–25. https://doi.org/10.1038/ki.2015.117
Programme Cantonal Diabète Vaud.