Predictors of re-exacerbation after an index exacerbation of chronic obstructive pulmonary disease in the REDUCE randomised clinical trial
DOI: https://doi.org/10.4414/smw.2017.14439
Brigitte
Engela, Christian
Schindlerb, Jörg D.
Leuppic, Jonas
Rutishauserd
aDepartment of Medicine, Fricktal Health Centre, Laufenburg,
bSwiss Tropical and Public Health Institute, University of Basel,
cKantonsspital Baselland, Department of Medicine, University Clinic of Medicine, Liestal,
dKantonsspital Baselland, Department of Medicine, University Clinic of Medicine, Bruderholz,
Predictors of re-exacerbation after an index exacerbation of chronic obstructive pulmonary disease in the REDUCE randomised clinical trial
Summary
BACKGROUND
Acute exacerbations of chronic obstructive pulmonary disease (AECOPD) compromise physical activity and quality of life and contribute significantly to health care costs. Systemic glucocorticoids benefit clinical outcome in AECOPD, and the REDUCE trial demonstrated noninferiority of a 5-day treatment course with prednisone compared with 14 days therapy regarding clinical outcome over 6 months of follow-up. Unexpectedly, we found an inverse correlation between circulating cortisol levels and exacerbation risk during a 6-month follow-up period.
OBJECTIVE
To evaluate whether additional predictors of COPD re-exacerbation can be identified after the index exacerbation in the REDUCE cohort.
METHODS
Of 314 patients with AECOPD randomised to 5 or 14 days of prednisone treatment, 311 were included in the analysis. Parameters tested as predictors of re-exacerbation were sex, age, smoking status, forced expiratory volume in one second (FEV1), dyspnoea as assessed with the Medical Research Council (MRC) dyspnoea scale, home oxygen therapy, pretreatment with systemic glucocorticoids, pretreatment with antibiotics, duration of hospitalisation, blood pressure, oxygen saturation, admission to the Intensive Care Unit (ICU) and relevant infections in follow-up. The risks for re-exacerbation were estimated by means of logistic regression and Cox proportional hazard models and expressed as odds ratios and hazard ratios, respectively.
RESULTS
After multivariate adjustment, significant predictors at hospital discharge for COPD re-exacerbation during follow-up were: duration of hospital stay >8 days (hazard ratio [HR] 1.54, 95% confidence interval [CI] 1.03–2.28); FEV1 <30% predicted (HR 1.76, 95% CI 1.06–2.91); hypertension (HR 2.39, 95% CI 1.04–5.48) and MRC dyspnoea scale (HR 1.61, 95% CI 1.30–2.01, per unit increment). Present cigarette smoking (HR 0.60, 95% CI 0.38–0.92) was negatively associated with re-exacerbation.
CONCLUSION
In addition to biochemical suppression of the adrenal glands, other standard clinical parameters predict re-exacerbation in patients admitted to the emergency department with AECOPD. (REDUCE trial registration: ISRCTN29646069)
Introduction
Chronic obstructive pulmonary disease (COPD) is one of the leading causes of death worldwide [1]. Disease exacerbations have major implications for COPD patients. They are usually associated with increased airway inflammation and characterised by a change in the patient’s baseline dyspnoea, cough, and/or sputum purulence and volume [2–4] The main risk factor for the development of COPD is inhaled smoke. Additional risk factors include infections, continued oxidative damage and air pollution [5]. Patients’ age, dyspnoea and airway obstruction are positive predictors for 2-year mortality [6]. Risk factors for exacerbations include older age, higher partial pressure of carbon dioxide (PaCO2) and long-term use of systemic glucocorticoids [7], worse baseline breathlessness as measured with the Medical Research Council (MRC) dyspnoea scale [8–10], or poor nutritional status [11, 12]; in some patients no specific cause for an exacerbation can be found [5]. According to data from a Swiss cohort, approximately 20% of COPD patients experience at least one exacerbation per year [13, 14]. Affected patients require intensive monitoring and treatment, which contributes to high healthcare costs.
Exacerbations expedite the process of gradual decline in forced expiratory volume in 1 second (FEV1) [15–17] and the progression of emphysema assessed with computed tomography (CT) [18]. Patients with frequent COPD exacerbations thus have worse health status, faster disease progression and a higher risk of hospital admission than patients with less frequent exacerbations [19].
Exacerbations become more frequent and severe with increasing COPD grade [4], but frequency of exacerbations varies widely among individuals [20], possibly because of varying susceptibility to viral infections [21]. To reduce exacerbation frequency is a main goal in COPD treatment.
One of the functional consequences of exacerbations is weakening of peripheral muscles, leading to decreased physical activity and quality of life [22]. Patients with an acute exacerbation in the previous year have a lower activity level than others without recent exacerbation [23]. Time spent outdoors declines during exacerbations, which indicates the importance of pulmonary rehabilitation after an exacerbation [24, 25]. Other factors such as depression may contribute to physical inactivity [26].
Baker and colleagues [27] reported that higher blood glucose concentrations in patients with acute exacerbations of COPD are associated with adverse clinical outcomes, including re-exacerbation. This finding may reflect the severity of the illness or the large dose of glucocorticoids used for exacerbation treatment.
The REDUCE randomised clinical trial [28] showed that a 5-day treatment with systemic glucocorticoids is noninferior to a 14-day treatment in patients admitted to the emergency department for acute exacerbations of COPD. In a prespecified prospective analysis of adrenal function, tested with the low-dose (1µg) corticotropin stimulation test, we found that basal and stimulated cortisol levels were inversely associated with the re-exacerbation risk, and a pathological result was associated with higher odds for re-exacerbation [29]. This novel finding was unexpected, indicating that existing knowledge of predictors may be limited. We therefore undertook the present study to identify possible additional predictors of re-exacerbation, using data from the REDUCE trial.
Patients and methods
Study design and patients
We used data from the REDUCE multicentre placebo-controlled trial [28, 30] (ISRCTN29646069) for the current analysis. The original trial was designed to test the hypothesis that in acute exacerbations of COPD, a 5-day treatment with systemic glucocorticoids would not be inferior to therapy for 14 days with regard to clinical outcome. Ethical approval to conduct the trial was obtained from the competent ethics committees (Ethikkommission beider Basel, currently named Ethikkommission Nordwest- und Zentralschweiz) and KEK Bern.
Briefly, patients admitted to the emergency department with exacerbated COPD were randomly assigned to 5 or 14 days of treatment with oral prednisone 40 mg daily. The primary outcome was the time to COPD re-exacerbation during the follow-up period of 6 months. Secondary endpoints included all-cause mortality, change in FEV1, cumulative glucocorticoid dose and clinical performance (assessed with the MRC dyspnoea scale [9], a bronchitis-associated quality-of-life score [31], and patient-reported overall performance quantified on a visual analogue scale).
All data relevant to the primary and secondary endpoints were assessed daily during the hospitalisation period, on day 6, the day of discharge, and on days 15, 30, 90 and 180 of follow-up. Of the 314 randomised patients, 311 were considered in the statistical analyses; the remaining three were excluded because of an incorrect initial diagnosis [28].
Statistical analyses
For the current post-hoc analysis, data from the two treatment arms were pooled. We tested the following parameters as potential predictors for re-exacerbation: sex, age, smoking status, FEV1, dyspnoea as assessed with the MRC dyspnoea scale, home oxygen therapy, pretreatment with systemic glucocorticoids, pretreatment with antibiotics, duration of hospitalisation, blood pressure, oxygen saturation, admission to the intensive care unit (ICU) and relevant infections in follow-up. Categorical variables are summarised as absolute and relative frequencies, and quantitative variables as mean and standard deviation or median and interquartile range, depending on their distributional properties. For group comparisons, the t-test or Wilcoxon rank-sum-test were used for quantitative variables and the chi2-test or Fisher’s exact test for qualitative variables. Correlations between two quantitative variables were quantified as Spearman’s rank correlation coefficient. We used logistic regression models to investigate the associations of baseline factors with the risk for COPD re exacerbation, and re exacerbation and/or death, during follow-up. Models were adjusted for the following confounding variables: pretreatment with glucocorticoids, age, Global Initiative for Chronic Obstructive Lung Disease (GOLD) COPD grade, present smoking and sex. Survival methods were used to analyse time to re-exacerbation and time to re-exacerbation and/or death. In patients without an event during follow-up, the time to their last follow-up contact was considered as censored outcome. Kaplan-Meier plots and the log rank test were used to compare event times between groups. Associations of event times with predictor variables were assessed with Cox proportional hazard models, which were built in the same way as the logistic regression models. The proportional hazard assumption was tested on the basis of the Schoenfeld residuals [32]. To study the influence of time-varying predictor variables on the risk of an event, observation time was split into different periods defined by the date of discharge and the follow-up contacts, and predictor variables were updated at the start of each interval if they had been re-measured at this time point. For each of the variables measured repeatedly during follow-up, we assessed the relative importance of the most recent value and the value at discharge for predicting the risk of an event in the next time interval. For our statistical analyses we focused on the values of predictor variables at study inclusion (D0), day 6 (D6) and hospital discharge, since re-exacerbation events would occur after these time-points. The follow-up period was defined as the time between hospital discharge and study close-out after 6 months. A two-sided p-value of <0.05 was considered statistically significant. All calculations were done with Stata version 13.1 (StataCorp, College Station, TX, USA).
Results
Baseline characteristics of the study population are shown in table 1. An overview of quantitative variables at various study time-points is shown in supplementary table S1 (appendix).
Table 1 Baseline characteristics of study participants. (Reproduced from ref. [29], with permission of the publisher.)
|
Characteristics
|
Overall cohort
(n = 311)
|
| Age (years), mean (SD) |
69.8 (10.9) |
| Women, n (%)*
|
123 (39.5) |
| Smoking history |
|
| Active smokers, n (%) |
139 (45.1) |
| Pack years, median (quartiles) |
50 (30, 60) |
| FEV1 (% predicted), mean (SD) |
31.5 (14.3) |
| GOLD COPD grade†, n (%) |
|
| 1 |
1 (0.3) |
| 2 |
40 (13.3) |
| 3 |
98 (32.6) |
| 4 |
162 (53.8) |
| Medical Research Council dyspnoea scale‡, n (%) |
|
| 1 |
8 (2.7) |
| 2 |
27 (9.3) |
| 3 |
38 (13.0) |
| 4 |
88 (30.5) |
| 5 |
130 (44.5) |
| Home oxygen therapy, n (%) |
40 (13.0) |
| Pretreatment with systemic glucocorticoids, n (%)§
|
63 (20.1) |
| Pretreatment daily prednisone dose (mg), median (quartiles) |
20 (5, 50) |
| Pretreatment with antibiotics, n (%)¶
|
53 (17) |
| Clinical variables) |
|
| Systolic blood pressure (mmHg), median (quartiles) |
138 (124, 158) |
| Diastolic blood pressure (mmHg), median (quartiles) |
80 (70, 90) |
| Heart rate (bpm), median (quartiles) |
91 (80, 105) |
| Oxygen saturation with nasal oxygen (%), median (quartiles) |
95 (92, 97) |
| Oxygen saturation without nasal oxygen (%), median (quartiles) |
90 (86, 94) |
| Temperature (°C), median (quartiles) |
37.3 (36.8, 38.1) |
A total of 113 out of the 311 analysed patients experienced one or more exacerbations during the follow-up of 180 days [28]. The proportion of patients experiencing a re-exacerbation was 40% with a COPD GOLD grade 4, 35% for grade 3, and 29% for grades 1 and 2.
Bivariate and multivariate analyses
For these analyses, we used FEV1 in % predicted rather than the GOLD grade. Table 2 shows bivariate associations between possible predictor variables and the outcome variables “re-exacerbation” or “re-exacerbation and/or death”. Previous smoking, a lower FEV1, pretreatment with systemic glucocorticoids, use of home oxygen therapy, longer duration of hospitalisation and a higher score in the MRC dyspnoea scale were all associated with a higher hazard ratio for re-exacerbation or re-exacerbation and/or death at one or more time-points. Need for mechanical ventilation (defined as intubation or noninvasive ventilation) was not associated with the outcome variables at any time-point (not shown).
Table 2 Bivariate analyses of potential predictor variables of time to re-exacerbation or re-exacerbation and/or death.
|
Predictor variable
|
Re-exacerbation
Hazard ratio
(95% CI)
|
p-value
|
Re-exacerbation
and/or death
Hazard ratio
(95% CI)
|
p-value
|
| Male |
1 |
|
1 |
0.34 |
| Female |
0.91 (0.62–1.33) |
0.63 |
0.84 (0.58–1.21) |
|
| Age, years |
|
|
|
|
| <65 |
1 |
|
1 |
|
| 65–75 |
1.06 (0.66–1.72) |
0.81 |
1.09 (0.68–1.75) |
0.72 |
| >75 |
1.30 (0.83–2.03) |
0.25 |
1.42 (0.92–2.19) |
0.11 |
| Pack-years |
|
|
|
|
| <40 |
1 |
|
1 |
|
| 40–80 |
0.57 (0.38–0.86) |
0.01 |
0.63 (0.42–0.94) |
0.02 |
| >80 |
0.93 (0.48–1.77) |
0.81 |
0.90 (0.47–1.72) |
0.76 |
| FEV1 (% predicted) D0 |
|
|
|
|
| ≥50 |
1 |
|
1 |
|
| 30–49 |
1.33 (0.71–2.48) |
0.37 |
1.31 (0.72–2.40) |
0.38 |
| <30 |
1.54 (0.87–2.75) |
0.14 |
1.57 (0.90–2.74) |
0.11 |
| FEV1 (% predicted) D6 |
|
|
|
|
| ≥50 |
1 |
|
1 |
|
| 30–49 |
1.83 (1.14–2.94) |
0.01 |
1.60 (1.01–2.52) |
0.04 |
| <30 |
2.25 (1.39–3.64) |
0.00 |
2.21 (1.40–3.46) |
0.00 |
| FEV1 (% predicted) discharge |
|
|
|
|
| ≥50 |
1 |
|
1 |
|
| 30–49 |
1.58 (1.02–2.45) |
0.04 |
1.45 (0.96–2.21) |
0.08 |
| <30 |
2.00 (1.26–3.17) |
0.00 |
1.80 (1.16–2.81) |
0.01 |
| Pretreatment with systemic glucocorticoids |
|
|
|
|
| Yes |
1.61 (1.05–2.45) |
0.03 |
1.65 (1.10–2.47) |
0.02 |
| No |
1 |
|
1 |
|
| Active smokers |
|
|
|
|
| Yes |
0.56 (0.38–0.82) |
0.00 |
0.56 (0.38–0.81) |
0.00 |
| No |
1 |
|
1 |
|
| Home oxygen therapy |
|
|
|
|
| Yes |
2.27 (1.43–3.59) |
0.00 |
2.51 (1.64–3.86) |
0.00 |
| No |
1 |
|
1 |
|
| MRC dyspnoea scale D0 |
|
|
|
|
| 1 |
1 |
|
1 |
|
| 2 |
0.49 (0.12–2.07) |
0.33 |
0.59 (0.15–2.37) |
0.46 |
| 3 |
0.63 (0.17–2.32) |
0.49 |
0.70 (0.19–2.54) |
0.59 |
| 4 |
1.10 (0.34–3.59) |
0.87 |
1.14 (0.35–3.69) |
0.83 |
| 5 |
1.36 (0.42–4.34) |
0.61 |
1.48 (0.46–4.71) |
0.51 |
| MRC dyspnoea scale D6 |
|
|
|
|
| 1 |
1 |
|
1 |
|
| 2 |
1.28 (0.59–2.77) |
0.53 |
1.45 (0.68–3.09) |
0.34 |
| 3 |
1.97 (0.94–4.12) |
0.07 |
2.09 (1.00–4.35) |
0.05 |
| 4 |
1.66 (0.78–3.54) |
0.19 |
1.79 (0.84–3.79) |
0.13 |
| 5 |
1.89 (0.84–4.24) |
0.12 |
2.00 (0.90–4.45) |
0.09 |
| MRC dyspnoea scale discharge |
|
|
|
|
| 1 |
1 |
|
1 |
|
| 2 |
1.18 (0.54–2.56) |
0.68 |
1.34 (0.63–2.87) |
0.45 |
| 3 |
2.28 (1.08–4.83) |
0.03 |
2.36 (1.12–4.99) |
0.02 |
| 4 |
2.35 (1.08–5.12) |
0.03 |
2.47 (1.14–5.33) |
0.02 |
| 5 |
2.38 (0.88–6.38) |
0.09 |
2.38 (0.89–6.39) |
0.09 |
| Length of hospitalisation |
|
|
|
|
| >8 days |
1.71 (1.16–2.51) |
0.01 |
1.85 (1.27–2.69) |
0.00 |
| ≤8 days |
1 |
|
1 |
|
Table 3 and table 4 show the results of the multivariate analyses for the outcomes re-exacerbation and re-exacerbation and/or death, respectively, with predictor variables assessed at inclusion, day 6 and discharge and adjusted for several potential confounder variables. The risk of re-exacerbation during follow-up was positively associated with a duration of hospital stay >8 days, low FEV1, pretreatment with systemic glucocorticoids and use of home oxygen therapy. However, only the association with longer hospitalisation was statistically significant across all three time-points. Of the 139 active smokers, 39 (28.1%) had a re-exacerbation and 42 (30.2%) reached the endpoint re-exacerbation and/or death. Current smoking at the time of admission showed a significant negative association with the two outcomes. There was no evidence of an effect of sex, age or the need for mechanical ventilation on the two outcomes.
Table 3 Multivariate analyses of predictor variables of time to re-exacerbation.
|
D0
|
D6
|
Discharge
|
|
Hazard ratio
(95% CI)
|
p-value
|
Hazard ratio
(95% CI)
|
p-value
|
Hazard ratio
(95% CI)
|
p-value
|
| Male |
1 |
|
1 |
|
1 |
|
| Female |
0.94 (0.63–1.40) |
0.75 |
0.94 (0.63–1.41) |
0.78 |
0.97 (0.65–1.46) |
0.90 |
| Age, years |
|
|
|
|
|
|
| <65 |
1 |
|
1 |
|
1 |
|
| 65–75 |
0.87 (0.53–1.43) |
0.58 |
0.85 (0.51–1.40) |
0.51 |
0.80 (0.49–1.33) |
0.40 |
| >75 |
1.02 (0.63–1.66) |
0.94 |
1.00 (0.61–1.62) |
0.99 |
0.99 (0.61–1.60) |
0.97 |
| Group*
|
|
|
|
|
|
|
| Conventional treatment |
1 |
|
1 |
|
1 |
|
| Short-term treatment |
0.94 (0.64–1.38) |
0.75 |
0.97 (0.66–1.42) |
0.88 |
0.92 (0.63–1.35) |
0.67 |
| Home oxygen therapy |
|
|
|
|
|
|
| Yes |
1.46 (0.86–2.47) |
0.16 |
1.27 (0.74–2.18) |
0.38 |
1.29 (0.75–2.22) |
0.35 |
| No |
1 |
|
1 |
|
1 |
|
| Active smoker |
|
|
|
|
|
|
| Yes |
0.62 (0.40–0.96) |
0.03 |
0.58 (0.37–0.90) |
0.02 |
0.60 (0.38–0.92) |
0.02 |
| No |
1 |
|
1 |
|
1 |
|
| Pretreatment with systemic glucocorticoids |
|
|
|
|
|
|
| Yes |
1.44 (0.90–2.30) |
0.13 |
1.52 (0.95–2.43) |
0.08 |
1.40 (0.87–2.24) |
0.16 |
| No |
1 |
|
1 |
|
1 |
|
| Length of hospitalisation |
|
|
|
|
|
|
| >8 days |
1.54 (1.03–2.28) |
0.03 |
1.44 (0.97–2.15) |
0.07 |
1.54 (1.03–2.28) |
0.03 |
| ≤8 days |
1 |
|
1 |
|
1 |
|
| FEV1 (% predicted) |
|
|
|
|
|
|
| ≥50 |
1 |
|
1 |
|
1 |
|
| 30–49 |
1.33 (0.71–2.50) |
0.37 |
1.89 (1.16–3.08) |
0.01 |
1.46 (0.94–2.27) |
0.10 |
| <30 |
1.44 (0.79–2.62) |
0.24 |
1.86 (1.12–3.08) |
0.02 |
1.76 (1.06–2.91) |
0.03 |
Table 4 Multivariate analyses of predictor variables of time to re-exacerbation and/or death.
|
Time of measurement
|
|
D0
|
D6
|
Discharge
|
|
Hazard ratio
(95% CI)
|
p-value
|
Hazard ratio
(95% CI)
|
p-value
|
Hazard ratio
(95% CI)
|
p-value
|
| Male |
1 |
|
1 |
|
1 |
|
| Female |
0.84 (0.57–1.24) |
0.38 |
0.84 (0.57–1.25) |
0.39 |
0.86 (0.58–1.28) |
0.46 |
| Age, years |
|
|
|
|
|
|
| <65 |
1 |
|
1 |
|
1 |
|
| 65–75 |
0.90 (0.55–1.47) |
0.68 |
0.89 (0.54–1.45) |
0.63 |
0.85 (0.52–1.38) |
0.51 |
| >75 |
1.12 (0.70–1.79) |
0.64 |
1.10 (0.69–1.76) |
0.68 |
1.08 (0.68–1.72) |
0.75 |
| Group*
|
|
|
|
|
|
|
| Conventional treatment |
1 |
|
1 |
|
1 |
|
| Short-term treatment |
0.87 (0.60–1.26) |
0.47 |
0.90 (0.62–1.30) |
0.56 |
0.86 (0.60–1.25) |
0.43 |
| Home oxygen therapy |
|
|
|
|
|
|
| Yes |
1.53 (0.97–2.61) |
0.07 |
1.41 (0.85–2.35) |
0.18 |
1.49 (0.89–2.48) |
0.13 |
| No |
1 |
|
1 |
|
1 |
|
| Active smoker |
|
|
|
|
|
|
| Yes |
0.67 (0.44–1.02) |
0.06 |
0.64 (0.42–0.98) |
0.04 |
0.65 (0.43–0.99) |
0.046 |
| No |
1 |
|
1 |
|
1 |
|
| Pretreatment with systemic glucocorticoids |
|
|
|
|
|
|
| Yes |
1.48 (0.95–2.32) |
0.09 |
1.54 (1.06–2.30) |
0.03 |
1.46 (0.93–0.28) |
0.10 |
| No |
1 |
|
1 |
|
1 |
|
| Length of hospitalisation |
|
|
|
|
|
|
| >8 days |
1.65 (1.12–2.42) |
0.01 |
1.56 (1.08–2.30) |
0.03 |
1.65 (1.12–2.43) |
1.01 |
| ≤8 days |
1 |
|
1 |
|
1 |
|
| FEV1 (% predicted) |
|
|
|
|
|
|
| ≥50 |
1 |
|
1 |
|
1 |
|
| 30–49 |
1.30 (0.70–2.39) |
0.40 |
1.59 (1.00–2.55) |
0.05 |
1.29 (0.84–1.97) |
0.24 |
| <30 |
1.43 (0.80–2.56) |
0.22 |
1.73 (1.07–2.80) |
0.03 |
1.49 (0.91–2.42) |
0.11 |
Stratified analyses
Analyses were stratified by age (<65 years, 65–75 years, >75 years), sex and FEV1% predicted at discharge (≥50%, 30–49%, <30%). However, there was no evidence that these factors modified the effects of other predictor variables (see appendix, tables S2A to S4B).
Survival analyses
We calculated the hazard ratios of re-exacerbation or re-exacerbation and/or death associated with various predictor variables at baseline. As depicted in figure 1, panels A–D, smoking status, MRC dyspnoea scale score and duration of hospital stay were all statistically significant predictors of re-exacerbation. This was also the case for re-exacerbation and/or death (data not shown). Associations of the two risks with the predictor variable hypertension were also positive but not statistically significant. The association of re-exacerbation with FEV1 was analysed at baseline, day 6 and hospital discharge (fig. 2). It was negative across all three time-points and reached statistical significance at D6 (panel B) and discharge (panel C). Again, results were similar for the outcome re-exacerbation and/or death.
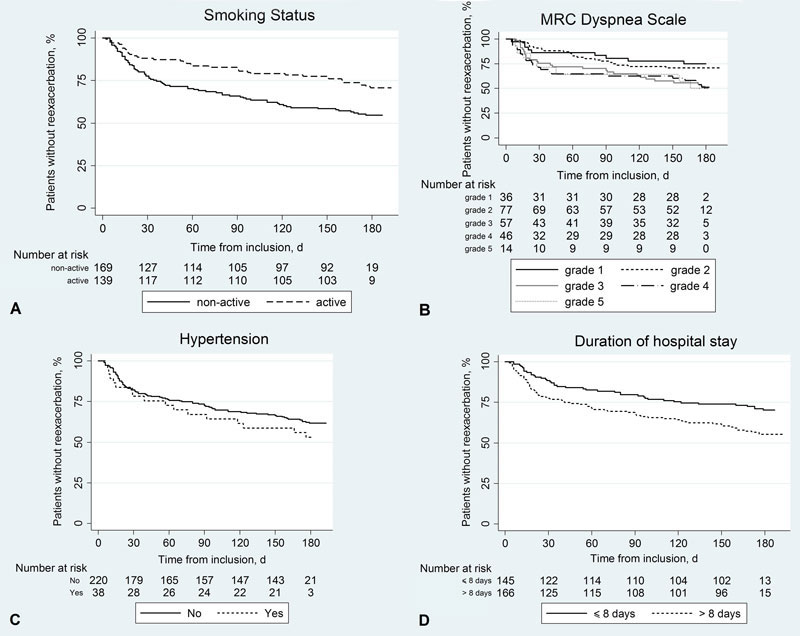
Figure 1 Survival curves according to various predictor variables at discharge.
The curves show the proportions of patients without re-exacerbation during follow-up over time: (A) active smoking (yes vs no, p(log rank test) = 0.003), (B) Medical Research Council dyspnoea scale (levels 1 to 5, p = 0.02), (C) hypertension (yes vs no, p = 0.30) and (D) duration of hospital stay (>8 vs ≤8 days, p = 0.006).
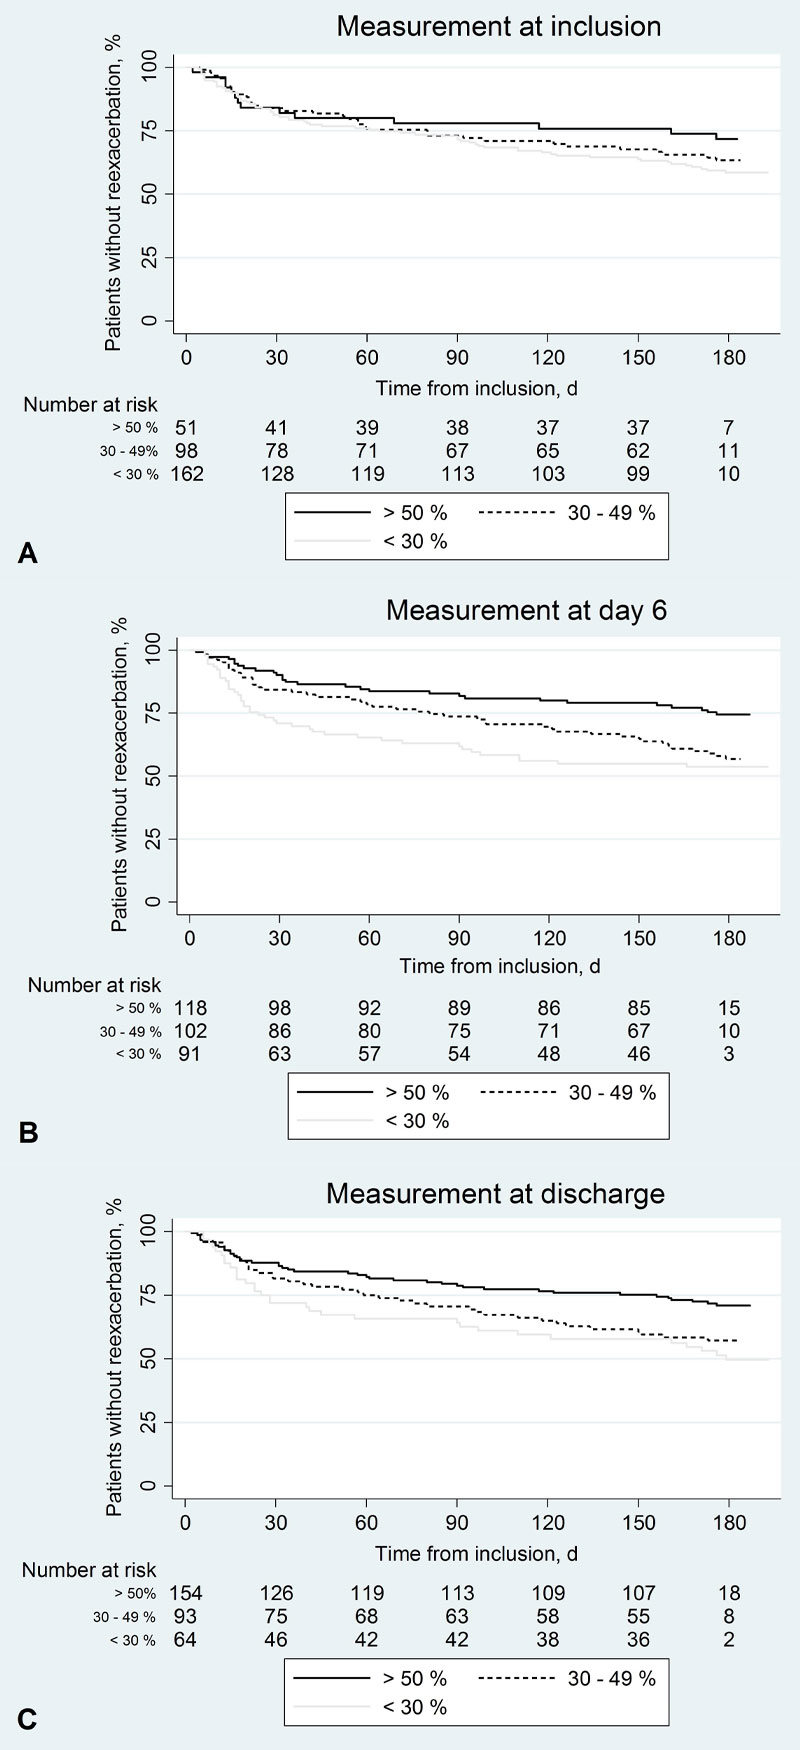
Figure 2 Survival curves according to forced expiratory volume in 1 second (FEV1) at baseline, day 6 and discharge.
Proportions of patients without re-exacerbation during follow-up for different categories of FEV1 in % predicted (<30%, 30–50%, >50%): (A) at inclusion (p(log rank test) = 0.31), (B) at day 6 (p = 0.003) and (C) at discharge (p = 0.008).
Time-varying predictor variables
Results of the analyses for the outcome re-exacerbation are shown in table 5. Using Cox-proportional hazards models with different consecutive time periods to take into account changes in predictor variables during follow-up, we found that smoking during follow up showed a significant negative association with the risk of re-exacerbation in the next time period (HR 0.47, p = 0.04), whereas smoking at discharge showed a positive but not statistically significant association. The measurements of lung function, hypertension and the MRC dyspnoea score during follow-up also showed stronger associations with the subsequent risk of re-exacerbation than the corresponding values measured at discharge. A high MRC dyspnoea score at follow-up was strongly predictive of a re-exacerbation in the next time period.
Table 5 Hazard ratios of re-exacerbation associated with the p-values of predictor variables at discharge and during follow-up.
|
Predictor variable
|
Measurement at discharge
Hazard ratio
(95% CI)
|
p-value
|
Measurement during follow-up*
Hazard ratio
(95% CI)
|
p-value
|
| FEV1, % predicted |
1.00 (0.97–1.02) |
0.86 |
0.98 (0.95–1.00) |
0.06 |
| FVC, % predicted |
1.00 (0.99–1.02) |
0.83 |
0.99 (0.98–1.00) |
0.20 |
| Weight, kg |
1.04 (0.92–1.17) |
0.54 |
0.96 (0.86–1.08) |
0.55 |
| Hyperglycaemia |
1.13 (0.71–1.79) |
0.61 |
1.36 (0.76–2.42) |
0.30 |
| Hypertension |
1.10 (0.56–2.19) |
0.78 |
2.39 (1.04–5.48) |
0.04 |
| ICU |
1.38 (0.61–3.11) |
0.44 |
1.36 (0.75–2.48) |
0.32 |
| Pulse |
1.07 (0.90–1.28) |
0.43 |
1.03 (0.87–1.22) |
0.73 |
| Systolic blood pressure |
1.06 (0.94–1.20) |
0.32 |
0.98 (0.87–1.09) |
0.68 |
| Diastolic blood pressure |
0.85 (0.68–1.07) |
0.17 |
1.08 (0.89–1.31) |
0.46 |
| MRC dyspnoea scale |
1.01 (0.82–1.26) |
0.90 |
1.61 (1.30–2.01) |
0.00 |
| Health score – doctor |
0.94 (0.81–1.08) |
0.38 |
0.92 (0.83–1.02) |
0.11 |
| Health score – patient |
0.90 (0.80–1.03) |
0.13 |
0.95 (0.84–1.08) |
0.42 |
| Infection |
0.95 (0.30–3.02) |
0.93 |
0.93 (0.56–1.56) |
0.80 |
| Oxygen saturation without administered O2
|
1.08 (0.42–2.76) |
0.88 |
0.68 (0.31–1.50) |
0.34 |
Table 6 shows the results of the corresponding analyses for the outcome re-exacerbation and/or death. Hazard ratios were comparable to the ones for re-exacerbation in table 5.
Table 6 Hazard ratios of re-exacerbation and/or death associated with the p-values of predictor variables at discharge and during follow-up.
|
Predictor variable
|
Measurement at discharge
Hazard ratio
(95% CI)
|
p-value
|
Measurement during follow-up*
Hazard ratio
(95% CI)
|
p-value
|
| FEV1, % predicted |
1.00 (0.98–1.03) |
0.80 |
0.98 (0.95–1.00) |
0.03 |
| FVC, % predicted |
1.00 (0.99–1.02) |
0.73 |
0.99 (0.98–1.00) |
0.18 |
| Weight |
1.04 (0.93–1.16) |
0.52 |
0.97 (0.86–1.08) |
0.55 |
| Hyperglycaemia |
1.06 (0.67–1.67) |
0.80 |
1.46 (0.84–2.55) |
0.18 |
| Hypertension |
1.13 (0.58–2.19) |
0.73 |
2.57 (1.15–5.73) |
0.02 |
| ICU |
1.41 (0.63–3.14) |
0.41 |
1.32 (0.72–2.40) |
0.37 |
| Pulse |
1.06 (0.89–1.26) |
0.51 |
1.02 (0.87–1.21) |
0.77 |
| Systolic blood pressure |
1.07 (0.95–1.20) |
0.28 |
0.96 (0.86–1.08) |
0.50 |
| Diastolic blood pressure |
0.85 (0.68–1.06) |
0.14 |
1.07 (0.88–1.29) |
0.51 |
| MRC dyspnoea scale |
1.00 (0.81–1.23) |
0.98 |
1.62 (1.31–2.00) |
0.00 |
| Health score – doctor |
0.89 (0.78–1.02) |
0.10 |
0.96 (0.86–1.06) |
0.38 |
| Health score – patient |
0.91 (0.80–1.03) |
0.13 |
0.97 (0.86–1.09) |
0.60 |
| Infection |
0.99 (0.31–3.16) |
0.99 |
0.91 (0.55–1.50) |
0.71 |
| Oxygen saturation without administered O2
|
1.07 (0.43–2.64) |
0.89 |
0.69 (0.32–1.48) |
0.34 |
Discussion
Prompted by our observation that low serum cortisol levels were inversely associated with COPD re-exacerbation risk [29], we used prospectively gathered data from the “REDUCE” trial [28] to identify additional predictors of re-exacerbation. Our data show that lower FEV1, a history of past (but not active) smoking, hospitalisation >8 days, hypertension and a higher score on the MRC dyspnoea scale all significantly predict COPD re-exacerbation. In contrast, a recent Norwegian study about predictors of exacerbations showed that female sex, higher age, a history of exacerbations the year before inclusion, higher GOLD grade, chronic cough and use of inhaled corticosteroids were significant predictors of an increased risk of exacerbations [33].
We consider discharge from the hospital as the most reliable time-point for our analyses since patients should have regained their former steady-state level of lung function and general health at this time.
Our observation that low FEV1 predicts an increased re-exacerbation risk is consistent with previous studies showing an association between exacerbation frequency and decreasing lung function in COPD [15–17, 19], and between low FEV1 and readmission risk. [34, 35]. FEV1 impairment is acknowledged as one of the major prognostic factors in the COPD GOLD report [2].
Surprisingly, current smoking at hospital admission, on day 6 at discharge and at later time-points was associated with a significantly lower risk of re-exacerbation than past smoking status. Current smoking has also been found to be negatively associated with hospitalisation for COPD exacerbation in a previous case-control study [36]. Our finding may be explained by a selection bias referred to as the “healthy smoker effect” [37], observed before in patients with asthma. Asthma patients with pronounced respiratory symptoms (e.g., coughing) seem to be more likely to quit smoking earlier than those who are relatively resistant to its unpleasant effects [38]. There is also evidence that symptomatic COPD patients are more likely to stop smoking [39]. This selective process is likely to bias the relationship between smoking and COPD re-exacerbation, disguising the causal effect of smoking [38, 40].
Interestingly, we identified new or worsening hypertension during follow-up as a significant predictor of COPD re-exacerbation. The Swiss COPD cohort similarly found that, cardiovascular diseases were associated with future exacerbation (in addition to previous rehabilitation, hospitalisation and a history of exacerbation) [41]. Arterial hypertension and COPD are often present in the same individual [42–44], and it has been speculated that low-grade systemic inflammation may be a common pathogenic factor in both medical conditions [45].
In the survival analyses, hospital stay >8 days and a higher grade of breathlessness as assessed by the MRC dyspnoea scale were significantly associated with the re-exacerbation risk. These observations are consistent with previous studies of the MRC dyspnoea scale, COPD exacerbations and length of hospital stay [10, 46, 47].
Our study has several limitations. The REDUCE trial was not designed specifically to identify risk factors of COPD re-exacerbation. Therefore, the causal relation between the predictors and outcome remains unproven. Additional limiting factors include the relatively small sample size, and the follow-up period of merely 6 months, during which time only approximately 36% of the study participants experienced a re-exacerbation [28]. Also, the trial was performed in only one country, precluding generalisation of our findings to populations outside Switzerland.
In conclusion, our study identified very severe COPD stage, hypertension, dyspnoea severity, and COPD-associated hospitalisation >8 days to be associated with an increased risk of COPD re-exacerbation. The identification of affected patients might facilitate preventive steps, such as extended planning of patient care after hospital discharge [48]. Our findings hold implications for future studies on tools to evaluate the risk of COPD re-exacerbation.
Appendix: Supplementary tables
Note:
Medical Research Council (MRC) dyspnoea scale (adapted from: Fletcher, C.M. The clinical diagnosis of pulmonary emphysema; an experimental study. Proceedings of the Royal Society of Medicine 1952;45:577–584):
1: no breathlessness except for strong exercises;
2: short of breath when walking up a hill or stairs;
3: unable to keep up with contemporaries because of breathlessness, able to walk a mile or more at his own speed;
4: stops for breath after walking about 100 yards;
5: too breathless on talking or breathless on dressing or undressing.
Abbreviations used in supplementary tables:
CI = confidence interval
D0 = day of inclusion
D6 = day 6
D30 = day 30
D90 = day 90
D180 = day 180
FEV1 = forced expiratory volume in first second
FEV1 % pred. = FEV1 % predicted
FVC = forced vital capacity
HR = hazard ratio
OR = odds ratio
SaO2 = oxygen saturation
Table S1 Characteristics of quantitative variables.
|
Variable
|
Time point
|
Mean
|
Std. Dev
|
Min
|
Max
|
P25
|
P50
|
P75
|
Age (years)
n = 311 |
|
69.8 |
10.9 |
42.8 |
97.7 |
61.6 |
70.9 |
78.1 |
Pack-years smoked
n = 293 |
|
50 |
23.7 |
10 |
150 |
30 |
50 |
60 |
Duration of hospitalisation (d)
n = 311 |
|
10.2 |
6.7 |
1 |
38 |
6 |
9 |
13 |
Temperature (°C)
n = 296 |
|
37.5 |
0.9 |
36 |
39.9 |
36.8 |
37.3 |
38.1 |
Time to exacerbation (d)
n = 309 |
|
129.1 |
69.7 |
2 |
193 |
57 |
179 |
179 |
Time to death (d)
n = 309 |
|
172.2 |
45.5 |
2 |
475 |
179 |
179 |
179 |
Cumulative dose steroids (mg)
n = 309 |
|
594.2 |
516.3 |
200 |
3324 |
200 |
560 |
600 |
FEV1 (% predicted)
n = 305 |
D0 |
31.5 |
14.3 |
7.1 |
81 |
21 |
28 |
41 |
FEV1 (L)
n = 301 |
D0 |
0.8 |
0.4 |
0.25 |
2.18 |
0.5 |
0.68 |
0.97 |
Tiffeneau (FEV1/FVC)
n = 300 |
D0 |
0.46 |
0.12 |
0.15 |
0.82 |
0.36 |
0.45 |
0.55 |
Heart rate (bpm)
n = 304 |
D0 |
93.4 |
18.9 |
47 |
159 |
80 |
91 |
105 |
Systolic blood pressure (mm Hg)
n = 307 |
D0 |
141.4 |
25.6 |
87 |
220 |
124 |
138 |
158 |
Diastolic blood pressure (mm Hg)
n = 307 |
D0 |
80.5 |
15.1 |
44 |
130 |
70 |
80 |
90 |
SaO2 with administered O2 (%)
n = 247 |
D0 |
94.1 |
3.5 |
84 |
100 |
92 |
95 |
97 |
SaO2 without administered O2 (%)
n = 210 |
D0 |
88.4 |
7.5 |
54 |
100 |
86 |
90 |
94 |
FEV1 (% predicted)
n = 289 |
D6 |
42.1 |
18.4 |
12 |
102 |
28 |
39 |
55 |
FEV1 (L)
n = 289 |
D6 |
1.03 |
0.5 |
0.32 |
2.83 |
0.67 |
0.93 |
1.3 |
Tiffeneau (FEV1/FVC)
n = 288 |
D6 |
0.48 |
0.14 |
0.16 |
0.94 |
0.38 |
0.46 |
0.58 |
Systolic blood pressure (mm Hg)
n = 294 |
D6 |
133.5 |
20.5 |
80 |
205 |
120 |
131.5 |
149 |
Diastolic blood pressure (mm Hg)
n = 294 |
D6 |
75 |
11.4 |
40 |
108 |
70 |
75 |
80 |
SaO2 with administered O2 (%)
n = 89 |
D6 |
92.1 |
10.2 |
0 |
99 |
91 |
93 |
95 |
SaO2 without administered O2 (%)
n = 193 |
D6 |
92.1 |
4.8 |
60 |
99 |
90 |
93 |
95 |
Weight (kg)
n = 293 |
D6 |
72.6 |
18.3 |
35 |
134 |
60 |
72 |
83 |
FEV1 (% predicted)
n = 237 |
Discharge |
43.5 |
17.6 |
12 |
101 |
29 |
43 |
55 |
FEV1 (L)
n = 237 |
Discharge |
1.05 |
0.5 |
0.32 |
2.83 |
0.71 |
1 |
1.3 |
Tiffeneau (FEV1/FVC)
n = 237 |
Discharge |
0.49 |
0.14 |
0.16 |
0.95 |
0.39 |
0.47 |
0.58 |
Systolic blood pressure (mm Hg)
n = 251 |
Discharge |
128.8 |
19.7 |
90 |
185 |
115 |
130 |
140 |
Diastolic blood pressure (mm Hg)
n = 251 |
Discharge |
72.8 |
10 |
40 |
100 |
68 |
73 |
80 |
SaO2 with administered O2 (%)
n = 42 |
Discharge |
93.3 |
3.2 |
84 |
98 |
92 |
93.5 |
96 |
SaO2 without administered O2 (%)
n = 161 |
Discharge |
92.1 |
7.6 |
8 |
99 |
90 |
93 |
96 |
Weight (kg)
n = 248 |
Discharge |
72 |
19 |
36 |
132 |
58 |
72 |
84 |
FEV1 (% predicted)
n = 245 |
D30 |
47.4 |
20 |
10 |
110 |
32 |
44 |
62 |
FEV1 (L)
n = 245 |
D30 |
1.19 |
0.6 |
0.25 |
3.32 |
0.79 |
1.03 |
1.57 |
Tiffeneau (FEV1/FVC)
n = 245 |
D30 |
0.50 |
0.14 |
0.19 |
0.91 |
0.40 |
0.50 |
0.61 |
Systolic blood pressure (mm Hg)
n = 246 |
D30 |
130.3 |
20.5 |
73 |
201 |
119 |
130 |
142 |
Diastolic blood pressure (mm Hg)
n = 245 |
D30 |
75.7 |
12.5 |
25 |
110 |
69 |
75 |
84 |
SaO2 with administered O2 (%)
n = 25 |
D30 |
92 |
4 |
81 |
98 |
89 |
93 |
94 |
SaO2 without administered O2 (%)
n = 161 |
D30 |
92.7 |
8.4 |
0 |
100 |
92 |
94 |
96 |
FEV1 (% predicted)
n = 205 |
D180 |
46.8 |
19.5 |
8 |
105 |
31 |
42 |
60 |
FEV1 (L)
n = 205 |
D180 |
1.18 |
0.6 |
0.31 |
3.26 |
0.79 |
1.02 |
1.48 |
Tiffeneau (FEV1/FVC)
n = 203 |
D180 |
0.49 |
0.14 |
0.16 |
0.94 |
0.39 |
0.49 |
0.59 |
Heart rate (bpm)
n = 203 |
D180 |
78.6 |
13.8 |
51 |
122 |
69 |
77 |
86 |
Systolic blood pressure (mm Hg)
n = 210 |
D180 |
133.1 |
20.6 |
84 |
199 |
120 |
131 |
142 |
Diastolic blood pressure (mm Hg)
n = 210 |
D180 |
77 |
11.6 |
43 |
106 |
70 |
77.5 |
85 |
SaO2 with administered O2 (%)
n = 14 |
D180 |
86.8 |
25.1 |
0 |
98 |
91 |
93.5 |
95 |
SaO2 without administered O2 (%)
n = 132 |
D180 |
93.7 |
3.1 |
84 |
100 |
92 |
94 |
96 |
Weight (kg)
n = 218 |
D180 |
73.2 |
18.9 |
35 |
134 |
60 |
72 |
85 |
Table S2
A: Multivariate analysis of time to re-exacerbation or re-exacerbation and/or death stratified by age at discharge.
|
<65 years
HR (95%CI)
|
65–75 years
HR (95%CI)
|
>75 years
HR (95%CI)
|
Heterogeneity
p-value*
|
|
Re-exacerbation
|
Women
p-value
|
0.56 (0.24–1.31)
0.18
|
1.10 (0.50–2.38)
0.82
|
1.37 (0.74–2.53)
0.32
|
0.24 |
Short-term group
p-value
|
0.90 (0.42–1.93)
0.78
|
0.76 (0.37–1.58)
0.46
|
0.91 (0.51–1.63)
0.76
|
0.92 |
Home oxygen therapy
p-value
|
1.27 (0.34–4.77)
0.72
|
2.43 (0.83–7.14)
0.11
|
0.86 (0.39–1.88)
0.70
|
0.31 |
Active smokers
p-value
|
0.63 (0.29–1.38)
0.25
|
1.03 (0.49–2.15)
0.94
|
0.26 (0.10–0.64)
0.00
|
0.07 |
Pretreatment with systemic glucocorticoids
p-value
|
2.15 (0.76–6.05)
0.15
|
0.58 (0.21–1.61)
0.30
|
2.05 (1.01–4.13)
0.046
|
0.10 |
Hospitalisation >8 days
p-value
|
1.18 (0.58–2.40)
0.65
|
1.36 (0.67–2.77)
0.39
|
2.06 (1.06–4.03)
0.03
|
0.50 |
FEV1 (% predicted) discharge
p-value
|
1.19 (0.77–1.84)
0.42
|
1.49 (0.90–2.47)
0.12
|
1.43 (0.94–2.20)
0.10
|
0.76 |
|
Re-exacerbation and/or death
|
Women
p-value
|
0.49 (0.21–1.16)
0.10
|
0.95 (0.44–2.04)
0.90
|
1.16 (0.64–2.09)
0.63
|
0.27 |
Short-term group
p-value
|
0.77 (0.36)
0.49
|
0.69 (0.34–1.41)
0.31
|
0.92 (0.53–1.59)
0.77
|
0.81 |
Home oxygen therapy
p-value
|
1.64 (0.46–5.87)
0.45
|
2.38 (0.82–6.94)
0.11
|
1.12 (0.54–2.31)
0.77
|
0.51 |
Active smokers
p-value
|
0.75 (0.34–1.64)
0.47
|
0.98 (0.47–2.02)
0.95
|
0.35 (0.16–0.78)
0.01
|
0.16 |
Pretreatment with systemic glucocorticoids
p-value
|
2.31 (0.82–6.45)
0.11
|
0.58 (0.21–1.59)
0.29
|
2.11 (1.10–4.06)
0.03
|
0.08 |
Hospitalisation >8 days
p-value
|
1.07 (0.53–2.16)
0.85
|
1.51 (0.75–3.04)
0.24
|
2.35 (1.22–4.54)
0.01
|
0.27 |
FEV1 (% predicted) discharge
p-value
|
1.11 (0.72–1.71)
0.64
|
1.42 (0.87–2.31)
0.16
|
1.24 (0.82–1.87)
0.30
|
0.76 |
Table S2B Multivariate analysis of re-exacerbation or re-exacerbation and/or death stratified by age at discharge.
|
<65 years
OR (95% CI)
|
65–75 years
OR (95% CI)
|
>75 years
OR (95% CI)
|
Heterogeneity
p-value*
|
|
Re-exacerbation
|
Women
p-value
|
0.55 (0.21–1.43)
0.22
|
1.30 (0.48–3.49)
0.61
|
1.65 (0.67–4.03)
0.28
|
0.23 |
Short-term group
p-value
|
1.11 (0.44–2.83)
0.82
|
0.86 (0.34–2.15)
0.74
|
0.84 (0.37–1.95)
0.69
|
0.90 |
Home oxygen therapy
p-value
|
1.01 (0.17–6.12)
1.00
|
3.24 (0.70–14.9)
0.13
|
0.92 (0.29–2.90)
0.89
|
0.41 |
Active smokers
p-value
|
0.50 (0.18–1.37)
0.18
|
0.98 (0.38–2.53)
0.96
|
0.19 (0.06–0.61)
0.01
|
0.10 |
Pretreatment with systemic glucocorticoids
p-value
|
2.41 (0.68–8.54)
0.17
|
0.45 (0.13–1.59)
0.21
|
1.74 (0.58–5.17)
0.32
|
0.14 |
Hospitalisation >8 days
p-value
|
1.27 (0.50–3.25)
0.61
|
1.40 (0.56–3.51)
0.47
|
2.85 (1.17–6.94)
0.02
|
0.40 |
FEV1 (% predicted) discharge
p-value
|
1.26 (0.70–2.24)
0.44
|
1.86 (1.00–3.47)
0.05
|
1.93 (1.07–3.48)
0.03
|
0.53 |
|
Re-exacerbation and/or death
|
Women
p-value
|
0.46 (0.17–1.23)
0.12
|
1.04 (0.39–2.77)
0.94
|
1.12 (0.46–2.72)
0.80
|
0.38 |
Short-term group
p-value
|
0.94 (0.37–2.39)
0.89
|
0.72 (0.29–1.79)
0.48
|
0.74 (0.32–1.73)
0.49
|
0.91 |
Home oxygen therapy
p-value
|
1.84 (0.29–11.6)
0.51
|
2.94 (0.64–13.5)
0.17
|
1.81 (0.54–6.03)
0.34
|
0.88 |
Active smokers
p-value
|
0.62 (0.23–1.71)
0.36
|
0.86 (0.33–2.23)
0.76
|
0.28 (0.10–0.80)
0.02
|
0.28 |
Pretreatment with systemic glucocorticoids
p-value
|
2.61 (0.74–9.18)
0.14
|
0.44 (0.12–1.54)
0.20
|
2.14 (0.69–6.67)
0.19
|
0.09 |
Hospitalisation >8 days
p-value
|
1.09 (0.43–2.81)
0.85
|
1.72 (0.69–4.29)
0.24
|
3.90 (1.60–9.50)
0.00
|
0.15 |
FEV1 (% predicted) discharge
p-value
|
1.15 (0.64–2.07)
0.65
|
1.74 (0.94–3.22)
0.08
|
1.63 (0.90–2.96)
0.11
|
0.58 |
All variables listed in the table were simultaneously included in the model.
* Chi2-Test |
Table S3
A: Multivariate analysis of time to re-exacerbation or re-exacerbation and/or death stratified by FEV1 at discharge.
|
FEV1 (% pred.) ≥50%
HR (95%CI)
|
FEV1 (% pred.) 30–49%
HR (95%CI)
|
FEV1 (% pred.) <30%
HR (95%CI)
|
Heterogeneity
p-value*
|
|
Re-exacerbation
|
Women
p-value
|
1.39 (0.72–2.68)
0.33
|
0.65 (0.30–1.39)
0.27
|
1.10 (0.51–2.37)
0.80
|
0.33 |
Age
p-value
|
0.96 (0.66–1.41)
0.85
|
1.19 (0.70–2.03)
0.52
|
0.94 (0.58–1.52)
0.79
|
0.77 |
Short-term group
p-value
|
1.17 (0.60–2.27)
0.64
|
0.92 (0.47–1.79)
0.80
|
0.60 (0.27–1.33)
0.21
|
0.45 |
Home oxygen therapy
p-value
|
2.50 (0.81–7.72)
0.11
|
1.19 (0.48–2.95)
0.71
|
0.97 (0.41–2.32)
0.95
|
0.41 |
Active smokers
p-value
|
0.54 (0.26–1.12)
0.10
|
0.70 (0.29–1.68)
0.42
|
0.61 (0.27–1.38)
0.24
|
0.91 |
Pretreatment with systemic glucocorticoids
p-value
|
1.00 (0.41–2.47)
1.00
|
1.42 (0.58–3.48)
0.45
|
2.03 (0.90–4.57)
0.09
|
0.52 |
Hospitalisation >8 days
p-value
|
1.32 (0.67–2.59)
0.43
|
1.57 (0.76–3.27)
0.22
|
1.56 (0.75–3.24)
0.23
|
0.92 |
|
Re-exacerbation and/or death
|
Women
p-value
|
1.08 (0.58–2.02)
0.82
|
0.62 (0.29–1.33)
0.22
|
1.06 (0.50–2.27)
0.88
|
0.50 |
Age
p-value
|
1.06 (0.74–1.51)
0.76
|
1.18 (0.70–1.99)
0.55
|
0.97 (0.60–1.57)
0.91
|
0.87 |
Short-term group
p-value
|
1.06 (0.57–1.97)
0.86
|
0.85 (0.44–1.65)
0.64
|
0.56 (0.26–1.22)
0.14
|
0.46 |
Home oxygen therapy
p-value
|
2.84 (1.05–7.65)
0.04
|
1.29 (0.54–3.08)
0.57
|
1.08 (0.46–2.52)
0.86
|
0.32 |
Active smokers
p-value
|
0.70 (0.36–1.37)
0.30
|
0.66 (0.28–1.57)
0.35
|
0.61 (0.27–1.35)
0.22
|
0.96 |
Pretreatment with systemic glucocorticoids
p-value
|
1.33 (0.61–2.91)
0.47
|
1.28 (0.53–3.10)
0.59
|
1.93 (0.87–4.29)
0.11
|
0.74 |
Hospitalisation >8 days
p-value
|
1.51 (0.79–2.88)
0.21
|
1.69 (0.82–3.47)
0.15
|
1.64 (0.79–3.37)
0.18
|
0.97 |
Table S3B Multivariate analysis of re-exacerbation or re-exacerbation and/or death stratified by FEV1 at discharge.
|
FEV1 (% pred.) ≥50%
OR (95% CI)
|
FEV1 (% pred.) 30–49%
OR (95% CI)
|
FEV1 (% pred.) <30%
OR (95% CI)
|
Heterogeneity
p-value*
|
|
Re-exacerbation
|
Women
p-value
|
1.45 (0.67–3.15)
0.35
|
0.52 (0.20–1.36)
0.19
|
1.44 (0.44–4.67)
0.54
|
0.23 |
Age
p-value
|
0.81 (0.51–1.29)
0.38
|
1.15 (0.58–2.28)
0.68
|
1.01 (0.51–2.02)
0.97
|
0.68 |
Short-term group
p-value
|
1.11 (0.51–2.41)
0.80
|
1.02 (0.41–2.56)
0.96
|
0.74 (0.24–2.26)
0.60
|
0.84 |
Home oxygen therapy
p-value
|
1.90 (0.44–8.24)
0.39
|
2.04 (0.51–8.19)
0.32
|
0.77 (0.19–3.15)
0.72
|
0.57 |
Active smokers
p-value
|
0.43 (0.19–1.00)
0.05
|
0.60 (0.19–1.87)
0.38
|
0.53 (0.16–1.78)
0.30
|
0.90 |
Pretreatment with systemic glucocorticoids
p-value
|
1.00 (0.35–2.89)
1.00
|
1.24 (0.33–4.59)
0.75
|
2.44 (0.70–8.52)
0.16
|
0.55 |
Hospitalisation >8 days
p-value
|
1.52 (0.69–3.38)
0.30
|
1.77 (0.69–4.55)
0.24
|
2.06 (0.70–6.07)
0.19
|
0.91 |
|
Re-exacerbation and/or death
|
Women
p-value
|
1.06 (0.50–2.27)
0.88
|
0.45 (0.17–1.19)
0.11
|
1.31 (0.40–4.29)
0.66
|
0.29 |
Age
p-value
|
0.91 (0.58–1.43)
0.68
|
1.15 (0.58–2.29)
0.69
|
1.12 (0.56–2.24)
0.76
|
0.81 |
Short-term group
p-value
|
0.97 (0.46–2.07)
0.94
|
0.88 (0.35–2.24)
0.79
|
0.63 (0.21–1.95)
0.42
|
0.82 |
Home oxygen therapy
p-value
|
3.39 (0.74–15.4)
0.12
|
3.05 (0.68–13.7)
0.15
|
1.03 (0.25–4.23)
0.97
|
0.45 |
Active smokers
p-value
|
0.56 (0.25–1.24)
0.15
|
0.53 (0.17–1.68)
0.28
|
0.52 (0.15–1.76)
0.29
|
0.99 |
Pretreatment with systemic glucocorticoids
p-value
|
1.48 (0.55–4.03)
0.44
|
0.98 (0.26–3.78)
0.98
|
2.04 (0.58–7.15)
0.27
|
0.74 |
Hospitalisation >8 days
p-value
|
1.88 (0.87–4.08)
0.11
|
2.18 (0.83–5.73)
0.11
|
2.24 (0.76–6.66)
0.15
|
0.96 |
Table S4
A: Multivariate analysis of time to re-exacerbation or re-exacerbation and/or death stratified by gender.
|
Women
HR (95% CI)
|
Men
HR (95% CI)
|
Heterogeneity
p-value*
|
|
Re-exacerbation
|
Age
p-value
|
1.16 (0.78–1.72)
0.47
|
0.94 (0.68–1.30)
0.71
|
0.42 |
Short-term group
p-value
|
1.08 (0.56–2.09)
0.82
|
0.84 (0.52–1.36)
0.48
|
0.55 |
Home oxygen therapy
p-value
|
1.44 (0.60–3.42)
0.41
|
1.33 (0.66–2.69)
0.42
|
0.90 |
Active smokers
p-value
|
0.40 (0.21–0.79)
0.01
|
0.82 (0.47–1.43)
0.48
|
0.11 |
Pretreatment with systemic glucocorticoids
p-value
|
1.34 (0.66–2.69)
0.42
|
1.49 (0.78–2.82)
0.23
|
0.83 |
Hospitalisation >8 days
p-value
|
1.85 (0.92–3.70)
0.08
|
1.39 (0.85–2.27)
0.19
|
0.52 |
FEV1 (% predicted) discharge
p-value
|
1.24 (0.81–1.90)
0.32
|
1.31 (0.96–1.78)
0.09
|
0.85 |
|
Re-exacerbation and/or death
|
Age
p-value
|
1.20 (0.81–1.78)
0.35
|
0.98 (0.72–1.34)
0.92
|
0.42 |
Short-term group
p-value
|
1.03 (0.53–1.98)
0.93
|
0.78 (0.49–1.23)
0.29
|
0.50 |
Home oxygen therapy
p-value
|
1.46 (0.61–3.46)
0.40
|
1.63 (0.86–3.11)
0.13
|
0.83 |
Active smokers
p-value
|
0.44 (0.23–0.86)
0.02
|
0.87 (0.52–1.49)
0.62
|
0.12 |
Pretreatment with systemic glucocorticoids
p-value
|
1.32 (0.66–2.64)
0.44
|
1.61 (0.89–2.91)
0.12
|
0.67 |
Hospitalisation >8 days
p-value
|
1.89 (0.95–3.77)
0.07
|
1.55 (0.97–2.48)
0.07
|
0.64 |
FEV1 (% predicted) discharge
p-value
|
1.21 (0.80–1.85)
0.37
|
1.16 (0.86–1.56)
0.33
|
0.86 |
Table S4B Multivariate analysis of re-exacerbation or re-exacerbation and/or death stratified by gender.
|
Women
OR (95% CI)
|
Men
OR (95% CI)
|
Heterogeneity
p-value*
|
|
Re-exacerbation
|
Age
p-value
|
1.12 (0.67–1.86)
0.68
|
0.88 (0.58–1.33)
0.54
|
0.47 |
Short-term group
p-value
|
1.25 (0.53–2.99)
0.61
|
0.88 (0.47–1.64)
0.69
|
0.52 |
Home oxygen therapy
p-value
|
1.17 (0.30–4.54)
0.82
|
1.57 (0.61–4.06)
0.35
|
0.73 |
Active smokers
p-value
|
0.27 (0.10–0.69)
0.01
|
0.73 (0.36–1.47)
0.38
|
0.10 |
Pretreatment with systemic glucocorticoids
p-value
|
1.57 (0.56–4.40)
0.39
|
1.17 (0.50–2.71)
0.72
|
0.66 |
Hospitalisation >8 days
p-value
|
2.48 (1.02–6.05)
0.045
|
1.43 (0.76–2.67)
0.27
|
0.32 |
FEV1 (% predicted) discharge
p-value
|
1.63 (0.92–2.89)
0.10
|
1.55 (1.04–2.31)
0.03
|
0.89 |
|
Re-exacerbation and/or death
|
Age
p-value
|
1.19 (0.72–1.99)
0.49
|
0.94 (0.62–1.43)
0.77
|
0.47 |
Short-term group
p-value
|
1.12 (0.48–2.66)
0.79
|
0.74 (0.40–1.38)
0.34
|
0.44 |
Home oxygen therapy
p-value
|
1.24 (0.32–4.76)
0.76 |
2.74 (1.02–7.38)
0.046 |
0.35 |
Active smokers
p-value
|
0.32 (0.13–0.80)
0.02
|
0.75 (0.37–1.52)
0.43
|
0.15 |
Pretreatment with systemic glucocorticoids
p-value
|
1.48 (0.54–4.10)
0.45
|
1.34 (0.58–3.13)
0.50
|
0.88 |
Hospitalisation >8 days
p-value
|
2.59 (1.07–6.24)
0.03
|
1.76 (0.95–3.28)
0.07
|
0.49 |
FEV1 (% predicted)
discharge
p-value
|
1.55 (0.88–2.73)
0.13
|
1.32 (0.89–1.97)
0.17
|
0.65 |
Jonas Rutishauser MD, Kantonsspital Baselland, Department of Medicine, University Clinic of Medicine Location Bruderholz,, CH-4101 Bruderholz, Switzerland, j.rutishauser[at]unibas.ch
References
1World Health Report [Internet]. Geneva: World Health Organization; [updated 2014 May; cited 2016 June 19]. Available from: http://www.who.int/mediacentre/factsheets/fs310/en/
2Global Initiative for Chronic Obstructive Lung Disease (GOLD) 2017 [Internet]. Global strategy for the diagnosis, management and prevention of COPD; [updated 2017; cited 2017 February 5]. Available from: http://goldcopd.org/
3
Rabe
KF
,
Hurd
S
,
Anzueto
A
,
Barnes
PJ
,
Buist
SA
,
Calverley
P
, et al.; Global Initiative for Chronic Obstructive Lung Disease. Global strategy for the diagnosis, management, and prevention of chronic obstructive pulmonary disease: GOLD executive summary. Am J Respir Crit Care Med. 2007;176(6):532–55. https://doi.org/10.1164/rccm.200703-456SO
4
Wedzicha
JA
,
Seemungal
TA
. COPD exacerbations: defining their cause and prevention. Lancet. 2007;370(9589):786–96. https://doi.org/10.1016/S0140-6736(07)61382-8
5
Sykes
A
,
Mallia
P
,
Johnston
SL
. Diagnosis of pathogens in exacerbations of chronic obstructive pulmonary disease. Proc Am Thorac Soc. 2007;4(8):642–6. https://doi.org/10.1513/pats.200707-101TH
6
Abu Hussein
N
,
Ter Riet
G
,
Schoenenberger
L
,
Bridevaux
PO
,
Chhajed
PN
,
Fitting
JW
, et al.
The ADO index as a predictor of two-year mortality in general practice-based chronic obstructive pulmonary disease cohorts. Respiration. 2014;88(3):208–14. https://doi.org/10.1159/000363770
7
Groenewegen
KH
,
Schols
AMWJ
,
Wouters
EFM
. Mortality and mortality-related factors after hospitalization for acute exacerbation of COPD. Chest. 2003;124(2):459–67. https://doi.org/10.1378/chest.124.2.459
8
Fletcher
CM
,
Elmes
PC
,
Fairbairn
AS
,
Wood
CH
. The significance of respiratory symptoms and the diagnosis of chronic bronchitis in a working population. BMJ. 1959;2(5147):257–66. https://doi.org/10.1136/bmj.2.5147.257
9
Bestall
JC
,
Paul
EA
,
Garrod
R
,
Garnham
R
,
Jones
PW
,
Wedzicha
JA
. Usefulness of the Medical Research Council (MRC) dyspnoea scale as a measure of disability in patients with chronic obstructive pulmonary disease. Thorax. 1999;54(7):581–6. https://doi.org/10.1136/thx.54.7.581
10
Jenkins
CR
,
Celli
B
,
Anderson
JA
,
Ferguson
GT
,
Jones
PW
,
Vestbo
J
, et al.
Seasonality and determinants of moderate and severe COPD exacerbations in the TORCH study. Eur Respir J. 2012;39(1):38–45. https://doi.org/10.1183/09031936.00194610
11
Yoshikawa
M
,
Fujita
Y
,
Yamamoto
Y
,
Yamauchi
M
,
Tomoda
K
,
Koyama
N
, et al.
Mini Nutritional Assessment Short-Form predicts exacerbation frequency in patients with chronic obstructive pulmonary disease. Respirology. 2014;19(8):1198–203. https://doi.org/10.1111/resp.12380
12
Hallin
R
,
Koivisto-Hursti
UK
,
Lindberg
E
,
Janson
C
. Nutritional status, dietary energy intake and the risk of exacerbations in patients with chronic obstructive pulmonary disease (COPD). Respir Med. 2007;101(9):1954–60. https://doi.org/10.1016/j.rmed.2007.04.009
13
Jochmann
A
,
Neubauer
F
,
Miedinger
D
,
Schafroth
S
,
Tamm
M
,
Leuppi
JD
. General practitioner’s adherence to the COPD GOLD guidelines: baseline data of the Swiss COPD Cohort Study. Swiss Med Wkly. 2010;140:w13053.
14
Jochmann
A
,
Scherr
A
,
Jochmann
DC
,
Miedinger
D
,
Török
SS
,
Chhajed
PN
, et al.
Impact of adherence to the GOLD guidelines on symptom prevalence, lung function decline and exacerbation rate in the Swiss COPD cohort. Swiss Med Wkly. 2012;142:w13567.
15
Fletcher
C
,
Peto
R
. The natural history of chronic airflow obstruction. BMJ. 1977;1(6077):1645–8. https://doi.org/10.1136/bmj.1.6077.1645
16
Hansel
TT
,
Barnes
PJ
. New drugs for exacerbations of chronic obstructive pulmonary disease. Lancet. 2009;374(9691):744–55. https://doi.org/10.1016/S0140-6736(09)61342-8
17
Donaldson
GC
,
Seemungal
TA
,
Bhowmik
A
,
Wedzicha
JA
. Relationship between exacerbation frequency and lung function decline in chronic obstructive pulmonary disease. Thorax. 2002;57(10):847–52. https://doi.org/10.1136/thorax.57.10.847
18
Tanabe
N
,
Muro
S
,
Hirai
T
,
Oguma
T
,
Terada
K
,
Marumo
S
, et al.
Impact of exacerbations on emphysema progression in chronic obstructive pulmonary disease. Am J Respir Crit Care Med. 2011;183(12):1653–9. https://doi.org/10.1164/rccm.201009-1535OC
19
Hurst
JR
,
Vestbo
J
,
Anzueto
A
,
Locantore
N
,
Müllerova
H
,
Tal-Singer
R
, et al.; Evaluation of COPD Longitudinally to Identify Predictive Surrogate Endpoints (ECLIPSE) Investigators. Susceptibility to exacerbation in chronic obstructive pulmonary disease. N Engl J Med. 2010;363(12):1128–38. https://doi.org/10.1056/NEJMoa0909883
20
Silverman
EK
. Exacerbations in chronic obstructive pulmonary disease: do they contribute to disease progression?
Proc Am Thorac Soc. 2007;4(8):586–90. https://doi.org/10.1513/pats.200706-068TH
21
Hurst
JR
,
Donaldson
GC
,
Wilkinson
TM
,
Perera
WR
,
Wedzicha
JA
. Epidemiological relationships between the common cold and exacerbation frequency in COPD. Eur Respir J. 2005;26(5):846–52. https://doi.org/10.1183/09031936.05.00043405
22
Spruit
MA
,
Gosselink
R
,
Troosters
T
,
Kasran
A
,
Gayan-Ramirez
G
,
Bogaerts
P
, et al.
Muscle force during an acute exacerbation in hospitalised patients with COPD and its relationship with CXCL8 and IGF-I. Thorax. 2003;58(9):752–6. https://doi.org/10.1136/thorax.58.9.752
23
Donaldson
GC
,
Wilkinson
TM
,
Hurst
JR
,
Perera
WR
,
Wedzicha
JA
. Exacerbations and time spent outdoors in chronic obstructive pulmonary disease. Am J Respir Crit Care Med. 2005;171(5):446–52. https://doi.org/10.1164/rccm.200408-1054OC
24
Pitta
F
,
Troosters
T
,
Probst
VS
,
Spruit
MA
,
Decramer
M
,
Gosselink
R
. Physical activity and hospitalization for exacerbation of COPD. Chest. 2006;129(3):536–44. https://doi.org/10.1378/chest.129.3.536
25
Seymour
JM
,
Moore
L
,
Jolley
CJ
,
Ward
K
,
Creasey
J
,
Steier
JS
, et al.
Outpatient pulmonary rehabilitation following acute exacerbations of COPD. Thorax. 2010;65(5):423–8. https://doi.org/10.1136/thx.2009.124164
26
Yohannes
AM
,
Baldwin
RC
,
Connolly
MJ
. Depression and anxiety in elderly patients with chronic obstructive pulmonary disease. Age Ageing. 2006;35(5):457–9. https://doi.org/10.1093/ageing/afl011
27
Baker
EH
,
Janaway
CH
,
Philips
BJ
,
Brennan
AL
,
Baines
DL
,
Wood
DM
, et al.
Hyperglycaemia is associated with poor outcomes in patients admitted to hospital with acute exacerbations of chronic obstructive pulmonary disease. Thorax. 2006;61(4):284–9. https://doi.org/10.1136/thx.2005.051029
28
Leuppi
JD
,
Schuetz
P
,
Bingisser
R
,
Bodmer
M
,
Briel
M
,
Drescher
T
, et al.
Short-term vs conventional glucocorticoid therapy in acute exacerbations of chronic obstructive pulmonary disease: the REDUCE randomized clinical trial. JAMA. 2013;309(21):2223–31. https://doi.org/10.1001/jama.2013.5023
29
Schuetz
P
,
Leuppi
JD
,
Bingisser
R
,
Bodmer
M
,
Briel
M
,
Drescher
T
, et al.
Prospective analysis of adrenal function in patients with acute exacerbations of COPD: the Reduction in the Use of Corticosteroids in Exacerbated COPD (REDUCE) trial. Eur J Endocrinol. 2015;173(1):19–27. https://doi.org/10.1530/EJE-15-0182
30
Schuetz
P
,
Leuppi
JD
,
Tamm
M
,
Briel
M
,
Bingisser
R
,
Dürring
U
, et al.
Short versus conventional term glucocorticoid therapy in acute exacerbation of chronic obstructive pulmonary disease - the “REDUCE” trial. Swiss Med Wkly. 2010;140:w13109.
31
Evans
AT
,
Husain
S
,
Durairaj
L
,
Sadowski
LS
,
Charles-Damte
M
,
Wang
Y
. Azithromycin for acute bronchitis: a randomised, double-blind, controlled trial. Lancet. 2002;359(9318):1648–54. https://doi.org/10.1016/S0140-6736(02)08597-5
32Kleinbaum DG, Klein M. Survival Analysis. A Self-Learning Text, Third Edition. Springer Series on Statistics for Biology and Health, New York, Springer, 2011.
33
Husebø
GR
,
Bakke
PS
,
Aanerud
M
,
Hardie
JA
,
Ueland
T
,
Grønseth
R
, et al.
Predictors of exacerbations in chronic obstructive pulmonary disease--results from the Bergen COPD cohort study. PLoS One. 2014;9(10):e109721. https://doi.org/10.1371/journal.pone.0109721
34
Gudmundsson
G
,
Gislason
T
,
Janson
C
,
Lindberg
E
,
Hallin
R
,
Ulrik
CS
, et al.
Risk factors for rehospitalisation in COPD: role of health status, anxiety and depression. Eur Respir J. 2005;26(3):414–9. https://doi.org/10.1183/09031936.05.00078504
35
Müllerova
H
,
Maselli
DJ
,
Locantore
N
,
Vestbo
J
,
Hurst
JR
,
Wedzicha
JA
, et al.; ECLIPSE Investigators. Hospitalized exacerbations of COPD: risk factors and outcomes in the ECLIPSE cohort. Chest. 2015;147(4):999–1007. https://doi.org/10.1378/chest.14-0655
36
Garcia-Aymerich
J
,
Monsó
E
,
Marrades
RM
,
Escarrabill
J
,
Félez
MA
,
Sunyer
J
, et al.; EFRAM Investigators. Risk factors for hospitalization for a chronic obstructive pulmonary disease exacerbation. EFRAM study. Am J Respir Crit Care Med. 2001;164(6):1002–7. https://doi.org/10.1164/ajrccm.164.6.2006012
37
Becklake
MR
,
Lalloo
U
. The ‘healthy smoker’: a phenomenon of health selection?
Respiration. 1990;57(3):137–44. https://doi.org/10.1159/000195837
38
Eisner
MD
. Smoking and adult asthma: a healthy smoker effect?
Am J Respir Crit Care Med. 2002;165(11):1566–7, author reply 1566–7. https://doi.org/10.1164/ajrccm.165.11.165112
39
Melzer
AC
,
Feemster
LC
,
Crothers
K
,
Carson
SS
,
Gillespie
SE
,
Henderson
AG
, et al.; COPD Outcomes-based Network for Clinical Effectiveness and Research Translation Consortium. Respiratory and Bronchitic Symptoms Predict Intention to Quit Smoking among Current Smokers with, and at Risk for, Chronic Obstructive Pulmonary Disease. Ann Am Thorac Soc. 2016;13(9):1490–6. https://doi.org/10.1513/AnnalsATS.201601-075OC
40
Troisi
RJ
,
Speizer
FE
,
Rosner
B
,
Trichopoulos
D
,
Willett
WC
. Cigarette smoking and incidence of chronic bronchitis and asthma in women. Chest. 1995;108(6):1557–61. https://doi.org/10.1378/chest.108.6.1557
41
Abu Hussein
N
,
Bridevaux
PO
,
Chhajed
PN
,
Fitting
JW
,
Geiser
T
,
Joos Zellweger
L
, et al.
Factors associated with exacerbation in a general practitioners’-based Swiss chronic obstructive pulmonary disease (COPD) cohort. Eur Respir J. 2014;42(Suppl 57):5102.
42
Chandy
D
,
Aronow
WS
,
Banach
M
. Current perspectives on treatment of hypertensive patients with chronic obstructive pulmonary disease. Integr Blood Press Control. 2013;6:101–9.
43
Lindberg
A
,
Larsson
LG
,
Rönmark
E
,
Lundbäck
B
. Co-morbidity in mild-to-moderate COPD: comparison to normal and restrictive lung function. COPD. 2011;8(6):421–8. https://doi.org/10.3109/15412555.2011.629858
44
Mannino
DM
,
Thorn
D
,
Swensen
A
,
Holguin
F
. Prevalence and outcomes of diabetes, hypertension and cardiovascular disease in COPD. Eur Respir J. 2008;32(4):962–9. https://doi.org/10.1183/09031936.00012408
45
Barnes
PJ
,
Celli
BR
. Systemic manifestations and comorbidities of COPD. Eur Respir J. 2009;33(5):1165–85. https://doi.org/10.1183/09031936.00128008
46
Bahadori
K
,
FitzGerald
JM
,
Levy
RD
,
Fera
T
,
Swiston
J
. Risk factors and outcomes associated with chronic obstructive pulmonary disease exacerbations requiring hospitalization. Can Respir J. 2009;16(4):e43–9. https://doi.org/10.1155/2009/179263
47
Tsimogianni
AM
,
Papiris
SA
,
Stathopoulos
GT
,
Manali
ED
,
Roussos
C
,
Kotanidou
A
. Predictors of outcome after exacerbation of chronic obstructive pulmonary disease. J Gen Intern Med. 2009;24(9):1043–8. https://doi.org/10.1007/s11606-009-1061-2
48
Ospina
MB
,
Mrklas
K
,
Deuchar
L
,
Rowe
BH
,
Leigh
R
,
Bhutani
M
, et al.
A systematic review of the effectiveness of discharge care bundles for patients with COPD. Thorax. 2017;72(1):31–9. https://doi.org/10.1136/thoraxjnl-2016-208820