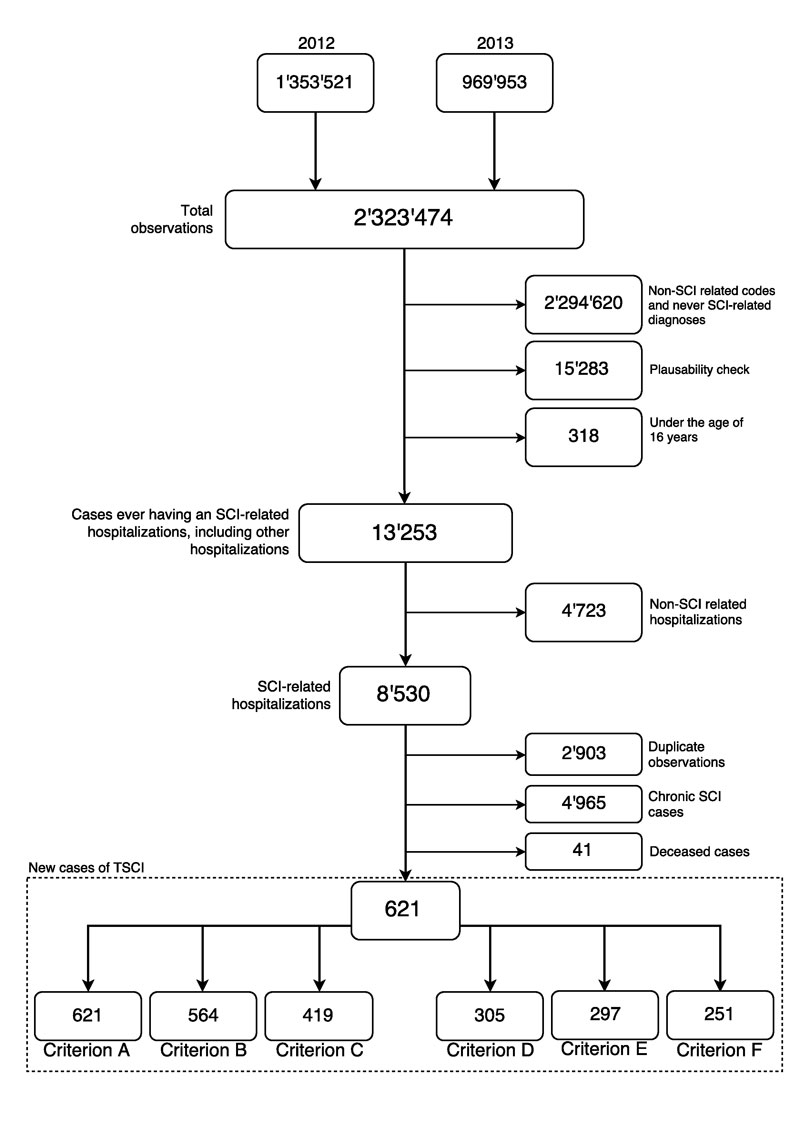
Figure 1 Selection criterion of ICD-10 diagnosis codes.
Flow chart of case identification using hospital administrative data, including case numbers based on selection criteria used.
DOI: https://doi.org/10.4414/smw.2017.14430
Population-based cohort studies are vulnerable to incomplete and biased coverage of the target population. This so-called coverage error can seriously challenge study representativeness and generalisability, and thereby its validity as an evidence base [1, 2]. Quantification of the uncertainty of epidemiological indicators when using population-based cohorts is necessary in order to arrive at sound epidemiological conclusions. Ideally, an operational, full-coverage disease registry would be used to assess coverage error, given its superiority in case identification. However, registries are not always available and are also potentially subject to bias, notably nonparticipation bias [3]. Administrative data are an alternative and valuable resource for quantifying coverage error, given their routine and comprehensive collection [4]. Although they can be somewhat limited in terms of the capacity for disease classification [4], the use of sensitivity analyses, supported by rational classification scenarios, could provide an adequate and efficient method to address issues of uncertainty.
One example of a population-based cohort study is the Swiss Spinal Cord Injury (SwiSCI) cohort study, including a medical records study covering all spinal cord injury (SCI) specialised rehabilitation centres in Switzerland [5]. Albeit rare, spinal cord injuries are a life-threatening condition, with long-lasting neurological implications. In comparison with other neurological conditions, the associated economic costs of SCI are 2 to 20 times higher [6] – the socioeconomic burden on an individual and their community reinforces the importance of primary prevention. In order to help inform national prevention policy, a recent effort was made by Chamberlain et al. to estimate the first reliable and contemporary incidence rates (IRs) of traumatic SCI (TSCI) admitted to specialised rehabilitation in Switzerland, using data collected from the SwiSCI cohort study [7]. Unfortunately, previous studies that have used nationally collected hospital data in countries similar to Switzerland have found a significant proportion of persons with TSCI to be discharged to institutions other than specialised rehabilitation centres [8]. This suggests the potential for coverage error in the SwiSCI cohort study; IRs estimated in this study, given its rehabilitation-based nature, are likely to underestimate the true population risk of TSCI [7].
In Switzerland, electronically collected administrative data on 99% of hospitalisations are available [9]. These data provide an opportunity to estimate the coverage error in Swiss-based cohort studies, namely the absolute coverage error in terms of study representativeness and systematic error caused by selection bias. Therefore, the purpose of our study was to investigate the presence of absolute coverage error and selection bias in the SwiSCI cohort study using administrative data collected by the Swiss Federal Statistical Office (SFSO). The study can further serve as a case in point for a proposed methodology that future Swiss cohort studies could employ to assess their own coverage error.
This study focused on traumatic spinal cord injuries within Switzerland, using data collected in 2012 and 2013. Switzerland recently implemented diagnosis-related group (DRG)-based reimbursement; this has been previously shown to improve coding accuracy. Therefore, this study uses only the most recently available data from the Swiss Federal Statistical Office (SFSO), from after the DRG-based reimbursement implementation.
The Swiss Spinal Cord Injury (SwiSCI) cohort study is an observational, open cohort study that collects data from four rehabilitation centres geographically distributed across Switzerland. This investigates conditions for SCI patients and comprises three data collection pathways, described elsewhere [5]. Both retrospectively and prospectively collected data are included within the SwiSCI study, which is ongoing and includes historical data pre-1960 [5, 7]. The transition to prospective data collection occurred during the course of 2013 at all specialised rehabilitation centres in Switzerland. The persons eligible for SwiSCI are at least 16 years old, residing in Switzerland, with traumatic or non-traumatic SCI aetiology and who received first rehabilitation in one of four specialised rehabilitation centres in Switzerland (REHAB Basel; Swiss Paraplegic Centre; Balgrist University Hospital; Clinique Romande de Réadaption) [5]. The current study included only traumatic cases of SCI collected in 2012 and 2013 of the first phase of SwiSCI, the Medical Records study [5]. The SwiSCI study defines TSCI as SCI caused by one of the following: transport activity, sports or leisure activity, fall, other accident cause, and assault [10].
Data on inpatient hospitalisations were obtained from the SFSO. The SFSO hospital discharge data used in this study cover all Swiss health facilities except for birth clinics and psychological institutions. Data are collected annually, and concern patients who have received medical treatment from healthcare professionals for at least 24 hours or who required an over-night stay [11]. The SFSO data include individual, anonymised, patient identifiers (limiting inclusion of repeat admissions). The international standard International Classification of Diseases (ICD-10-GM: German modification) codes were used to identify new cases of TSCIs. The SFSO dataset contains around 700 variables; this study used the variables age, sex, Swiss national (yes or no), diagnosis, reason for discharge (e.g., hospital/patient decision, death, transfer to other hospital), hospital type and discharge destination. Three (out of the four) SwiSCI-covered specialised rehabilitation centres allowed identification by the SFSO, thereby facilitating comparisons between the observational cohort data and administrative data, as well as facilitating regression analyses on the likelihood of visiting a specialised rehabilitation centre after TSCI.
Data were obtained through the SFSO and approved for use in this study (Reference number: 150399).
Population-based data of permanent residents, stratified by age, sex and year were used as the denominator to calculate incidence rates per one million population (PMP). These data are available from the SFSO and were downloaded from their website. The potential to discriminate between Swiss nationals and non-Swiss within the SFSO dataset was used to include only Swiss nationals in a sensitivity analysis, in order to mimic, to the extent possible, the SwiSCI inclusion criterion (i.e., having a permanent Swiss residence). For calculation of IRs excluding non-Swiss patients (i.e., those without a Swiss passport), alternative data from the SFSO that similarly excludes non-Swiss nationals were used.
For comparison between the data sets, sociodemographic factors (sex and age) and SCI characteristics, including lesion level (paraplegia or tetraplegia), degree (complete or incomplete) of TSCI and segmented levels of lesion (e.g., C1–C4, C5–C8) were used. Paraplegia refers to low lesions; in other words, injury to the thoracic, lumbar or sacral segments of the spinal cord (T1–S5) [12]. Tetraplegia refers to high lesions, or injury to the cervical segment of the spinal cord (C1–C8). The degree of SCI refers to the completeness of lesion. Complete injuries are characterised by having no sensory and motor function in the lowest sacral segments (S4–S5) of the spinal cord, whereas incomplete lesions have some sensory or motor function remaining below the level of the lesion [12]. Both the level and completeness of injury have implications for biological functioning below the level of the lesion, with complete tetraplegia having the most severe effects. Patient characteristics were classified according to the recommended International Spinal Cord Society (ISCoS) categories [10]. TSCI cases were identified by means of ICD-10 codes for damage to the spinal cord at the level of the neck (S.140; S.141), chest (S.240; S.241), and abdominal, lower back and pelvic regions (S.340; S.341; S.343) and non-classified (T.060; T.061; T.093; T.913) (see appendix 1 for a detailed list of codes). Segmented levels of lesion location were obtained from the main and additional diagnoses, and correspond to the 22 separate levels (appendix 1). Lesion severity was inferred from ICD-10 coding as either complete (S14.11, S24.11 and S34.10) or incomplete (S14.12, S14.13, S24.12 and S34.11).
Descriptive analyses and statistical tests were used to evaluate coverage error of the SwiSCI data. We quantified differences in distributions of sociodemographic and SCI-specific characteristics using a two-sample Kolmogorov-Smirnov test (test 1) [13]. In a second Kolmogorov-Smirnov test, we additionally excluded patients from the SFSO data known to have visited a SwiSCI-covered centre (test 2). Third, we further excluded the known SwiSCI-covered clinic that did not allow for identification from the SwiSCI data (test 3). These additional Kolmogorov-Smirnov tests were done in order to ensure independent samples. For Kolmogorov-Smirnov testing, age was used as a continuous variable.
Sensitivity analyses are needed when using administrative data given that previous research, investigating use of administrative data to identify cases of chronic or acute diseases, found administrative data to tend to overestimate cases due to coding inaccuracies [14, 15]. Therefore, various restriction criterion were employed in analyses to account for potential inaccuracies of coding and case identification of TSCIs within SFSO data. These criterion were selected based on evidence from previous research to optimise identification of true cases of TSCI, and also to improve comparability with SwiSCI data [14, 16, 17]. The criterion and their reasoning are as follows (see also table 1):
Table 1 Code selection criteria for sensitivity analyses.
| Criterion | Description |
|---|---|
| A | Including all TSCI-related ICD-10 codes |
| B | Including those codes identified by Hagen et al. [14] to have the highest positive predictive value of identifying cases and true cases of TSCI. |
| C | Criterion B and potentially transient codes |
| D | Criterion C and non-Swiss cases |
| E | Including only those cases with a TSCI-related ICD-10 code as the main diagnosis |
| F | Criterion E and including only those cases with a TSCI-related ICD-10 code as the main diagnosis |
ICD-10 = International Classification of Diseases, tenth edition; TSCI = traumatic spinal cord injury
Other potential coding inaccuracies associated with this administrative data source and related sensitivity analyses are detailed in appendix 4.
We performed three logistic regression analyses to evaluate predictors of attendance to specialised rehabilitation (yes or no). The first model included only those sociodemographic variables and variables with limited risk of non-differential misclassification: age, sex, and year of TSCI. The second model additionally included lesion level (paraplegia or tetraplegia), given that this variable is considered to be at risk for non-differential misclassification due to coding inconsistencies within patient records (see appendix 2). In the third model, a variable further specifying the segmented levels of lesion (e.g., C1–C4, C5–C8) was included as a further specification of the broader groups of lesion level (i.e., paraplegia or tetraplegia). Post-hoc analysis using Bonferroni testing was used to detect differences between multi-level groupings. Completeness of lesion was not included as an independent variable given the large amount of missing information and associated concerns regarding information bias and unmeasured confounding (see appendix 3). As more than 20% of information regarding completeness of lesion and level of TSCI in SFSO data was missing, no form of imputation was performed to estimate these missing values. All regressions used patients identified using criterion B to improve inclusion of only those with a true TSCI.
Age- and sex-specific incidence rates (IRs) per one million population were calculated with use of the Swiss population data for the years 2012 and 2013 stratified by age and sex [10]. Given that TSCI is a relatively rare event and presumably independent of other new cases, Poisson regression was used to estimate annual incidence rates per million population including an interaction term between age and sex [18]. Incidence rates reported by lesion level reflect stratified rates adjusted for the underlying age and sex population structure. Inverse probability weighting was used to account for missing data of lesion level in incidence rate calculations. Incidence rates were calculated for the SFSO data using various restriction criteria for case identification in order to provide a possible range within which the “true” incidence is included.
All data management and analyses were performed using STATA Version 14.2 for Windows.
A flow chart showing the number of patients retained in each step is shown in figure 1. The SFSO data initially included 2 323 474 hospitalisations (1 353 521 in 2012; 969 953 in 2013), including multiple hospitalisations for individual patients; excluding non-SCI related hospitalisations, 8530 observations were left (fig. 1). After exclusion of duplicate patient IDs, chronic SCIs and deaths, 621 cases remained (criterion A). Of these 621 cases, 6.8% (n = 42) were coded at one time as having a transient lesion and at another time as having a nontransient lesion; about 40% of nontransient lesions were first coded as transient. The number of included incident cases of TSCI varied according to the criterion applied, with criterion B including 564 incident TSCI cases, criterion C 419 cases, criterion D 305 cases, criterion E 297 cases and criterion F 251 cases (fig. 1).
Figure 1 Selection criterion of ICD-10 diagnosis codes.
Flow chart of case identification using hospital administrative data, including case numbers based on selection criteria used.
Comparisons between SwiSCI data and the SFSO data revealed no differences when including all cases identified using criterion A and known SwiSCI-covered centres (table 2, test 1). This pattern remained when only cases identified with criterion B were used. When known SwiSCI-covered specialised rehabilitation centres were excluded, the proportion of paraplegia, level of lesion and completeness of lesion remained similar across SFSO and SwiSCI datasets (fig. 2; table 2). However, notable differences between the two datasets were observed for gender and age at TSCI, with the SwiSCI study including a smaller proportion of women and individuals with a younger age at time of TSCI (fig. 2; table 2). Furthermore, exclusion of known SwiSCI-covered centres caused the average age of the SFSO population to increase slightly from 52.5 years of age to 55.6 years (p = 0.003) (table 2, test 2). There was further a tendency for SwiSCI data to include a greater proportion of complete injuries (fig. 2; table 2).
Table 2 Characteristics of the SFSO data and SwiSCI data.
| Characteristic |
Criterion A
n (%) |
Criterion B
n (%) |
SwiSCI Medical Records Study
n (%) |
Test 1* | Test 2† | Test 3‡ |
|---|---|---|---|---|---|---|
| Gender | 0.43 | 0.06 | 0.04 | |||
| Female | 188 (30.3) | 168 (29.8) | 50 (23.4) | |||
| Male | 433 (69.7) | 396 (70.2) | 163 (76.2) | |||
| Age group | 0.34 | <0.01 | <0.01 | |||
| 16–30 years | 121 (19.5) | 105 (18.6) | 47 (22.0) | |||
| 31–45 years | 112 (18.0) | 101 (17.9) | 40 (18.7) | |||
| 46–60 years | 162 (26.1) | 150 (26.6) | 55 (25.7) | |||
| 61–75 years | 142 (22.9) | 133 (23.6) | 52 (24.3) | |||
| 76 years and older | 84 (13.5) | 75 (13.3) | 20 (9.4) | |||
| Lesion level | 0.51 | 0.31 | 0.27 | |||
| Paraplegia | 332 (58.1) | 303 (56.6) | 109 (51.7) | |||
| Tetraplegia | 239 (41.9) | 232 (43.4) | 102 (48.3) | |||
| Missing | 50 | 29 | 3 | |||
| Completeness of lesion | 0.97 | 0.07 | 0.06 | |||
| Incomplete | 106 (69.3) | 103 (68.7) | 135 (64.9) | |||
| Complete | 47 (30.7) | 47 (31.3) | 73 (35.1) | |||
| Missing | 499 | 445 | 6 | |||
| Segmented lesion level | 1.00 | 0.24 | 0.44 | |||
| C1–C4 | 67 (20.4) | 66 (20.8) | 35 (17.8) | |||
| C5–C8 | 90 (27.4) | 88 (27.7) | 57 (28.9) | |||
| T1–T12 | 107 (32.5) | 106 (33.3) | 72 (36.6) | |||
| L1–S5 | 65 (19.8) | 58 (18.2) | 33 (16.8) | |||
| Missing | 303 | 257 | 17 |
SFSO = Swiss Federal Statistical Office; SwiSCI = Swiss Spinal Cord Injury cohort study Tests are unadjusted for other variables. Missing values not included within calculations of percentages (%). * Test 1: including SFSO data identified using criterion A † Test 2: including SFSO data identified using criterion A; excluding known SwiSCI clinics from the SFSO data ‡ Test 3: including SFSO data identified using criterion A; Excluding known SwiSCI clinics from the SFSO data; and excluding from the SwiSCI dataset, the one SwiSCI clinic that did not allow for identification within the SFSO data
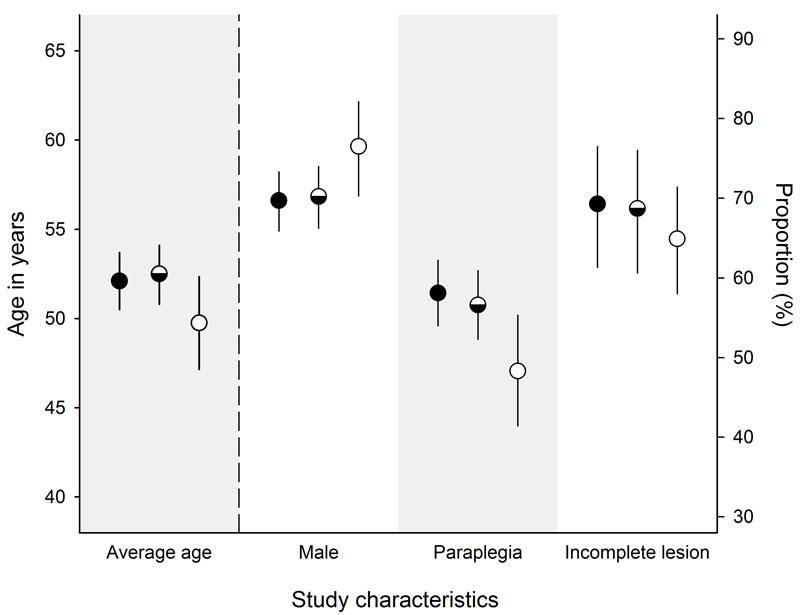
Figure 2 Population-average estimates with 95% confidence intervals of study characteristics.
The axis on the left, age in years, corresponds only to the first category: average age. The axis on the right corresponds to the categories: male, paraplegia and incomplete lesion. Circles filled in completely indicate cases identified using criterion A. Half-filled circles indicate cases identified using criterion B. Open circles indicate cases identified in the SwiSCI cohort.
The overall incidence rate including cases identified using selection criterion A was 49.7 per million population (pmp) (95% CI 45.4–54.0) (fig. 3), and 54.3 pmp (95% CI 49.8–58.9) when including those persons that died in the hospital. IRs decreased slightly when criterion B was used, to 45.1 pmp (95% CI 41.0–49.1) (fig. 3). Further reductions were observed with criterion C (IR 33.6 pmp, 95% CI 30.0–37.1), criterion E (IR 23.5 pmp, 95% CI 20.6–26.4), and criterion F (IR 19.9 pmp, 95% CI 17.2–22.6) (fig. 3). IRs were slightly higher when the non-Swiss population was additionally excluded (criterion D as compared to criterion C) (IR 35.9 pmp, 95% CI 31.5-40.3) (fig. 3).
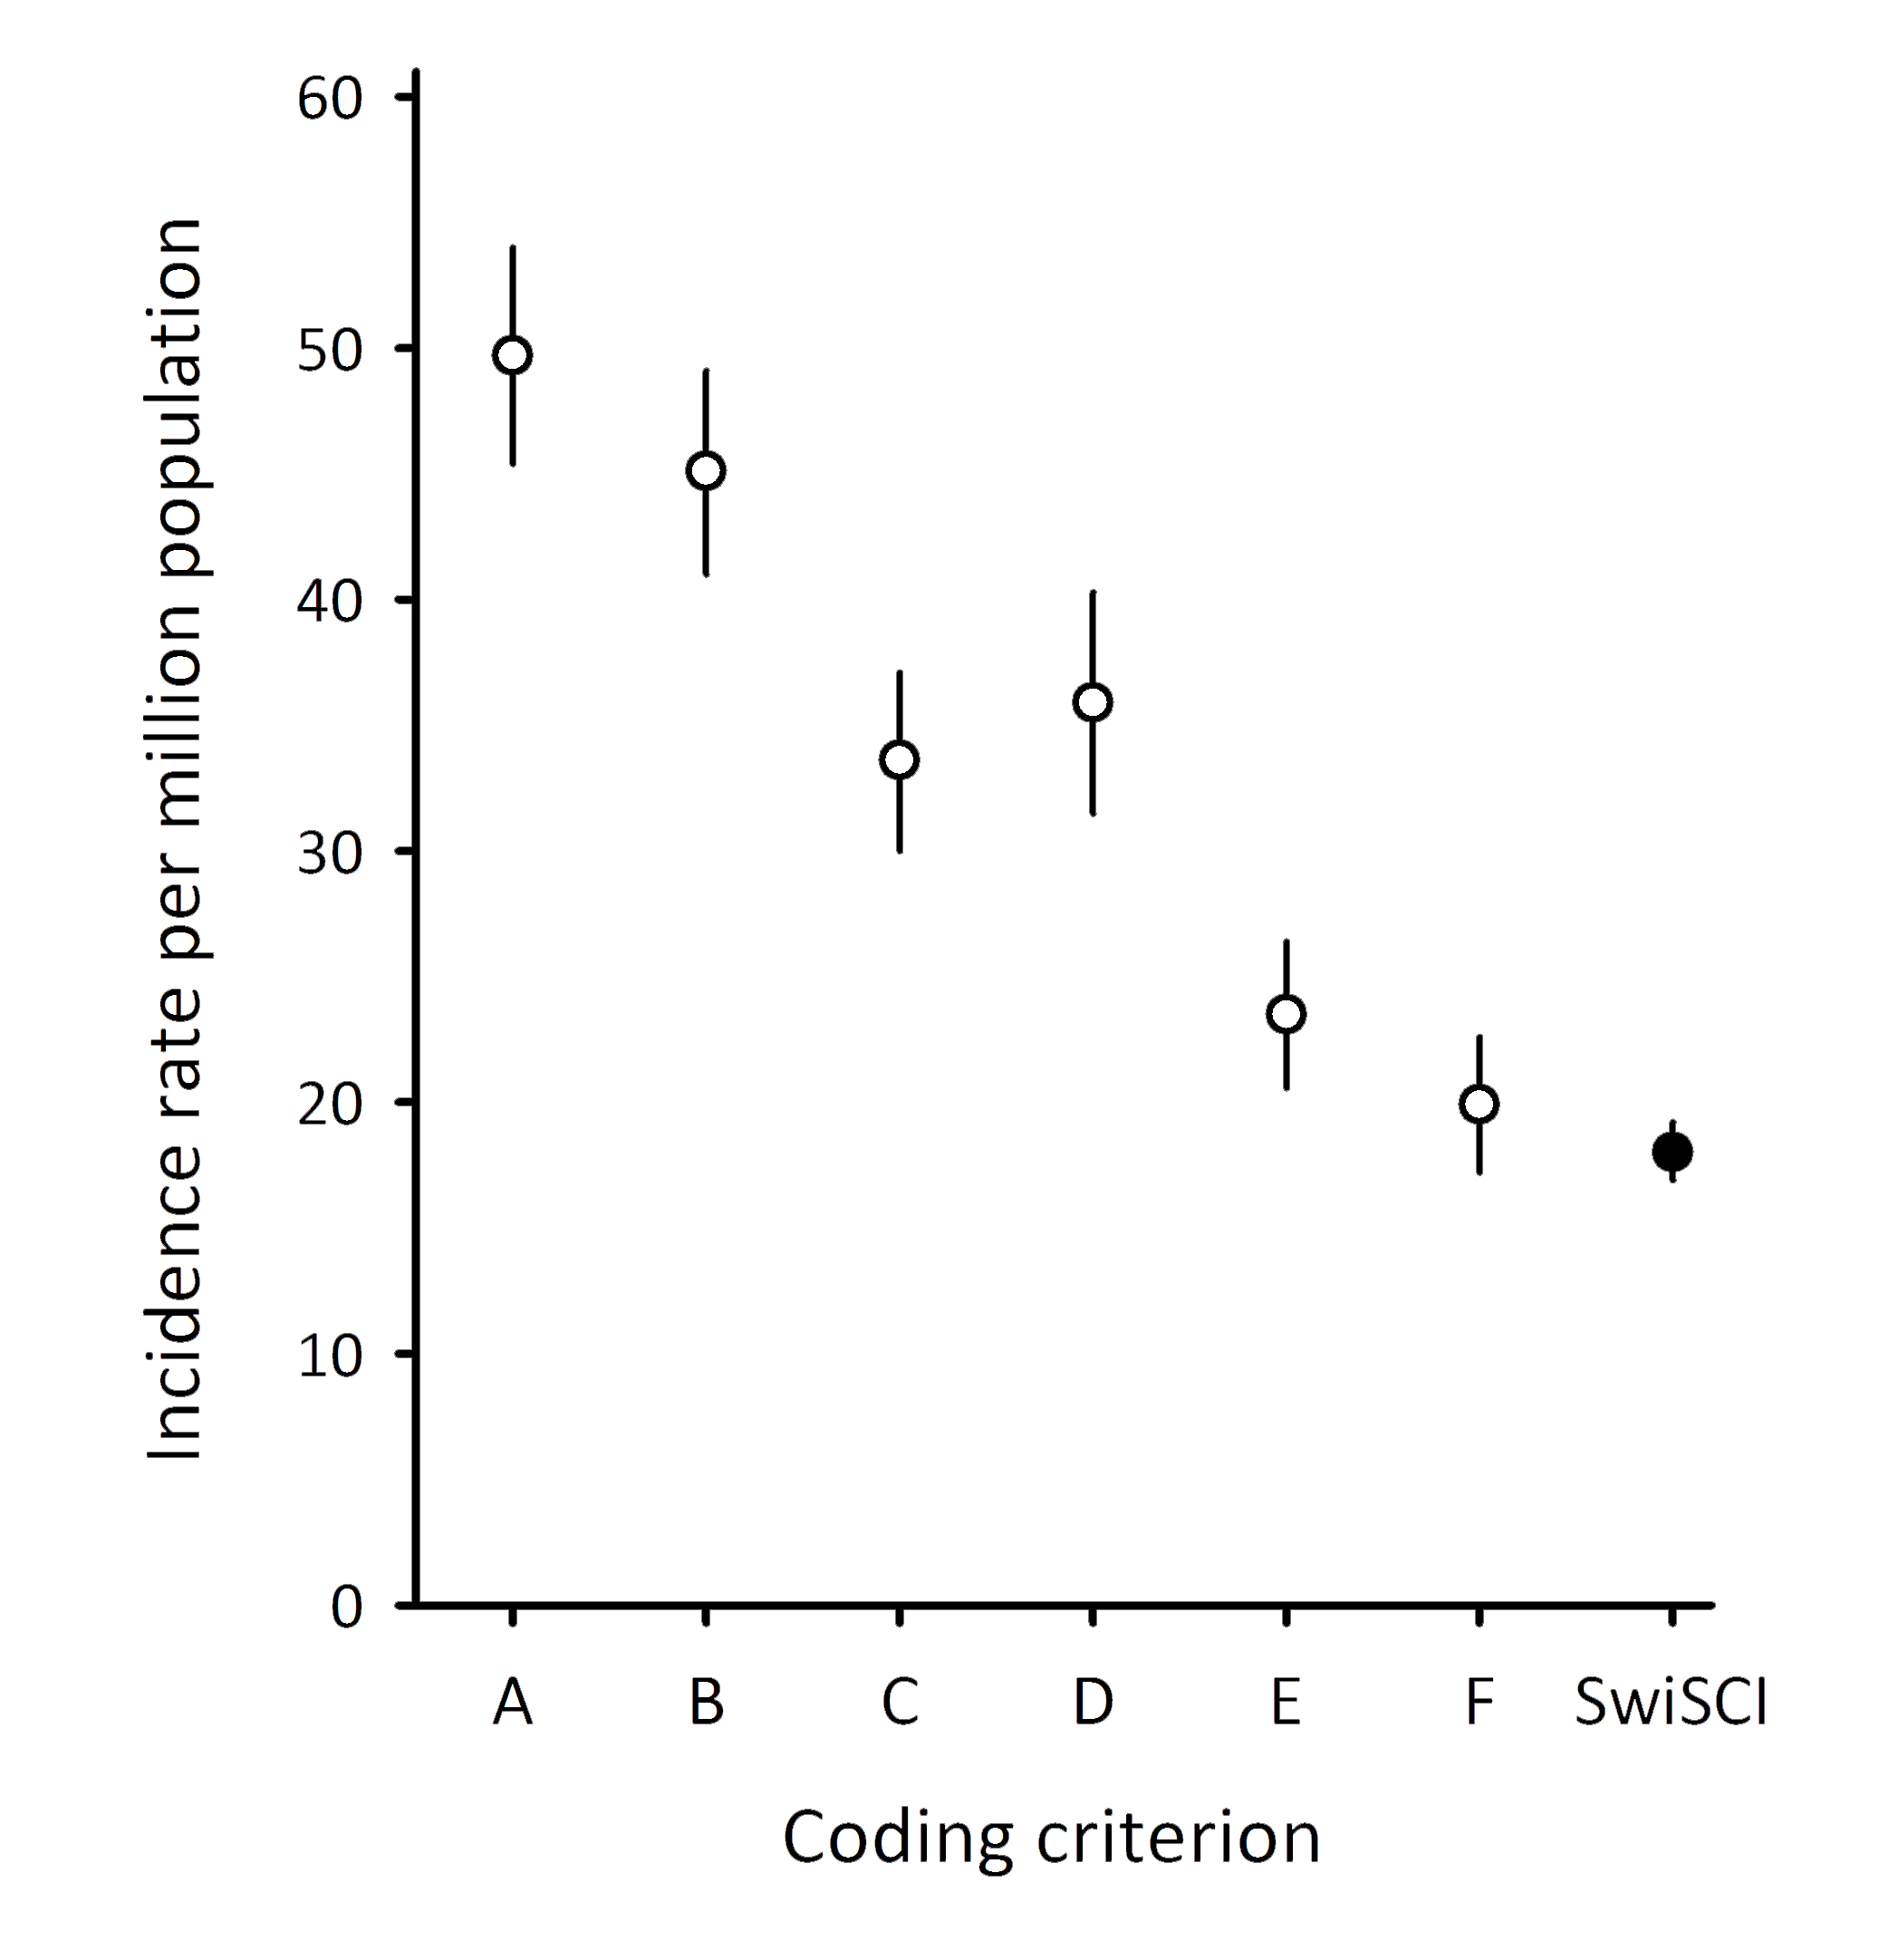
Figure 3 Overall annual incidence rate estimates including 95% confidence intervals.
The incidence rate point estimate is indicated by a circle; the filled-in circle is the estimated incidence rate in the paper by Chamberlain et al. [7], which used the rehabilitation-based SwiSCI data to estimate the incidence rate. Error bars represent the 95% confidence interval.
Incidence rate patterns for sociodemographic and SCI-specific characteristics remained relatively stable across each selection criterion (table 3). The IRs for men remained higher in comparison with that of women. Analysis using only cases identified with criterion B gave an IR for women of 29.8 pmp (95% CI 24.8–34.8) while for men it was more than twice as high at 60.3 pmp (95% CI 53.8–66.8) (table 3). Across all age groups, IRs were highest for older ages (76 years and older). For example, estimates of incidence rates using selection criterion B were 34.9 pmp (95% CI 28.2–41.5) for 16 to 30 year olds, 28.9 pmp (95% CI 23.2–34.5) for 31 to 45 year olds, 42.6 pmp (95% CI 35.8–49.4) for 46 to 60 year olds, 56.6 pmp (95% CI 46.9–66.2) for 61 to 75 year olds and 62.4 pmp (95% CI 48.376.5) for those 76 years and older (table 3).
Table 3 Annually estimated incidence rates per million population using administrative data, according to case identification criteria.
| Criterion A | Criterion B | Criterion C | Criterion D | Criterion E | Criterion F | |
|---|---|---|---|---|---|---|
| Sex | ||||||
| Female | 33.5 (28.2–38.8) |
29.8 (24.8–34.8) |
22.44 (18.1–26.8) |
23.5 (18.7–28.2) |
15.2 (11.6–18.8) |
12.5 (9.2–15.7) |
| Male | 65.8 (59.1–72.6) |
60.3 (53.8–66.8) |
44.72 (39.1–50.3) |
48.3 (40.9–55.8) |
31.8 (27.2–36.4) |
27.3 (23.0–31.6) |
| Age group | ||||||
| 16–30 years | 40.2 (33.0–47.4) |
34.9 (28.2–41.5) |
24.9 (19.3–30.6) |
19.5 (13.7–25.4) |
20.3 (15.2–25.3) |
17.3 (12.6–22.0) |
| 31–45 years | 32.0 (26.1–37.9) |
28.9 (23.2–34.5) |
23.4 (18.4–28.5) |
25.4 (18.5–32.2) |
15.7 (11.6–19.9) |
13.4 (9.6–17.3) |
| 46–60 years | 46.0 (38.9–53.1) |
42.6 (35.8–49.4) |
31.8 (25.9–37.7) |
35.0 (27.5–42.6) |
21.6 (16.7–26.4) |
17.9 (13.5–22.3) |
| 61–75 years | 60.4 (50.4–70.3) |
56.6 (46.9–66.2) |
38.7 (30.7–46.6) |
42.0 (32.4–51.5) |
28.4 (21.6–35.2) |
24.2 (17.9–30.5) |
| 76 years and older | 69.8 (54.9–84.8) |
62.4 (48.3–76.5) |
49.1 (36.6–61.6) |
57.7 (41.6–73.7) |
31.6 (21.5–41.6) |
26.6 (17.4–35.8) |
| Lesion characteristics* | ||||||
| Tetraplegia | 20.7 (18.1–23.4) |
20.1 (17.5–22.7) |
11.3 (9.4–13.3) |
13.3 (10.6–16.0) |
13.1 (11.0–15.2) |
12.1 (10.1–14.2) |
| Paraplegia | 28.9 (25.8–32.1) |
26.4 (23.4–29.4) |
22.8 (19.9–25.6) |
26.4 (22.6–30.2) |
11.9 (9.9–13.9) |
10.0 (8.2–11.8) |
All estimates are stratified according to age, sex and year of TSCI; Letters relate to overall incidence rates displayed in figure 2. * IRs stratified by lesion characteristics and adjusted for underlying population distributions of age and sex.
Regardless of the model used, the youngest group (age 16–30 years), and persons with the highest lesion levels (C1–C4) were more likely to have visited a specialised rehabilitation centre. For example, with selection criterion B, model three, persons aged 76 years or older were nearly six times less likely to have visited a specialised rehabilitation centrr as compared with those between 16 and 30 years of age (odds ratio [OR] 0.13, 95% CI 0.05–0.33) (table 4). Post-hoc testing found that the groups including individuals aged between 61 and 75 years and individuals older than 75 years were significantly different from the youngest age group (table 4). Similarly, persons with the lowest lesion level (L1–S5) were more than four times less likely to visit a specialised rehabilitation centre as compared with those with a high cervical lesion (C1–C4) (OR 0.21, 95% CI 0.09-0.50) (table 4). In the base model and model two, men were more likely to visit specialised rehabilitation, but this relationship became nonsignificant when segmented level of lesion was additionally included in the model (table 4). Similarly, persons with an incident TSCI occurring in 2013 were less likely to visit specialised rehabilitation (as compared with 2012) in the base model and model two, but this relationship also became non-significant upon inclusion of segmented level of lesion (table 4). When cases identified with selection criterion A were included, these relationships did not change, but were slightly weaker.
Table 4 Logistic regression of characteristics associated with discharge to a specialised rehabilitation facility.
| Criterion B | ||||||
|---|---|---|---|---|---|---|
| Base Model (n = 564) | Model 2 (n = 535) | Model 3 (n = 317) | ||||
| Odds ratio (95% CI) |
p-value | Odds ratio (95% CI) |
p-value | Odds ratio (95% CI) |
p-value | |
| Sex | 0.01 | 0.03 | 0.15 | |||
| Female | 1.00 | 1.00 | 1.00 | |||
| Male | 1.75 (1.13–2.71) |
1.62 (1.03–2.55) |
1.53 (0.85–2.73) |
|||
| Age group | <0.001 | <0.001 | <0.001 | |||
| 16–30 years | 1.00a | 1.00a | 1.00a | |||
| 31–45 years | 0.53 (0.30–0.94)a |
0.54 (0.30–0.98)a |
0.39 (0.18–0.85)a |
|||
| 46–60 years | 0.59 (.035–0.99)a |
0.57 (0.34–0.97)a |
0.59 (0.29–1.21)a |
|||
| 61–75 years | 0.29 (0.17–0.52)b |
0.27 (0.15–0.49)b |
0.23 (0.11–0.49)b |
|||
| ≥76 years | 0.16 (0.07–0.36)b |
0.15 (0.07–0.34)b |
0.13 (0.05–0.33)b |
|||
| Year of TSCI | 0.02 | 0.03 | 0.18 | |||
| 2012 | 1.00 | 1.00 | 1.00 | |||
| 2013 | 0.64 (0.44–0.94) |
0.65 (0.44–0.96) |
0.72 (0.44–1.17) |
|||
| Lesion Level | 0.24 | |||||
| Tetraplegia | – | 1.00 | – | |||
| Paraplegia | – | 0.79 (0.53–1.17) |
– | |||
| Segmented lesion level | <0.001 | |||||
| C1–C4 | – | – | 1.00a | |||
| C5–C8 | – | – | 0.69 (0.35–1.37)a |
|||
| T1–T12 | – | – | 1.05 (0.53–2.09)a |
|||
| L1–S5 | – | – | 0.21 (0.09–0.50)b |
|||
TSCI = traumatic spinal cord injury Superscripts indicate different groupings based on significant results from post-hoc testing of group level differences using the Bonferroni adjustment.
Using routinely collected administrative data, this study found a coverage error in the SwiSCI cohort study both in absolute terms and in relation to selection bias. Comparisons between the distributions of study characteristics of the administrative and cohort data demonstrated notable differences with respect to age, gender and, tentatively, completeness of lesion. The overall estimated incidence rate of TSCI ranged between 19.9 and 49.7 pmp. Higher IRs were observed for males, the elderly and paraplegia. However, regression analyses found people of male sex, younger age, and higher lesion level to be more likely to visit a specialised rehabilitation centre. Together, these results suggest a likely coverage error in the SwiSCI Medical Records study.
This study quantified the absolute coverage error in the SwiSCI cohort study, which affects the estimation of the overall IR of TSCI in Switzerland when using only data from the SwiSCI Medical Records study. For Switzerland between 2005 and 2009, the rehabilitation-based IR was 18 pmp [7]. This study estimated an IR of nearly 50 pmp with use of the least restrictive criterion, and 20 pmp with the most restrictive criterion. Regardless of the criterion used, the previous SwiSCI rehabilitation-based IR point estimate is not included within the range of IRs estimated from SFSO data; this suggests the presence of coverage error in the SwiSCI study in absolute terms. Comparisons with similar studies that identified TSCI cases using ICD-coded administrative data show that the IR estimates of this study are within the range of reported estimates [8, 19, 20]. A recent study in the Netherlands that assessed ICD-10 coding accuracy for case identification found that roughly 50% of patients identified using ICD-10 coding corresponded to a true case of TSCI [8]. Assuming that the present study includes coding inaccuracies similar to those observed in the Netherlands, this would suggest an IR of roughly 25 pmp in Switzerland. Results from previous studies with comparable methodology (criterion E) gave similar estimates [21]. However, in order to substantiate this estimate scenario a follow-up study is needed in which the medical charts of all potential TSCI cases identified by ICD-10 coding are reviewed by medical professionals experienced in SCI diagnosis and care [8, 14].
As well as an absolute coverage error, this study observed evidence of selection bias within SwiSCI as key groups – including women, the elderly and those with very low lesions (L1-S5) – appear to be underrepresented. Such discharge patterns have been reflected in previous studies [8, 22]. The observed discharge patterns could be partially due to rehabilitation policy to preferentially provide specialised rehabilitation to individuals with a high capacity to regain functioning, particularly to return to work. Both age and severity of injury have been found to influence return to work [23]. Specialised rehabilitation uses an interdisciplinary approach, notably including occupational therapists who aid in work reintegration or re-education to promote labour market participation. Therefore, individuals with a higher perceived likelihood to return to work may be more likely to attend specialised rehabilitation [24].
The selection bias identified in SwiSCI could affect future cohort-based estimates of functioning and other health outcomes that vary according to age, gender and severity of lesion [25]. This consequence has been demonstrated in previous studies comparing population-based cohorts with hospital-based cohorts in order to determine the effect of selection bias on risk of mortality and life expectancy, such as in the case of strokes [2, 26]. Given the potential repercussions of selection bias in cohort studies, it is imperative to identify and understand the cause of such biases to prevent erroneous conclusions.
It is also important to evaluate the effect of selection bias on epidemiological indicators in the light of potential inequity in access to optimal health. An understanding of the capacity of specialised rehabilitation to serve as a secondary form of prevention (i.e., to further reduce complications, prevent premature mortality, and so on) is key to informing future health interventions. The interdisciplinary approach in specialised rehabilitation centres allows for improved management of spinal cord injuries, aimed at reducing complications and facilitating rehabilitation and community integration [27]. Furthermore, extant literature indicates the capacity of specialised rehabilitation to improve mortality outcomes, reduce length of stay, improve neurological recovery and reduce morbidities (e.g., pressure ulcers, respiratory complications) [28–30]. To understand the extent to which selection bias of discharge to a specialised rehabilitation centre can affect health outcomes, contemporary studies in SCI that firmly delineate the benefits of specialised rehabilitation over nonspecialised care or general rehabilitation are needed. Furthermore, to understand interactions for secondary prevention, future studies need to take into account the potential influence of sociodemographic and SCI-specific characteristics that could influence admission to specialised rehabilitation.
In Switzerland, administrative data has previously been used to identify spinal cord injuries and other trauma-related events [31, 32], as well as ambulatory care-sensitive conditions (e.g., influenza, asthma, diabetes) [33]. However, this is the first study – to our knowledge – that compared a Swiss cohort study with administration-based population statistics in order to understand and quantify the true representativeness of a study. The SwiSCI study covered all SCI specialised rehabilitation clinics in Switzerland, and thus provided accurate and reliable specialised rehabilitation-based epidemiological indicators (e.g., IR) for comparisons. One of the strengths of the use of the hospital discharge data collected by the SFSO is that it is nationally representative, covering nearly 98% of admitted cases in 99% of Swiss hospitals [9]. Within this dataset each patient has a unique, non-identifiable, identification number that allows for tracking across 2-year periods and thus removal of duplicate IDs within each 2-year subset. From this dataset, the present study also used data coded with the ICD-10, which previous research has found to be superior to older ICD versions [34]. In addition, this study used data collected after the introduction of DRG-based reimbursement in Switzerland, which probably improved coding accuracy [34], admission to rehabilitation and, potentially, care received [35]. Finally, a major strength of this study is the use of selection criteria informed by previous studies and literature that serve as sensitivity analyses and that, therefore, provide a range to help specify the level of uncertainty in the data used.
Although the use of nationally representative administrative data is a strength of this study, it is also a limitation, given potential coding inaccuracies of this data source. The impact of these inaccuracies is difficult to predict, but could potentially lead to inaccurate estimates of the overall incidence or number of complete lesions. A previous Norwegian study found that, out of 1080 patients identified as having a potential TSCI (defined using ICD coding), only 24% really had a TSCI; however, this study included a mixture of ICD-8, ICD-9 and ICD-10 coding [14]. In a Canadian study [15], although the positive predictive value of using ICD-10 coding was found to be superior than that reported by the Norwegian study [14], it was found that incomplete lumbar and thoracic spinal cord injuries were often miscoded as being complete, and that 10.9% of true TSCIs were missed using only administrative data. Another limitation of the present study is the identification of lesion level of TSCI using ICD-10 coding. Accurate assessments of the level and severity of a spinal cord injury require use of the American Spinal Injury Association (ASIA) Impairment Scale (AIS), which is co-dependent on completeness of lesion. Determination of an AIS score involves a detailed assessment of motor and sensory impairment and is therefore a time consuming, labour-intensive and costly process requiring specialist training [12, 36]. Evidence from a previous SwiSCI study show that a substantial portion of the reported lesion levels were not assessed with the AIS, as nearly 60% of persons admitted to first rehabilitation did not have a neurological examination during acute care [5]. Finally, given the limited data, it was not possible to investigate the interplay between lesion level and age within the present study; such interplay was observed in previous studies [7].
Using hospital-based administrative discharge data, this study found absolute coverage error and selection bias in a Swiss-based cohort study including SCI-specialised rehabilitation centres in Switzerland. Administrative data are routinely collected in many high-resource countries and offer a wealth of information related to health. Therefore, regardless of limitations, administrative data remain a valuable resource for future epidemiological studies. In order to address some limitations associated with using administrative-based data sources, a follow-up study that assesses the accuracy of ICD-10 coding within Switzerland to identify cases using ICD-coded data – similar to those performed in Norway and the Netherlands – could provide a concrete understanding of coding discrepancies [8, 14]. Results from this study can help inform future SwiSCI-based studies aiming to reliably estimate nationally representative epidemiological indicators while accounting for coverage bias of the target population as part of sensitivity analyses.
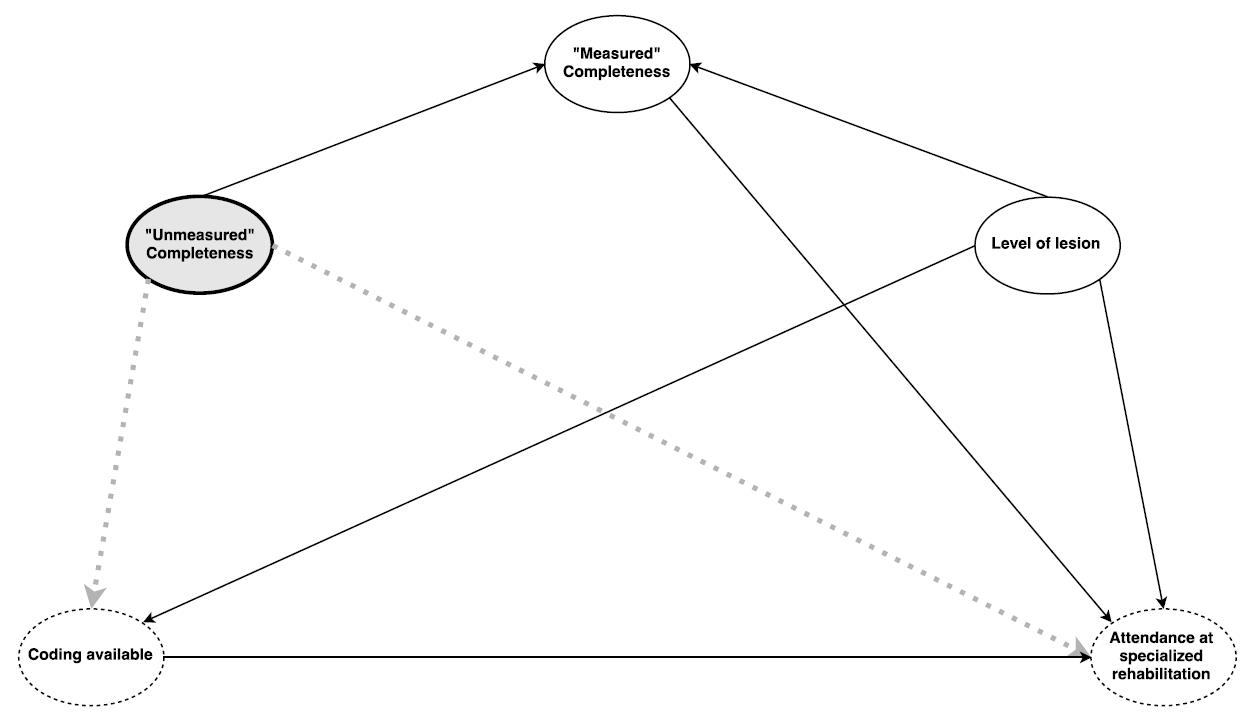
Figure S1 Directed acyclic graph of potential risk for unmeasured confounder.
The dashed circle, “Coding available”, indicates TSCI cases identified with available coding. The dashed circle inscribed with “Attendance at specialised rehabilitation” indicates the outcome, admittance to specialised rehabilitation. Unshaded, non-dashed circles indicate available variables, for which adjusting or inclusion in the model is possible (i.e., level of lesion and “measured” completeness). The bolded, grey-shaded circle indicates an unmeasured confounder (“unmeasured” completeness). Dashed lines indicate the confounded pathways to the exposure and outcome of interest.
Table S1 Spinal cord injury-related ICD-10 codes including description.
| ICD-10 code | Label/level | Lesion type | Type of SCI |
|---|---|---|---|
| S.140 | Concussion and oedema of the cervical spinal cord | Tetraplegia | Traumatic |
| S.141 | Traumatic injury to the cervical spinal cord, other and unspecified | Tetraplegia | Traumatic |
| S.1471 | Cervical vertebra: C1 | Tetraplegia | Traumatic |
| S.1472 | Cervical vertebra: C2 | Tetraplegia | Traumatic |
| S.1473 | Cervical vertebra: C3 | Tetraplegia | Traumatic |
| S.1474 | Cervical vertebra: C4 | Tetraplegia | Traumatic |
| S.1475 | Cervical vertebra: C5 | Tetraplegia | Traumatic |
| S.1476 | Cervical vertebra: C6 | Tetraplegia | Traumatic |
| S.1477 | Cervical vertebra: C7 | Tetraplegia | Traumatic |
| S.1478 | Cervical vertebra: C8 | Tetraplegia | Traumatic |
| S.240 | Concussion and oedema of the thoracic spinal cord | Paraplegia | Traumatic |
| S.241 | Traumatic injury to the thoracic spinal cord, other and unspecified | Paraplegia | Traumatic |
| S.2471 | Thoracic vertebra: T1 | Paraplegia | Traumatic |
| S.2472 | Thoracic vertebrae: T2/T3 | Paraplegia | Traumatic |
| S.2473 | Thoracic vertebrae: T4/T5 | Paraplegia | Traumatic |
| S.2474 | Thoracic vertebrae: T6/T7 | Paraplegia | Traumatic |
| S.2475 | Thoracic vertebrae: T8/T9 | Paraplegia | Traumatic |
| S.2476 | Thoracic vertebrae: T10/T11 | Paraplegia | Traumatic |
| S.2477 | Thoracic vertebra:T12 | Paraplegia | Traumatic |
| S.340 | Concussion and oedema of the lumbar spinal cord | Paraplegia | Traumatic |
| S.341 | Traumatic injury to the lumbar cord, other and unspecified | Paraplegia | Traumatic |
| S.343 | Injury of the cauda equina | Paraplegia | Traumatic |
| S.3471 | Lumbar vertebra: L1 | Paraplegia | Traumatic |
| S.3472 | Lumbar vertebra: L2 | Paraplegia | Traumatic |
| S.3473 | Lumbar vertebra: L3 | Paraplegia | Traumatic |
| S.3474 | Lumbar vertebra: L4 | Paraplegia | Traumatic |
| S.3475 | Lumbar vertebra: L5 | Paraplegia | Traumatic |
| S.3476 | Sacral vertebra: S1 | Paraplegia | Traumatic |
| S.3477 | Sacral vertebrae: S2–S5 | Paraplegia | Traumatic |
| T.060 | Injury to the brain and cranial nerves with injures of nerves and spinal cord at neck level | Tetraplegia | Traumatic |
| T.061 | Injury of nerves and spinal cord involving multiple body regions | Unspecified | Traumatic |
| T.093 | Injury of the spinal cord, level unspecified | Unspecified | Traumatic |
| T.913 | Sequelae of injuries, of poisoning and of other consequences of external causes – sequelae of injuries of neck and trunk – sequelae of injury of spinal cord | Unspecified | Traumatic |
| G82.0- | Flaccid paraplegia | Paraplegia | Chronic |
| G82.1- | Spastic paraplegia | Paraplegia | Chronic |
| G82.2- | Paraplegia, unspecified | Paraplegia | Chronic |
| G82.3 | Flaccid tetraplegia | Tetraplegia | Chronic |
| G82.4 | Spastic tetraplegia | Tetraplegia | Chronic |
| G82.5 | Tetraplegia, unspecified | Tetraplegia | Chronic |
| G8260 | Cervical vertebrae: C1–C3 | Tetraplegia | Chronic |
| G8261 | Cervical vertebrae: C4–C5 | Tetraplegia | Chronic |
| G8262 | Cervical vertebrae: C6–C8 | Tetraplegia | Chronic |
| G8263 | Thoracic vertebrae: T1–T6 | Paraplegia | Chronic |
| G8264 | Thoracic vertebrae: T7–T10 | Paraplegia | Chronic |
| G8265 | Thoracic vertebrae: T11–L1 | Paraplegia | Chronic |
| G8266 | Lumbar vertebrae: L2–S1 | Paraplegia | Chronic |
| G8267 | Sacral vertebrae: S1–S5 | Paraplegia | Chronic |
| SCI = spinal cord injury | |||
The directed acyclic graph (DAG) shows potential risk for an unmeasured confounder (fig. S1) [37]. The assumption portrayed within this DAG is that completeness of lesion among cases without information on completeness of lesion is related to availability of coding, as well as attendance to specialised rehabilitation. For example, individuals with an incomplete lesion are less likely to have information on lesion completeness within the administrative dataset, but this is also related to whether or not the individual is admitted to specialised rehabilitation.
Within the administrative database, each patient has a unique patient ID. Therefore, it is possible to remove duplicate patient hospitalisations. It can be the case that an individual is recorded as having an incident TSCI in multiple years (due to erroneous coding in the succeeding year), resulting in an overestimation of incidence rates. However, by using data from the year preceding the year of interest, it is possible to identify erroneously coded incident cases (given the unique patient ID) and omit them from analyses (demonstrated in the figure below).
In the data used in the present study (i.e., based on the linked data between 2012 and 2013) we identified 41 duplicate cases for 2013, coded as having a new SCI, which were also coded as having a new SCI in 2012. The duplicate 2013 cases were excluded from the analysis, but due to the absence of data from the preceding year (i.e., 2011), a similar procedure was not feasible for 2012.
We performed a sensitivity analysis to determine the impact of erroneously coded incident cases from 2012 on the regression results. To achieve this, we used regression modelling on data from 2013 to derive propensity scores for erroneous coding in relation to prediction variables, including: type of admission (e.g., internal transfer), age, sex, primary visit length of stay, type of SCI (paraplegia or tetraplegia) and rehabilitation (yes, no). We then applied the propensity score model to 2012 data in order to derive propensity scores for erroneous coding in 2012. Corresponding to the error rate observed in 2013 (≈13%), we omitted 40 individuals with the highest propensity score in the analysis and compared the results to those presented in the main text (see table S1 for results).
Incidence rates stratified by year are provided (see table S2), but without omitting potentially erroneously coded incident cases in 2012. Stratified incidence rates show a slightly higher incidence rate in 2012, but only for the lesser restrictive selection criterion.
Table S1 Analysis excluding 40 cases from 2012 with the highest propensity to be erroneously coded for having a new TSCI.
| Criterion B | ||||||
|---|---|---|---|---|---|---|
| Base model | Model 1 | Model 3 | ||||
| Odds ratio (95% CI) |
p-value | Odds ratio (95% CI) |
p-value | Odds ratio (95% CI) |
p-value | |
| Sex | 0.06 | 0.12 | 0.19 | |||
| Female | 1.00 | 1.00 | 1.00 | |||
| Male | 1.55 (0.99–2.42) |
1.44 (0.91–2.28) |
1.48 (0.83–2.64) |
|||
| Age group | <0.001 | <0.001 | <0.001 | |||
| 16–30 years | 1.00 | 1.00 | 1.00 | |||
| 31–45 years | 0.65 (0.36–1.17) |
0.68 (0.37–1.25) |
0.51 (0.23–1.13) |
|||
| 46–60 years | 0.62 (0.36–1.06) |
0.60 (0.35–1.04) |
0.56 (0.27–1.17) |
|||
| 61–75 years |
0.31
(0.17–0.55) |
0.29
(0.16–0.52) |
0.24
(0.11–0.52) |
|||
| ≥76 years |
0.16
(0.07–0.36) |
0.15
(0.07–0.35) |
0.14
(0.05–0.36) |
|||
| Year of TSCI | 0.01 | 0.02 | 0.20 | |||
| 2012 | 1.00 | 1.00 | 1.00 | |||
| 2013 |
0.62
(0.42–0.91) |
0.62
(0.42–0.92) |
0.72 (0.44–1.19) |
|||
| Lesion level | 0.32 | |||||
| Tetraplegia | – | 1.00 | – | |||
| Paraplegia | – | 0.82 (0.55–1.22) |
– | |||
| Lesion level - specified | <0.001 | |||||
| C1–C4 | – | – | 1.00 | |||
| C5–C8 | – | – | 0.68 (0.34–1.37) |
|||
| T1–T12 | – | – | 1.03 (0.51–2.08) |
|||
| L1–S5 | – | – |
0.25
(0.1–0.6) |
|||
Table S2 Incidence rates per million population stratified by year of TSCI.
|
Including all TSCI-related ICD-10 codes
(A) |
Including only a subset of codes
(B) |
Including only selected S-codes & excluding Transient
(C) |
Including only selected S-codes & excluding transient & non-Swiss1
(D) |
Only those with a principle diagnosis of a TSCI-related code
(E) |
Only those with a principal diagnoses of selected S-codes
(F) |
|
|---|---|---|---|---|---|---|
| 2012 | 52.2 (46.2–58.2) |
47.7 (42.0–53.4) |
35.1 (30.2–40.0) |
38.0 (31.9–44.2) |
23.3 (19.3–27.2) |
19.2 (15.6–22.8) |
| 2013 | 47.1 (41.5–52.7) |
42.4 (37.1–47.7) |
32.1 (27.4–36.7) |
33.8 (28.0–39.5) |
23.8 (19.8–27.7) |
20.6 (16.9–24.4) |
| Total | 49.7 (45.4–54.0) |
45.1 (41.0–49.1) |
33.6 (30.0–37.1) |
35.9 (31.5–40.3) |
23.5 (20.6–26.4) |
19.9 (17.2–22.6) |
No financial support and no other potential conflict of interest relevant to this article was reported
1 Asplund K , Bonita R , Kuulasmaa K , Rajakangas AM , Schaedlich H , Suzuki K , et al., World Health Organization Monitoring Trends and Determinants in Cardiovascular Disease. Multinational comparisons of stroke epidemiology. Evaluation of case ascertainment in the WHO MONICA Stroke Study. Stroke. 1995;26(3):355–60. https://doi.org/10.1161/01.STR.26.3.355
2 Giroud M , Lemesle M , Quantin C , Vourch M , Becker F , Milan C , et al. A hospital-based and a population-based stroke registry yield different results: the experience in Dijon, France. Neuroepidemiology. 1997;16(1):15–21. https://doi.org/10.1159/000109666
3 David M , Ware R , Donald M , Alati R . Assessing generalisability through the use of disease registers: findings from a diabetes cohort study. BMJ Open. 2011;1(1):e000078. https://doi.org/10.1136/bmjopen-2011-000078
4 Casey JA , Schwartz BS , Stewart WF , Adler NE . Using electronic health records for population health research: a review of methods and applications. Annu Rev Public Health. 2016;37(1):61–81. https://doi.org/10.1146/annurev-publhealth-032315-021353
5 Post MW , Brinkhof MW , von Elm E , Boldt C , Brach M , Fekete C , et al.; SwiSCI study group. Design of the Swiss spinal cord injury cohort study. Am J Phys Med Rehabil. 2011;90(11, Suppl 2):S5–16. https://doi.org/10.1097/PHM.0b013e318230fd41
6WHO. International perspectives on spinal cord injury. Malta, World Health Organization, 2013.
7 Chamberlain JD , Deriaz O , Hund-Georgiadis M , Meier S , Scheel-Sailer A , Schubert M , et al. Epidemiology and contemporary risk profile of traumatic spinal cord injury in Switzerland. Inj Epidemiol. 2015;2(1):28. https://doi.org/10.1186/s40621-015-0061-4
8 Nijendijk JH , Post MW , van Asbeck FW . Epidemiology of traumatic spinal cord injuries in The Netherlands in 2010. Spinal Cord. 2014;52(4):258–63. https://doi.org/10.1038/sc.2013.180
9Database. Federal hospital discharge statistics database. Swiss Federal Statistical Office. 2012
10 DeVivo MJ , Biering-Sørensen F , New P , Chen Y ; International Spinal Cord Injury Data Set. Standardization of data analysis and reporting of results from the International Spinal Cord Injury Core Data Set. Spinal Cord. 2011;49(5):596–9. https://doi.org/10.1038/sc.2010.172
11Swiss DRG. Regeln und definitionen zur fallabrechnung unter SwissDRG. 2015. Available from: http://www.swissdrg.org/assets/pdf/Tarifdokumente/SwissDRG_Falldefinitionen_Version_4.0_d_def.pdf
12 Kirshblum SC , Burns SP , Biering-Sorensen F , Donovan W , Graves DE , Jha A , et al. International standards for neurological classification of spinal cord injury (revised 2011). J Spinal Cord Med. 2011;34(6):535–46. https://doi.org/10.1179/204577211X13207446293695
13 Mitchell B . A comparison of chi-suare and Kolmogorov-Smirnov tests. Area. 1971;3:237–41.
14 Hagen EM , Rekand T , Gilhus NE , Gronning M . Diagnostic coding accuracy for traumatic spinal cord injuries. Spinal Cord. 2009;47(5):367–71. https://doi.org/10.1038/sc.2008.118
15 Noonan VK , Thorogood NP , Fingas M , Batke J , Bélanger L , Kwon BK , et al. The validity of administrative data to classify patients with spinal column and cord injuries. J Neurotrauma. 2013;30(3):173–80. https://doi.org/10.1089/neu.2012.2441
16 Smith GS , Langlois JA , Buechner JS . Methodological issues in using hospital discharge data to determine the incidence of hospitalized injuries. Am J Epidemiol. 1991;134(10):1146–58. https://doi.org/10.1093/oxfordjournals.aje.a116018
17 Langley J , Stephenson S , Cryer C , Borman B . Traps for the unwary in estimating person based injury incidence using hospital discharge data. Inj Prev. 2002;8(4):332–7. https://doi.org/10.1136/ip.8.4.332
18Hilbe JM. Modeling Count Data. Cambridge University Press, 2014.
19 Singh A , Tetreault L , Kalsi-Ryan S , Nouri A , Fehlings MG . Global prevalence and incidence of traumatic spinal cord injury. Clin Epidemiol. 2014;6:309–31.
20 Sabre L , Pedai G , Rekand T , Asser T , Linnamägi U , Kõrv J . High incidence of traumatic spinal cord injury in Estonia. Spinal Cord. 2012;50(10):755–9. https://doi.org/10.1038/sc.2012.54
21 Pérez K , Novoa AM , Santamariña-Rubio E , Narvaez Y , Arrufat V , Borrell C , et al.; Working Group for Study of Injuries of Spanish Society of Epidemiology. Incidence trends of traumatic spinal cord injury and traumatic brain injury in Spain, 2000-2009. Accid Anal Prev. 2012;46:37–44. https://doi.org/10.1016/j.aap.2011.12.004
22 Gulati A , Yeo CJ , Cooney AD , McLean AN , Fraser MH , Allan DB . Functional outcome and discharge destination in elderly patients with spinal cord injuries. Spinal Cord. 2011;49(2):215–8. https://doi.org/10.1038/sc.2010.82
23 Marti A , Reinhardt JD , Graf S , Escorpizo R , Post MWM . To work or not to work: labour market participation of people with spinal cord injury living in Switzerland. Spinal Cord. 2012;50(7):521–6. https://doi.org/10.1038/sc.2011.181
24 Nas K , Yazmalar L , Şah V , Aydın A , Öneş K . Rehabilitation of spinal cord injuries. World J Orthop. 2015;6(1):8–16. https://doi.org/10.5312/wjo.v6.i1.8
25 Chamberlain JD , Meier S , Mader L , von Groote PM , Brinkhof MW . Mortality and longevity after a spinal cord injury: systematic review and meta-analysis. Neuroepidemiology. 2015;44(3):182–98. https://doi.org/10.1159/000382079
26 Appelros P , Högerås N , Terént A . Case ascertainment in stroke studies: the risk of selection bias. Acta Neurol Scand. 2003;107(2):145–9. https://doi.org/10.1034/j.1600-0404.2003.02120.x
27 Consortium for Spinal Cord Medicine. Early acute management in adults with spinal cord injury: a clinical practice guideline for health-care professionals. J Spinal Cord Med. 2008;31(4):403–79. https://doi.org/10.1080/10790268.2008.11760744
28 Tator CH , Duncan EG , Edmonds VE , Lapczak LI , Andrews DF . Neurological recovery, mortality and length of stay after acute spinal cord injury associated with changes in management. Paraplegia. 1995;33(5):254–62. https://doi.org/10.1038/sc.1995.58
29 Parent S , Barchi S , LeBreton M , Casha S , Fehlings MG . The impact of specialized centers of care for spinal cord injury on length of stay, complications, and mortality: a systematic review of the literature. J Neurotrauma. 2011;28(8):1363–70. https://doi.org/10.1089/neu.2009.1151
30 Aito S ; Gruppo Italiano Studio Epidemiologico Mielolesioni GISEM Group. Complications during the acute phase of traumatic spinal cord lesions. Spinal Cord. 2003;41(11):629–35. https://doi.org/10.1038/sj.sc.3101513
31 Ronca E , Scheel-Sailer A , Koch HG , Metzger S , Gemperli A . Inpatient migration patterns in persons with spinal cord injury: A registry study with hospital discharge data. SSM Popul Health. 2016;2:259–68.
32 Mehra T , Koljonen V , Seifert B , Volbracht J , Giovanoli P , Plock J , et al. Total inpatient treatment costs in patients with severe burns: towards a more accurate reimbursement model. Swiss Med Wkly. 2015;145:w14217. https://dx.doi.org/10.4414/smw.2015.14217
33 Eggli Y , Desquins B , Seker E , Halfon P . Comparing potentially avoidable hospitalization rates related to ambulatory care sensitive conditions in Switzerland: the need to refine the definition of health conditions and to adjust for population health status. BMC Health Serv Res. 2014;14(1):25. https://doi.org/10.1186/1472-6963-14-25
34 Burns EM , Rigby E , Mamidanna R , Bottle A , Aylin P , Ziprin P , et al. Systematic review of discharge coding accuracy. J Public Health (Oxf). 2012;34(1):138–48. https://doi.org/10.1093/pubmed/fdr054
35 Fässler M , Wild V , Clarinval C , Tschopp A , Faehnrich JA , Biller-Andorno N . Impact of the DRG-based reimbursement system on patient care and professional practise: perspectives of Swiss hospital physicians. Swiss Med Wkly. 2015;145:w14080. https://doi.emh.ch/smw.ch/10.4414/smw.2015.14080
36 Maynard FM Jr , Bracken MB , Creasey G , Ditunno JF, Jr , Donovan WH , Ducker TB , et al., American Spinal Injury Association. International standards for neurological and functional classification of spinal cord injury. Spinal Cord. 1997;35(5):266–74. https://doi.org/10.1038/sj.sc.3100432
37 Textor J , Hardt J , Knüppel S . DAGitty: a graphical tool for analyzing causal diagrams. Epidemiology. 2011;22(5):745. https://doi.org/10.1097/EDE.0b013e318225c2be
No financial support and no other potential conflict of interest relevant to this article was reported