Excess mortality during the warm summer of 2015 in Switzerland
DOI: https://doi.org/10.4414/smw.2016.14379
Ana M
Vicedo-Cabrera, Martina S
Ragettli, Christian
Schindler, Martin
Röösli
Summary
QUESTION UNDER STUDY: In Switzerland, summer 2015 was the second warmest summer for 150 years (after summer 2003). For summer 2003, a 6.9% excess mortality was estimated for Switzerland, which corresponded to 975 extra deaths. The impact of the heat in summer 2015 in Switzerland has not so far been evaluated.
METHODS: Daily age group-, gender- and region-specific all-cause excess mortality during summer (June–August) 2015 was estimated, based on predictions derived from quasi-Poisson regression models fitted to the daily mortality data for the 10 previous years. Estimates of excess mortality were derived for 1 June to 31 August, at national and regional level, as well as by month and for specific heat episodes identified in summer 2015 by use of seven different definitions.
RESULTS: 804 excess deaths (5.4%, 95% confidence interval [CI] 3.0‒7.9%) were estimated for summer 2015 compared with previous summers, with the highest percentage obtained for July (11.6%, 95% CI 3.7‒19.4%). Seventy-seven percent of deaths occurred in people aged 75 years and older. Ticino (10.3%, 95% CI −1.8‒22.4%), Northwestern Switzerland (9.5%, 95% CI 2.7‒16.3%) and Espace Mittelland (8.9%, 95% CI 3.7‒14.1%) showed highest excess mortality during this three-month period, whereas fewer deaths than expected (−3.3%, 95% CI −9.2‒2.6%) were observed in Eastern Switzerland, the coldest region. The largest excess estimate of 23.7% was obtained during days when both maximum apparent and minimum night-time temperature reached extreme values (+32 and +20 °C, respectively), with 31.0% extra deaths for periods of three days or more.
CONCLUSIONS: Heat during summer 2015 was associated with an increase in mortality in the warmer regions of Switzerland and it mainly affected older people. Estimates for 2015 were only a little lower compared to those of summer 2003, indicating that mitigation measures to prevent heat-related mortality in Switzerland have not become noticeably effective in the last 10 years.
Introduction
Summer 2015 was especially hot in Central and Eastern Europe. Switzerland experienced the second hottest summer since the beginning of the registry 150 years ago. On average, the temperature was 2.4 °C higher than normal during the period 1981 to 2010, but still 1 °C below the levels registered during the extremely hot summer of 2003. The most severe heatwave during summer 2015 occurred at the beginning of July, which was similar in magnitude but less prolonged than the heat wave in August 2003.
The adverse effect of high temperatures and heatwaves across Europe has been extensively documented over recent decades. Heat has been associated with short-term increases in mortality and morbidity in various European subpopulations [1–4]. Children, elderly persons, and those with a lower socioeconomic profile or with chronic medical conditions have been found to be particularly vulnerable [5, 6].
Heat-related mortality is a growing public health concern because of both the progressive aging of the population and climate change. Predictions indicate warmer temperatures and a higher frequency of extreme events over Europe in future decades, which are likely to increase heat-related impacts [7]. Recently, it was estimated for different regions in Switzerland that the median temperature will increase by 0.9 to 1.4 °C until 2035 and 2.0 to 2.9 °C until 2060, according to the medium A1B emission scenario consisting of very rapid economic growth, global population peaking in mid-century and declining thereafter, and the rapid introduction of new and more efficient technologies. Strikingly, the climate models indicate for Switzerland a greater temperature increase for the summer than for the winter. The warming will probably be more pronounced south of the Alps than in the north [8].
The European heat wave in 2003 constituted a turning point in the public health policies of this continent. The record-breaking temperatures registered during the months of July and August resulted in a mortality toll of more than 70 000 extra deaths in Europe [9]. A thousand unexpected deaths during that summer were estimated in Switzerland, accounting for a 6.9% excess mortality [10]. Heat mostly affected the elderly and populations living in urban and suburban areas, and was mostly limited to the region north of the Alps. Given its devastating consequences, summer 2003 helped to increase public awareness of heat-related threats, and several European countries introduced public health plans to mitigate the adverse health effects of hot weather. For Switzerland, the Swiss Federal Office of Public Health developed an information campaign and provided recommendations for the behaviour during heatwaves. Some cantonal health authorities in the French- and the Italian-speaking cantons introduced heat warning systems similar to those in other European countries.
The aim of the present study was to examine the impact of heat on mortality during the summer of 2015 in Switzerland.
Materials and methods
Mortality and population data
All-cause daily mortality data between 2005 and 2015 in Switzerland was provided by the Federal Office of Statistics. Deaths that occurred outside Swiss territory were excluded. Daily counts were aggregated by gender, age category (<20, 20–39, 40–64, 65–74, 75–84 and ≥85 years old), and place of residence in the so-called Swiss great regions: Northwestern Switzerland, Espace Mittelland (i.e. Swiss plateau), Lake Geneva, Zurich, Ticino, Central Switzerland and Eastern Switzerland (see definitions in the legend of table 1). This level of aggregation was chosen on the basis of homogeneity in the environmental, geographical characteristics and profile of the population.
Annual population data between 2005 and 2015 were obtained from the Federal Office of Statistics. Mid-year population size for each stratum and year was estimated as the mean value of the annual populations of the previous and the current year (reference date for population counts: 31 December).
Meteorological data and identification of heat episodes
Seven meteorological stations spread across the Swiss territory were selected to represent the prevalent meteorological conditions in each of the seven regions (table 1). Daily data on several meteorological indicators were collected from the IDAweb database (Federal Office of Meteorology and Climatology, MeteoSwiss) for the same study period. The main temperature indicators chosen for the analysis were daily daytime (5:40 to 17:40 UTC) maximum temperature, night-time (17:40 prior day to 5:40 UTC current day) minimum temperature and 24-hour maximum apparent temperature. The latter is an indicator of perceived temperature usually used as a discomfort index [11]. It was calculated from each hour-specific air and dew-point temperature with the following formula: –2.653 + (0.994 × temperature in C°) + (0.0153 × (dew-point temperature in °C)2) [11].
The heat episodes (HEs) during summer 2015 were identified by applying seven definitions taking into account different heat intensities and the timing during the day (daytime or night-time). The first six definitions (HE1–HE6) were based on a simple combination of the three temperature indicators (apparent maximum temperature, daytime maximum temperature and night-time minimum temperature) and two different threshold values for each (30 and 32 °C for the two first indicators; 18 and 20 °C for the last). The two pairs of thresholds correspond approximately to the 95th and 99th percentiles, respectively, of each temperature indicator recorded at all seven meteorological stations between 2005 and 2015. A seventh definition (HE7) was included with the aim of capturing extremely hot episodes; that is, days with both high maximum apparent temperatures and night-time temperatures (above 32 and 20 °C, respectively). Isolated hot days and heatwave episodes (≥2, ≥3, ≥4 days with temperatures above the threshold) were identified in each region using the corresponding area-specific temperature series.
Statistical analysis
The expected numbers of deaths for each day and stratum (gender, age-category, great region) in the year 2015 were estimated by extrapolating the strata-specific quasi-Poisson regression models fitted to the daily deaths in the period 2005–2014. Long-term and seasonal trends were controlled by a linear function of time (continuous ordered series from the 1 January 2005 to 31 December 2014) and a trigonometric polynomial of sine and cosine terms (1-year period). This last term was chosen from 6-month, 1-year and 2-year periods according to quasi-AIC (Akaike's information criterion). The mid-year annual population in each stratum was introduced into the model as offset to take into account the temporal changes in the population structure across the study period. We computed the daily number of excess deaths (observed minus expected deaths) for each day, and category of age, gender and region.
The number of excess deaths per day was obtained by subtracting the number of expected deaths per day and gender-age-region strata from the number of observed deaths between 1 June and 31 August 2015. The percentage excess mortality corresponds to the number of excess deaths divided by the number of expected deaths. Standard errors of predicted period counts were computed using the delta method.
To explore the association between excess mortality and temperature, linear regression models were fitted between monthly region-specific percent excess mortality estimates and the monthly average of each of the three temperature indicators.
In a further step, we assessed the percent excess mortality during specific heat episodes that occurred in summer 2015 for each of the regions; this was computed from the sums of the region-specific daily excess mortality and expected counts during the heat episodes in each region, according to the seven definitions described before. Excess estimates were obtained for all hot days (total and in each summer month), isolated hot days only, and heatwave episodes of different intensity in terms of number of hot days in a row.
|
Table 1: Description of the population and meteorological conditions in the seven Swiss regions over the period 2005 to 2015. |
|
Great region
|
Meteorological station
|
Daily Tappmax
(June–August)
|
Daily daytime Tmax
(June–August)
|
Daily night-time Tmin
(June–August)
|
|
Name
|
Population 2015*
n (%)
|
Name
|
Elevation (m)
|
Mean 2005–14
|
Mean 2015
|
Range 2015
|
Mean 2005–14
|
Mean 2015
|
Range 2015
|
Mean 2005–14
|
Mean 2015
|
Range 2015
|
| Northwestern
Switzer
land (Cantons AG, BL, BS ) |
1 122 808 (13.6) |
Basel-Biningen |
316 |
23.8 |
26.3 |
15.5–38.0 |
24.4 |
26.7 |
16.6–37.0 |
14.5 |
15.8 |
8.4–22.3 |
| Espace
Mittelland (Cantons BE, FR, JU, NE, SO) |
1 831 565 (22.1) |
Bern-
Zollikofen |
552 |
22.5 |
25.1 |
15.1–36.7 |
23.4 |
25.9 |
16.5–36.8 |
12.9 |
14.2 |
6.7–20.0 |
| Lake Geneva (Cantons GE, VS, VD) |
1 581 953 (19.1) |
Genève-Cointrin |
412 |
24.1 |
27.0 |
18.5–38.0 |
25.2 |
28.1 |
18.4–39.7 |
14.2 |
15.8 |
8.7–22.5 |
| Zurich |
1 456 217 (17.6) |
Zurich-Fluntern |
443 |
22.1 |
25.1 |
13.1–36.4 |
23.0 |
25.8 |
14.4–34.6 |
14.0 |
15.7 |
7.9–21.5 |
| Ticino |
351 131 (4.2) |
Lugano |
273 |
26.6 |
29.3 |
20.2–36.9 |
26.2 |
27.8 |
19.3–33.9 |
17.6 |
19.0 |
13.1–25.4 |
| Central
Switzerland (Cantons LU, NW, OW, SZ, UR, ZG) |
786 362 (9.5) |
Luzern |
454 |
23.2 |
26.0 |
14.2–37.5 |
23.6 |
26.1 |
15.1–34.8 |
14.0 |
15.8 |
8.8–21.5 |
| Eastern
Switzerland (Cantons AI, AR, GL, GR, SH, SG, TG) |
1 148 946 (13.9) |
St. Gallen |
775 |
19.6 |
22.3 |
9.9–33.8 |
20.5 |
22.8 |
12.3–31.7 |
13.3 |
15.2 |
7.8–22.6 |
| * Total population at mid-year 2015.
daytime Tmax = daytime maximum temperature; night-time Tmin = night-time minimum temperature; Tappmax = maximum apparent temperature
ZH = Zurich; BE = Bern; LU = Lucerne; UR = Uri; SZ = Schwyz; OW = Obwalden; NW = Nidwalden; GL = Glarus; ZG = Zug; FR = Fribourg; SO = Solothurn; BS = Basel-Stadt; BL = Basel-Landschaft; SH = Schaffhausen; AR = Appenzell A. Rh.; AI = Appenzell I. Rh.; SG = St. Gallen; GR = Graubünden; AG = Aargau; TG = Thurgau; TI = Ticino; VD = Vaud; VS = Valais; NE = Neuchâtel; GE = Geneva; JU = Jura |
Results
Description of summer 2015
Mean maximum and minimum temperatures during summer 2015 (June–August) were above the mean figures measured for the same period across the previous 10 years in all seven great regions in Switzerland (table 1). According to the data from the meteorological stations selected for each region, Lake Geneva registered the highest daytime maximum temperature (39.7 °C) and together with Northwestern Switzerland the highest apparent temperature (38.0 °C). Minimum night-time temperatures reached their maximum in the canton of Ticino (25.4 °C). As shown in figure 1, these maximum values were registered at the beginning of July, coinciding with the first period of extreme heat across all regions. It was followed by two other hot periods, one more prolonged although less extreme in mid-July and a shorter one at the beginning of August. Minor elevated temperature episodes were also registered in some regions early in June and at the end of August. Ticino showed the highest number (27) of very hot days with an apparent temperature >32 °C and Lake Geneva the highest number (21) of very hot days with daytime maximum temperature >32 °C (table S1, appendix 1). Very extreme heat wave episodes characterised by an apparent temperature >32 °C and minimum night-time temperature >20 °C (HE7) were especially frequent in the canton of Ticino, with a total of 26 days (compared with ≤7 in all other regions).
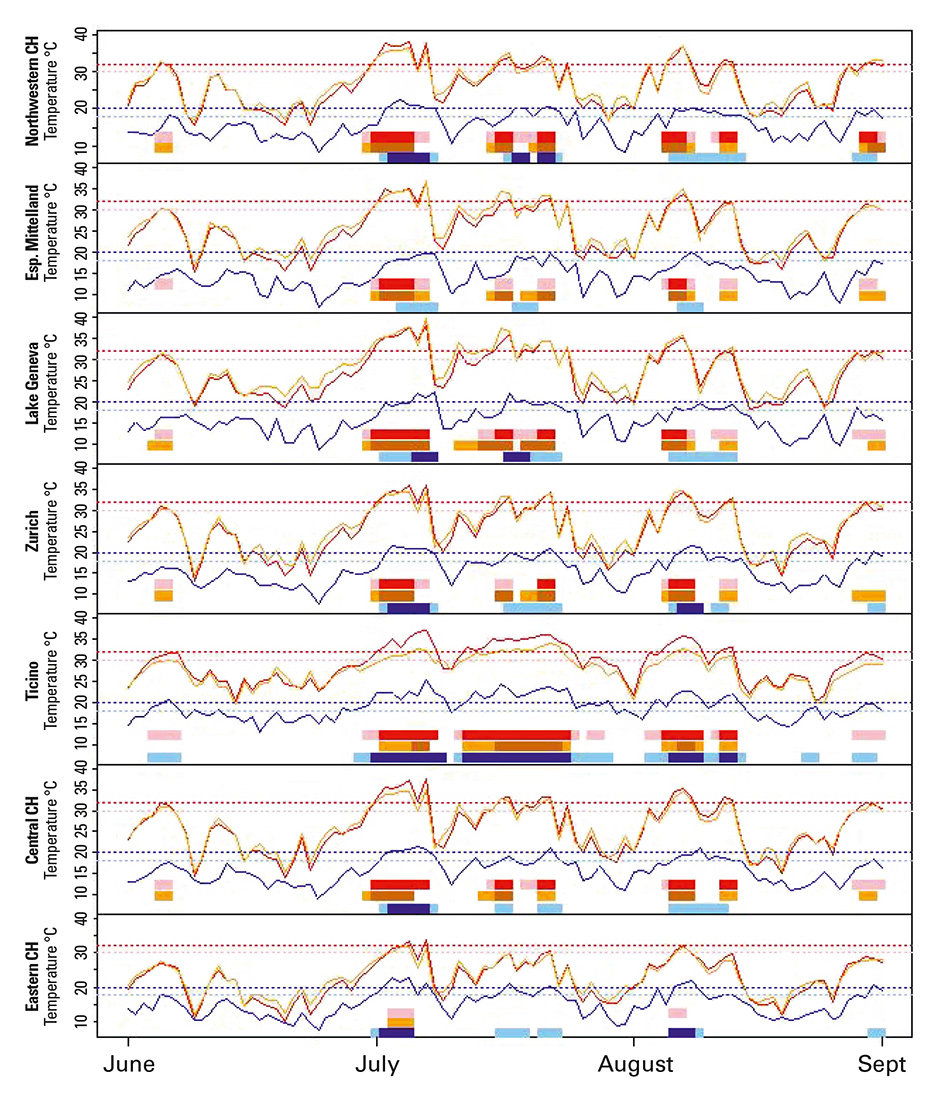
Figure 1
Daily maximum apparent (red line), daytime maximum (orange line) and night-time minimum (blue line) temperatures in each Swiss region in summer 2015. Horizontal bars indicating the heatwave days of at least 2 days’ length identified according to the three temperature indicators and two different thresholds. Horizontal dashed lines correspond to the temperature thresholds used for the heatwave (at least 2 consecutive days) identification (dark red/orange, 32 °C; light red/orange, 30 °C; dark blue, 20 °C; light blue, 18 °C).
Excess mortality
Figure 2 shows the annual time trends of daily mortality counts in 2003 and in each year from 2005 to 2015. Two prominent mortality peaks were observed in the summer months, one in July 2015 and one in August 2003. Although it is not part of the present study, we observed that winter mortality in 2015 was also especially high, with a noticeable peak observed at the beginning of the year.
In Switzerland, 66 762 all-cause deaths were registered in the year 2015, 23.3% of which (15 563 deaths) occurred during the summer period (June–August) (table 2). A total of 804 excess deaths (5.4%, 95% confidence interval [CI] 3.0‒7.9%) were estimated for summer 2015 (June–August) (table 2). Amongst the three summer months, the highest percentage was observed in July (11.6%, 95% CI 3.7‒19.4%), as depicted in figure 3. Excess mortality was 6.0% (95% CI 2.5‒9.5%) in males and 5.0% (95% CI 1.5‒8.4%) in females), and 9.7% in the population aged between 75 and 84 years. Ticino (10.3%, 95% CI −1.8‒22.4%) followed by Northwestern Switzerland (9.5%, 95% CI 2.7‒16.3%) and Espace Mittelland (8.9%, 95% CI 3.7‒14.1%) showed highest excess mortality during this 3-month period. However, when only the estimates in the warmest month of July were considered, the percentage in Lake Geneva region increased up to 12.5% (95% CI −6.5‒31.5%), as well as in Northwestern Switzerland (14.4%, 95% CI −6.9‒35.6%) and Espace Mittelland (15.5%, 95% CI −1.1‒32.1%). Ticino had the highest estimated excess mortality rate of all regions and categories, with 32.8% in July 2015.
Overall, the largest peaks in excess mortality occurred during summer days of extreme heat in Switzerland (fig. 3). A linear association between region-specific monthly average temperatures and excess mortality estimates was found (fig. 4), with a similar increase of 2 percentage points per 1-degree increase in all three temperature indicators: maximum apparent temperature 2.3 (95% CI 1.5–3.1); daytime maximum temperature 2.6 (95% CI 1.6–3.6); night-time minimum temperature 2.7 (95% CI 1.2–4.2). Models for maximum apparent and daytime maximum temperature showed higher adjusted r2 values (0.586 and 0.563, respectively) than night-time temperature (r2 = 0.355).
Table 3 shows the excess mortality during the different heat episodes identified according to the seven definitions. Similar estimates of around 14–15% of excess deaths were obtained during hot days >30 °C (H2, H4) and warm nights >18 °C (H6), and these percentages increased up to 20–21% when only very hot days >32 °C (H1, H3) and nights >20 °C (H5) were considered. The largest excess mortality estimate of 23.7% (95% CI −33.2‒80.6%) was obtained in days when both maximum apparent and minimum night-time temperatures reached extreme values (HE7). Prolonged heatwave episodes tended to result in higher excess mortality if heatwaves of four or more days were considered. The maximum proportion of 31.0% (95% CI −83.8‒145.7%) extra deaths was found when periods of three or more consecutive heat days were considered, according to definition HE7.
|
Table 2: Estimated excess mortality during summer 2015 by month and selected demographic characteristics. |
|
No. observed |
June–August
|
June
|
July
|
August
|
|
|
No. excess |
% excess
(95% CI) |
p-value |
No. excess |
% excess
(95% CI) |
p-value |
No. excess |
% excess
(95% CI) |
p-value |
No. excess |
% excess
(95% CI) |
p-value |
|
Total
|
15 563 |
804 |
5.4
(3.0‒7.9) |
0.000 |
20 |
0.4
(−6.7‒7.5) |
0.909 |
570 |
11.6
(3.7‒19.4) |
0.004 |
214 |
4.3
(−3.0‒11.6) |
0.246 |
|
Sex
|
|
|
|
|
|
|
|
|
|
|
|
|
|
| Male |
7 616 |
428 |
6.0
(2.5‒9.5) |
0.001 |
33 |
1.4
(−8.8‒11.6) |
0.791 |
301 |
12.5
(1.4‒23.6) |
0.027 |
95 |
3.9
(−6.3‒14.1) |
0.451 |
| Female |
7 947 |
375 |
5.0
(1.5‒8.4) |
0.005 |
−12 |
−0.5
(−10.5‒9.5) |
0.923 |
269 |
10.6
(−0.4‒21.7) |
0.058 |
119 |
4.7
(−5.7‒15.0) |
0.376 |
|
Age
|
|
|
|
|
|
|
|
|
|
|
|
|
|
| 0–19 years |
131 |
11 |
8.7
(−18.2‒35.7) |
0.525 |
11 |
26.7
(−67.1‒120.5) |
0.577 |
−2 |
−6.1
(−75.3‒63.1 |
0.863 |
2 |
5.7
(−73.6‒85.0) |
0.888 |
| 20–39 years |
209 |
11 |
5.4
(−13.3‒24.2) |
0.571 |
−14 |
−21.4
(−64.2‒21.4) |
0.327 |
8 |
12.0
(−47.0‒71.0) |
0.690 |
17 |
25.0
(−41.4‒91.4) |
0.461 |
| 40–64 years |
1 924 |
86 |
4.7
(−1.8‒11.1) |
0.157 |
34 |
5.7
(−14.2‒25.5) |
0.577 |
51 |
8.3
(−11.6‒28.2) |
0.413 |
0 |
0.0
(−18.3‒18.4) |
0.997 |
| 65–74 years |
2 323 |
81 |
3.6
(−2.4‒9.6) |
0.237 |
9 |
1.2
(−16.7‒19.1) |
0.897 |
87 |
11.6
(−7.7‒30.9) |
0.239 |
−15 |
−1.9
(−18.8‒14.9) |
0.822 |
| 75–84 years |
4 296 |
381 |
9.7
(4.8‒14.6) |
0.000 |
17 |
1.3
(−12.4‒14.9) |
0.854 |
180 |
13.8
(−1.4‒29.0) |
0.075 |
184 |
14.0
(−1.1‒29.2) |
0.070 |
| ≥85 years |
6 680 |
235 |
3.6
(−0.2‒7.5) |
0.064 |
−36 |
−1.7
(−12.7‒9.3) |
0.764 |
245 |
11.4
(−1.0‒23.9) |
0.071 |
25 |
1.2
(−10.0‒12.3) |
0.838 |
|
Region
|
|
|
|
|
|
|
|
|
|
|
|
|
|
| Northwestern Switzerland |
2 276 |
197 |
9.5
(2.7‒16.3) |
0.006 |
45 |
6.6
(−13.5‒26.8) |
0.517 |
100 |
14.4
(−6.9‒35.6) |
0.184 |
52 |
7.5
(−12.3‒27.2) |
0.459 |
| Espace
Mittelland |
3 886 |
317 |
8.9
(3.7‒14.1) |
0.001 |
57 |
4.9
(−1.04‒20.1) |
0.532 |
185 |
15.5
(−1.1‒32.1) |
0.068 |
75 |
6.3
(−8.9‒21.4) |
0.419 |
| Lake Geneva |
2 686 |
133 |
5.2
(−0.7‒11.1) |
0.086 |
−2 |
−0.3
(−17.3‒16.8) |
0.975 |
107 |
12.5
(−6.5‒31.5) |
0.196 |
28 |
3.3
(−14.1‒20.6) |
0.713 |
| Zurich |
2 557 |
105 |
4.3
(−1.7‒10.2) |
0.161 |
−9 |
−1.2
(−18.4 ‒16.0) |
0.893 |
93 |
11.4
(−7.7‒30.4) |
0.242 |
21 |
2.5
(−14.9‒19.9) |
0.776 |
| Ticino |
759 |
71 |
10.3
(−1.8‒22.4) |
0.096 |
−14 |
−6.1
(−37.1‒24.85) |
0.698 |
75 |
32.8
(−10.9‒76.5) |
0.141 |
9 |
4.1
(−30.1‒38.3) |
0.816 |
| Central
Switzerland |
1 347 |
51 |
3.9
(−4.3‒12.2) |
0.352 |
12 |
2.9
(−21.9‒27.7) |
0.819 |
31 |
7.2
(−18.3‒32.8) |
0.580 |
7 |
1.7
(−22.4‒25.7) |
0.891 |
| Eastern
Switzerland |
2 052 |
−70 |
−3.3
(−9.2‒2.6) |
0.278 |
−69 |
−9.8
(−26.5‒6.9) |
0.249 |
−22 |
−3.0
(−20.8‒14.8) |
0.738 |
21 |
3.0
(−15.9‒21.8) |
0.759 |
|
Table 3: Percent excess mortality (and 95% confidence interval) during heat episodes (HE), according to different cut-off definitions for maximum apparent temperature (Tappmax), daytime maximum temperature (Daytime Tmax) and night-time minimum temperature (Nighttime Tmin) in summer 2015. |
|
HE1
|
HE2
|
HE3
|
HE4
|
HE5
|
HE6
|
HE7
|
| Temperature indicator |
Tappmax |
Tappmax |
Daytime Tmax |
Daytime Tmax |
Night-time Tmin |
Night-time Tmin |
Tappmax and Night-time Tmin |
| Threshold (°C) |
32 |
30 |
32 |
30 |
20 |
18 |
32 and 20 |
| Percentile* |
96th |
93rd |
96th |
93rd |
97th |
92nd |
|
| Hot days
(all summer) |
21.0
(0.9‒41.1) |
15.1
(5.2‒25.1) |
21.5
(0.4‒42.7) |
15.0
(4.6‒25.4) |
19.6
(−13.7‒53.0) |
14.3
(3.9‒24.8) |
23.7
(−33.2‒80.6) |
| Hot days (isolated$) |
22.2
(−72.6‒117.1) |
11.5
(−83.3‒106.3) |
21.8 (−134.2‒177.9) |
15.7
(4.6‒25.4) |
12.1
(−161.1‒185.3) |
0.9
(−68.0‒69.7) |
22.0
(−200.0 ‒244.1) |
| Heatwave events
≥2 days |
20.7
(−4.8‒46.1) |
15.6
(4.4‒26.7) |
21.5
(−3.0‒46.0) |
14.9
(3.1‒26.7) |
21.3
(−20.0‒62.5) |
16.4
(4.2‒28.7) |
24.3
(−52.2‒100.7) |
| Heatwave events ≥3 days |
21.5
(−16.0‒59.0) |
17.5
(2.8‒32.2) |
21.0
(−14.3‒56.3) |
17.0
(2.6‒31.5) |
22.2
(−24.1‒68.5) |
16.6
(4.0‒29.3) |
31.0
(−83.8‒145.7) |
| Heatwave events
≥4 days |
25.7
(−25.5‒76.9) |
18.3
(1.3‒35.3) |
24.8
(−22.4‒71.9) |
19.8
(−0.4‒40.0) |
26.9
(−46.3‒100.2) |
19.1
(2.4‒35.8) |
29.9
(−151.4‒211.3) |
| * Percentile in year 2015 (seven meteorological stations together).
$ Hot days that are not included in heatwave events ≥2, 3, 4 days. |
Discussion
The second hottest summer in Switzerland for 150 years was associated with an estimated 5.4% increase in all-cause mortality between June and August 2015. In each of the Swiss regions, the impact of heat on mortality increased with the average temperature for the month, supporting a relationship between heat and excess all-cause mortality. During hot days (>32 °C) the estimated percentages of excess deaths were around 20%, reaching nearly 30% during the most prolonged and warmest heatwave.
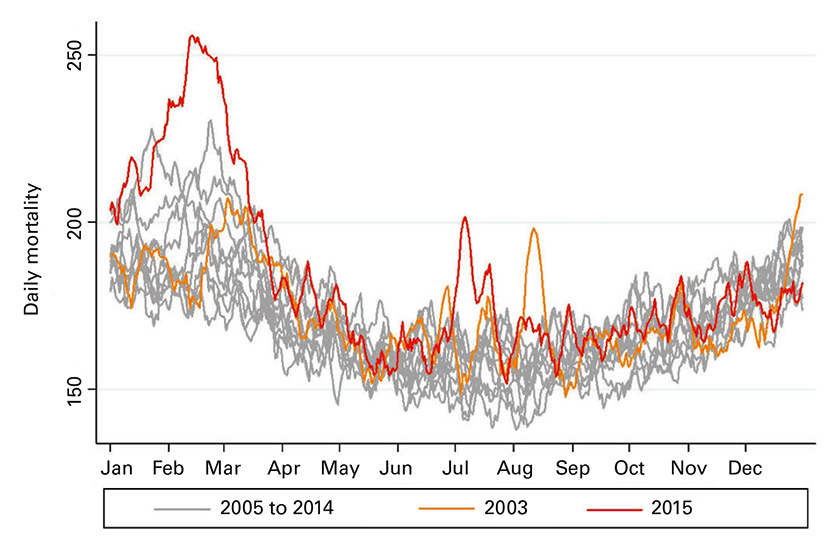
Figure 2
All-cause daily mortality (number of deaths) in Switzerland in 2003, from 2005 to 2014 and in 2015.
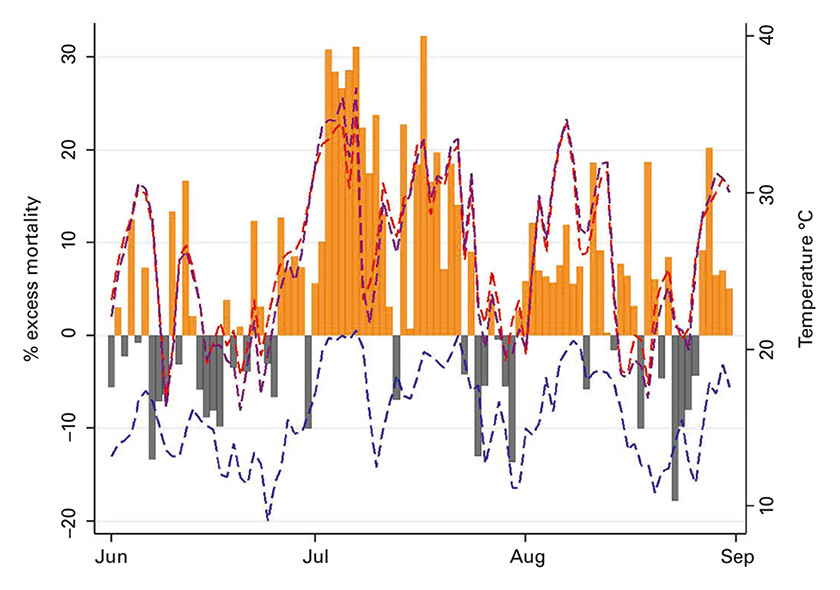
Figure 3
Daily percentage of excess mortality during summer 2015 in Switzerland (vertical bars: orange, positive deviation; grey, negative deviation), and dashed lines showing average daily maximum apparent temperature (purple), maximum daytime (red) and minimum night-time temperatures (blue) across the seven regions.
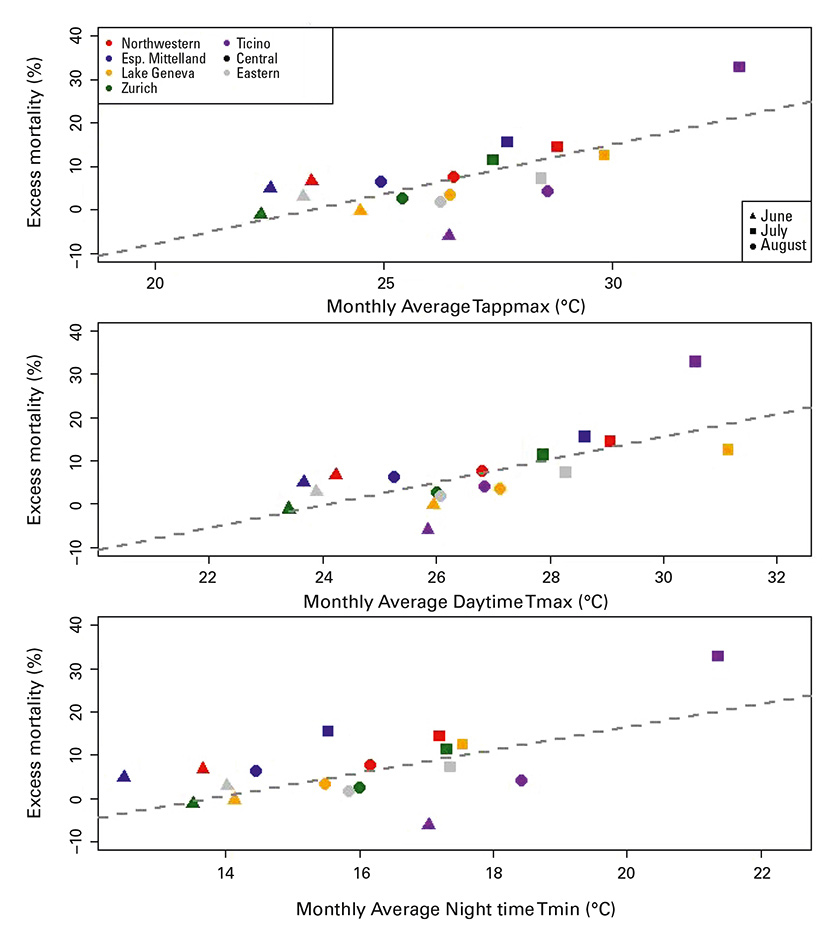
Figure 4
Relationship between monthly average temperature and estimated excess mortality (%) in each great region during summer 2015.
Daytime Tmax = daytime maximum temperature; Night time Tmin = night-time minimum temperature; Tappmax = maximum apparent temperature
The overall heat impact found in the present study for the summer 2015 was somewhat smaller than the estimated excess mortality for the same months in 2003 (6.9%, 95% CI 4.9–8.8%) [10], although confidence intervals of the estimates were broadly overlapping. The summer 2003 was on average 1 °C warmer than 2015 according to MeteoSwiss [12]. Moreover, the heatwave in August 2003 was significantly longer, lasting 20 days on average across the Swiss territory, than the hot period at the beginning of July 2015 (only 7 days). On the other hand, the Swiss population grew from 7.4 to 8.3 million between 2003 and 2015 and there was a shift towards a higher proportion of older persons during this period, which would have increased the pool of heat-susceptible individuals. Despite this change in the population structure and given the differences in heat exposure, the calculated excess mortality estimates for 2003 and 2015 are relatively similar, suggesting that the association between temperature and mortality remained fairly stable over time. However, from our analytic approach the possibility that other factors that changed over time masked a potential difference between the two years cannot be excluded. Similar heat effects in 2003 and 2015 indicate that the implementation of public health campaigns against heat effects during the last decade did not substantially help to reduce overall heat-related mortality in Switzerland. In addition, long-term adaptation of the population to heat from physiological acclimatisation, changes in the prevalence of susceptibility factors over time, better healthcare services, increase in air conditioning usage and improved insulation of houses [13, 14] did not seem to have a major impact on heat-related mortality.
The absence of a substantial decrease in excess mortality during the heatwave of 2015 compared with the one of 2003 is in contrast to case studies performed in other European countries on specific heatwave episodes after summer 2003. A reduction in heat-related mortality found in different locations was mainly attributed to the introduction of various national and regional heat warning systems. For example, heatwaves in 2006 in France resulted in 9% excess mortality, significantly lower than the 55% estimate for summer 2003 [15, 16]. In England, the impact on mortality in the heatwaves in 2013 was also significantly lower than in the 2003 and 2006 heatwaves [17]. In a recent study of nine European cities, a significant decrease in the number of heat-attributable deaths was observed after 2003 in Rome, Paris and Athens [18]. An explanation for this difference from the Swiss situation might be that only a few cantons have formally implemented heat-health watch warning systems, namely the Lake Geneva region and the Ticino. Strikingly, of all Swiss regions, the Lake Geneva region had on average the highest maximum daytime temperature (28.1 °C), but relative excess mortality (5.2%) was slightly below the Swiss average (5.4%). On the other hand, despite a heat warning system, estimated relative excess mortality was highest in the Ticino (10.3%), but with a large confidence interval due to the small sample size. If not a chance finding, extreme meteorological conditions might have counteracted the public health measures in Ticino: the apparent temperature was higher (29.3 °C) and the combinations of hot nights and hot days occurred much more often in Ticino than in any other Swiss region.
The first prominent heat episode of the season, in the first week of July, resulted in the greatest peak in excess mortality, with more than 25% extra deaths during five days in a row. It was a prolonged period of extreme heat identified in all Swiss regions and when the highest maximum temperatures were recorded. Extreme temperatures were also registered on several days later in season, but mortality estimates were considerably lower. Our results might thus suggest evidence of within-summer changes in susceptibility to high temperatures, as shown in previous studies [19, 20]. A recent multicountry study found a reduction of heat-related mortality risk over the summer, which could be potentially attributed to short-term physiological acclimatisation, the progressive adoption of adaptive behaviours during the summer season (change of clothes, outdoor activities, etc.) and even mortality displacement (following the depletion of a pool of frail individuals after initial exposures to heat in early summer) [20].
Consistent with findings of previous studies [21, 22], our results corroborate that age is one of the main factors of heat vulnerability. In total, 77% of the extra deaths were of people aged 75 years and older. In terms of relative excess mortality, differences between age groups were less pronounced, but showed some tendency to a U-shaped relationship with highest proportions in both extremes, among the very young and very old. This may be explained by different mechanisms. In the younger population group (below 20 years old), an 8.7% increase in excess mortality corresponds to 11 deaths and the confidence interval of this estimate is large. In this age group, heatwaves have been indirectly associated with an increase in mortality risk from external causes, such as accidents [23, 24] and suicides [25], which are the main causes of deaths in the young population. Recent studies also found an association between exposure to heat during late pregnancy and stillbirths [26, 27]. Cause of death information was not yet available at the time of this analysis. Several mechanisms may explain the heat-related mortality in the elderly, such as weakening of thermal regulation with aging, the presence of chronic comorbidities and living alone [5, 21, 22]. Summer heat in 2003 affected mostly the oldest population subgroup (above 80 years old) in Switzerland [10]. However, in our study the highest proportion of 9.7% excess mortality was found in the population between 75 and 84 years, not in the oldest category (≥85 years). More than 50% of the population above 85 years in Switzerland reside in a nursing home or benefit from special healthcare attendance (compared with only 5% for those aged 60 to 85 years, in 2014) [28]. Healthcare personnel may have become more aware of heat-related health problems since 2003 and thus provided better protection against heat, as suggested in other studies [24, 29, 30]. An alternative explanation for the relatively low excess mortality in the very old age group might be the particularly strong influenza epidemic that occurred at the beginning of 2015 [31]. This provoked a noticeable increase in mortality (see fig. 2). Possibly the population above 85 years old was the one most affected, which may have led to mortality displacement with a reduction in excess mortality later in the year.
To the best of our knowledge, this is the first study on heat-related mortality during the summer of 2015, despite it being considered an especially warm period in several European countries. In our modelling, we properly addressed the potential heterogeneity in age structure across regions by running strata-specific models with the corresponding population size offsets. An ecological approach was applied, following the methodology of previous nationwide or multicountry studies on the association between heat and mortality [1, 32]. The advantage of this approach was that short-term displacements of deaths of a few days were not considered because the net effects over a period of 3 months was calculated and no assumptions about lagged effects had to be made. However, there are also limitations in this study. In particular, information about the specific cause of death, other individual characteristics (socioeconomic status, urban/rural environment) or environmental factors (air pollution levels), which might have provided insight into potential mechanisms leading to the observed associations, was not available. Daily temperature values were gathered from one meteorological station per region, selected on the basis of the quality and representativeness of its data. In this ecological approach, the temperature data were not needed for the overall excess mortality estimation. However, we considered these temperature measurements in order to explore the association between heat and mortality by means of three different temperature indicators, comparing the results between different definitions of heat episodes, and for the interpretation of differences between regions. We thus have to consider the potential for exposure misclassification in these comparisons. The representativeness of the meteorological stations for the heat exposure of the populations living in the respective regions depends on the heterogeneity of the climate within each region, which in turn depends on the extension, density, topography and distribution of the population. Most critical in that respect is the region of Ticino, where the meteorological station is located in the city of Lugano close to the lake, but the region is quite heterogeneous in terms of altitude and urbanisation. We also presented relative excess mortality for several common heatwave definitions (as shown in table 3) and we could demonstrate that the more extreme the definition, the higher the relative excess mortality. However, it has to be taken into account that extreme events are rare and, in terms of absolute numbers, days with moderately hot temperatures are expected to be more relevant for the whole summer, as shown by Gasparrini et al. 2015 [1]. Our results would, thus, be useful to evaluate costs and benefits when deciding on the temperature thresholds for triggering any heat warning action.
Heat-related mortality is a growing public health concern because of both the progressive aging of the population and climate change [33]. Hot weather during summer 2015 was associated with an increase in mortality in Switzerland, and it mainly affected older people living in the warmer regions. Our results do not suggest an attenuation of the heat impact since the devastating summer of 2003, except maybe in the very old age group. Thus, extreme temperatures still have a considerable impact on health, and more effective public health interventions against heat should be promoted at both nationwide and regional level, especially targeting vulnerable subpopulations with lower adaptive resources and living in more affected areas. Further research should be focused on the assessment of the effectiveness of current public health measures, improvement of heat warning plans targeted to the vulnerable populations, and the design of interventions that are more adapted to the different climates and population characteristics present across the Swiss territory.
Appendix 1: Supplementary table
Table S1: Number of hot days identified in each Swiss great region according to the seven definitions.
Appendix 1: Supplementary table http://www.smw.ch/fileadmin/smw/pdf/SMW-14379-Suppl.pdf
Daytime Tmax = daytime maximum temperature; HE = heat episode; Night-time Tmin = night-time minimum temperature; Tappmax = maximum apparent daytime temperature
Acknowledgments: BfS, Christoph Junker
References
1 Gasparrini A, Guo Y, Hashizume M, Lavigne E, Zanobetti A, Schwartz J, et al. Mortality risk attributable to high and low ambient temperature: a multicountry observational study. Lancet. 2015;386(9991):369–75. doi:http://dx.doi.org/10.1016/S0140-6736(14)62114-0. PubMed
2 Baccini M, Kosatsky T, Biggeri A. Impact of summer heat on urban population mortality in Europe during the 1990s: an evaluation of years of life lost adjusted for harvesting. PLoS One. 2013;8(7):e69638. doi:http://dx.doi.org/10.1371/journal.pone.0069638. PubMed
3 Schifano P, Leone M, De Sario M, de’Donato F, Bargagli AM, D’Ippoliti D, et al. Changes in the effects of heat on mortality among the elderly from 1998-2010: results from a multicenter time series study in Italy. Environ Health. 2012;11(1):58. doi:http://dx.doi.org/10.1186/1476-069X-11-58. PubMed
4 Michelozzi P, Accetta G, De Sario M, D’Ippoliti D, Marino C, Baccini M, et al.; PHEWE Collaborative Group. High temperature and hospitalizations for cardiovascular and respiratory causes in 12 European cities. Am J Respir Crit Care Med. 2009;179(5):383–9. doi:http://dx.doi.org/10.1164/rccm.200802-217OC. PubMed
5 Benmarhnia T, Deguen S, Kaufman JS, Smargiassi A. Review Article: Vulnerability to Heat-related Mortality: A Systematic Review, Meta-analysis, and Meta-regression Analysis. Epidemiology. 2015;26(6):781–93. doi:http://dx.doi.org/10.1097/EDE.0000000000000375. PubMed
6 Xu Z, Etzel RA, Su H, Huang C, Guo Y, Tong S. Impact of ambient temperature on children’s health: a systematic review. Environ Res. 2012;117:120–31. doi:http://dx.doi.org/10.1016/j.envres.2012.07.002. PubMed
7 Meehl S. Collins. Global Climate Projections. In: Climate Change 2007: The Physical Science Basis. Contribution of Working Group I to the Fourth Assessment Report of the Intergovernmental Panel on Climate Change. 2007.
8 Fischer AM, Weigel AP, Buser CM, Knutti R, Künsch HR, Liniger MA, et al. Climate change projections for Switzerland based on a Bayesian multi-model approach. Int J Climatol. 2012;32(15):2348–71. doi:http://dx.doi.org/10.1002/joc.3396.
9 Robine J-M, Cheung SLK, Le Roy S, Van Oyen H, Griffiths C, Michel J-P, et al. Death toll exceeded 70,000 in Europe during the summer of 2003. C R Biol. 2008;331(2):171–8. doi:http://dx.doi.org/10.1016/j.crvi.2007.12.001. PubMed
10 Grize L, Huss A, Thommen O, Schindler C, Braun-Fahrländer C. Heat wave 2003 and mortality in Switzerland. Swiss Med Wkly. 2005;135(13-14):200–5. PubMed
11 Kalkstein LS, Valimont KM. An Evaluation of Summer Discomfort in the United State Using a Relative Climatological Index. Bull Am Meteorol Soc. 1986;67(7):842–8. doi:http://dx.doi.org/10.1175/1520-0477(1986)067<0842:AEOSDI>2.0.CO;2.
12 Abschluss Hitzewelle Juli 2015 [Internet]. [cited 2016 Jul 1]. Available from: http://www.meteoschweiz.admin.ch/home/aktuell/news.subpage.html/de/data/news/2015/7/abschluss-hitzewelle-juli-2015.html
13 Åström DO, Tornevi A, Ebi KL, Rocklöv J, Forsberg B. Evolution of Minimum Mortality Temperature in Stockholm, Sweden, 1901-2009. Environ Health Perspect. 2016;124(6):740–4. PubMed
14 Todd N, Valleron A-J. Space-Time Covariation of Mortality with Temperature: A Systematic Study of Deaths in France, 1968-2009. Environ Health Perspect. 2015;123(7):659–64. PubMed
15 Fouillet A, Rey G, Wagner V, Laaidi K, Empereur-Bissonnet P, Le Tertre A, et al. Has the impact of heat waves on mortality changed in France since the European heat wave of summer 2003? A study of the 2006 heat wave. Int J Epidemiol. 2008;37(2):309–17. doi:http://dx.doi.org/10.1093/ije/dym253. PubMed
16 Fouillet A, Rey G, Laurent F, Pavillon G, Bellec S, Guihenneuc-Jouyaux C, et al. Excess mortality related to the August 2003 heat wave in France. Int Arch Occup Environ Health. 2006;80(1):16–24. doi:http://dx.doi.org/10.1007/s00420-006-0089-4. PubMed
17 Green HK, Andrews N, Armstrong B, Bickler G, Pebody R. Mortality during the 2013 heatwave in England--How did it compare to previous heatwaves? A retrospective observational study. Environ Res. 2016;147:343–9. doi:http://dx.doi.org/10.1016/j.envres.2016.02.028. PubMed
18 de’ Donato FK, Leone M, Scortichini M, De Sario M, Katsouyanni K, Lanki T, et al. Changes in the Effect of Heat on Mortality in the Last 20 Years in Nine European Cities. Results from the PHASE Project. Int J Environ Res Public Health. 2015;12(12):15567–83. doi:http://dx.doi.org/10.3390/ijerph121215006. PubMed
19 Anderson GB, Bell ML. Heat waves in the United States: mortality risk during heat waves and effect modification by heat wave characteristics in 43 U.S. communities. Environ Health Perspect. 2011;119(2):210–8. doi:http://dx.doi.org/10.1289/ehp.1002313. PubMed
20 Gasparrini A, Guo Y, Hashizume M, Lavigne E, Tobias A, Zanobetti A, et al. Changes in Susceptibility to Heat During the Summer: A Multicountry Analysis. Am J Epidemiol. 2016;183(11):1027–36. doi:http://dx.doi.org/10.1093/aje/kwv260. PubMed
21 Basu R. High ambient temperature and mortality: a review of epidemiologic studies from 2001 to 2008. Environ Health. 2009;8(1):40. doi:http://dx.doi.org/10.1186/1476-069X-8-40. PubMed
22 Stafoggia M, Forastiere F, Agostini D, Biggeri A, Bisanti L, Cadum E, et al. Vulnerability to heat-related mortality: a multicity, population-based, case-crossover analysis. Epidemiology. 2006;17(3):315–23. doi:http://dx.doi.org/10.1097/01.ede.0000208477.36665.34. PubMed
23 Basagaña X, Escalera-Antezana JP, Dadvand P, Llatje Ò, Barrera-Gómez J, Cunillera J, et al. High Ambient Temperatures and Risk of Motor Vehicle Crashes in Catalonia, Spain (2000–2011): A Time-Series Analysis. Environ Health Perspect. 2015;123(12):1309–16. doi:http://dx.doi.org/10.1289/ehp.1409223. PubMed
24 Joe L, Hoshiko S, Dobraca D, Jackson R, Smorodinsky S, Smith D, et al. Mortality during a Large-Scale Heat Wave by Place, Demographic Group, Internal and External Causes of Death, and Building Climate Zone. Int J Environ Res Public Health. 2016;13(3):299. doi:http://dx.doi.org/10.3390/ijerph13030299. PubMed
25 Dixon PG, Sinyor M, Schaffer A, Levitt A, Haney CR, Ellis KN, et al. Association of weekly suicide rates with temperature anomalies in two different climate types. Int J Environ Res Public Health. 2014;11(11):11627–44. doi:http://dx.doi.org/10.3390/ijerph111111627. PubMed
26 Auger N, Fraser WD, Smargiassi A, Bilodeau-Bertrand M, Kosatsky T. Elevated outdoor temperatures and risk of stillbirth. Int J Epidemiol. 2016;dyw077. doi:http://dx.doi.org/10.1093/ije/dyw077. PubMed
27 Basu R, Sarovar V, Malig BJ. Association Between High Ambient Temperature and Risk of Stillbirth in California. Am J Epidemiol. 2016;183(10):894–901. doi:http://dx.doi.org/10.1093/aje/kwv295. PubMed
28 Personnes âgées [Internet]. 2016 [cited 2016 Jul 1]. Available from: http://www.bfs.admin.ch/bfs/portal/fr/index/themen/14/04/02/key/01.html
29 Holstein J, Canouï-Poitrine F, Neumann A, Lepage E, Spira A. Were less disabled patients the most affected by 2003 heat wave in nursing homes in Paris, France? J Public Health (Oxf). 2005;27(4):359–65. doi:http://dx.doi.org/10.1093/pubmed/fdi059. PubMed
30 Benmarhnia T, Bailey Z, Kaiser D, Auger N, King N, Kaufman J. A Difference-in-Differences Approach to Assess the Effect of a Heat Action Plan on Heat-Related Mortality, and Differences in Effectiveness According to Gender, Age, and Socioeconomic Status (Montreal, Quebec). Environ Health Perspect. 2016. Published online May 20, 2016. doi:http://dx.doi.org/10.1289/EHP203. PubMed
31 Medienmitteilungen [Internet]. 2012 [cited 2016 Jul 1]. Available from: http://www.bfs.admin.ch/bfs/portal/de/index/news/medienmitteilungen.html?pressID=10146
32 Tobias A, Armstrong B, Zuza I, Gasparrini A, Linares C, Diaz J. Mortality on extreme heat days using official thresholds in Spain: a multi-city time series analysis. BMC Public Health. 2012;12(1):133. doi:http://dx.doi.org/10.1186/1471-2458-12-133. PubMed
33 Winkler MS, Röösli M, Ragettli MS, Cissé G, Müller P, Utzinger J, et al. Mitigating and adapting to climate change: a call to public health professionals. Int J Public Health. 2015;60(6):631–2. doi:http://dx.doi.org/10.1007/s00038-015-0722-7. PubMed