Figure 1
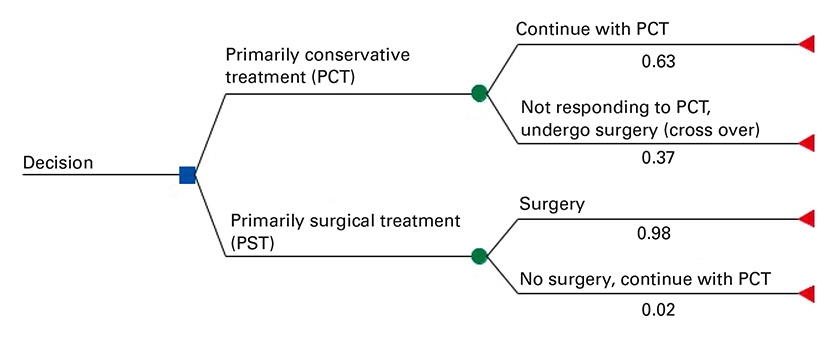
Decision analysis tree comparing primarily conservative treatment (PCT) with primarily surgical treatment (PST) approach.
DOI: https://doi.org/10.4414/smw.2016.14382
Intervertebral disc herniation usually occurs after secondary degenerative changes and is characterised by the protrusion or prolapse of disc material, which in turn can lead to the compression of spinal nerves (radiculopathy) [1]. The choice of treatment, conservative or surgical, depends on symptom severity. In some instances, the recommendation for immediate surgery is made because of severe neurological symptoms, such as cauda equina syndrome. In other cases, the choice may be less clear. Typically, these patients do not fully recover despite conservative treatment and the choice then needs to be made between continuing with the conservative treatment or opting for a surgical intervention.
According to the Agency for Health Research and Quality in the US, the majority of disc herniation surgeries are performed on patients in the working age group, and have an important impact on quality of life and productivity [2]. In 2012, lumbar and other intervertebral disc disorders with radiculopathy due to a herniated disc were the sixth most common diagnosis (9892 cases) among inpatient episodes in Swiss acute care hospitals [3].
Several cost-effectiveness analyses have compared surgery with conservative treatment [4–8], and reported favourable results for surgery. However, methodological approaches were dissimilar and the available evidence cannot be assumed to hold for Switzerland owing to differences in the utilisation of healthcare resources and clinical practice. In the present analysis, we use the terms “primarily surgical treatment approach” (PST; for example, microdiscectomy [9], unilateral transflaval approach using magnification, or bilateral exploration [10]) and “primarily conservative treatment approach” (PCT; broadly defined as involving, for example, physiotherapy, epidural injection or medication). In patients receiving PCT, subsequent crossover to surgical treatment remains a possibility, whereas some patients planned for PST may finally not undergo operation. We aimed to estimate the cost-effectiveness of PST versus PCT, among adults with intermediate severity, acute (symptoms for less than 6 weeks) or subacute (symptoms for 6–12 weeks) lumbar radicular syndrome due to intervertebral disc herniation, from both Swiss healthcare system and societal perspectives. It was assumed that patients already had initial, conservative treatment before the decision on PST versus PCT.
A decision analytic model was developed to represent the management pathway for adults with acute or subacute lumbar radicular syndrome due to intervertebral disc herniation. The model was configured as a decision tree [11] comparing PST and PCT. The model is depicted in figure 1. The branches representing PST and PCT were divided into subbranches. PCT patients could either “continue with conservative treatment”, or “not respond to conservative treatment AND undergo surgery”. Similarly, PST patients could either “undergo surgery” or undergo “no surgery AND continue with conservative treatment”. Clinical data indicating the impact of the initial treatment approach was limited to 2 years and therefore a 2-year time horizon was chosen for the base-case analysis [6, 12].
Figure 1
Decision analysis tree comparing primarily conservative treatment (PCT) with primarily surgical treatment (PST) approach.
In the base-case analysis, the costs and the quality-adjusted life years (QALYs) gained were discounted after the first year with a rate of 2.0% per year [13]. The selected discount rate corresponds to the specification of the Swiss Medical Board.
Main outcomes were costs per treatment, QALYs per treatment, and incremental cost-effectiveness expressed as the cost per QALY gained, from both healthcare system and the societal perspectives.
The base-case model was structured such that individuals assigned to PST who did not undergo surgery would otherwise be managed as individuals who “undergo surgery”. Hence, their downstream effects and costs were the same as those of individuals who did undergo surgery, with the exception of surgery costs. The reason for this assumption was that the underlying clinical trials reported average results per study arm and did not differentiate between the clinical outcomes of per-protocol and crossover patients. A similar assumption was made for individuals assigned to PCT who crossed over to surgery: namely that they would have similar downstream effects, medical examinations and related costs as individuals who remained on conservative treatment, with the exception of additional surgery costs (fig. 1). In sensitivity analyses, the probability of individuals assigned to PCT who crossed over to surgical treatment was varied to reflect populations with alternative risk profiles.
Our population of interest comprised patients with acute (symptoms for less than 6 weeks) or subacute (symptoms for 6–12 weeks) lumbar radiculopathy due to disc herniation at the lumbar spine. Lumbar radiculopathy had to be confirmed clinically and disc herniation had to be confirmed by imaging (computed tomography, magnetic resonance imaging or myelography). In the clinical trials available, patients had typically undergone PCT before they were enrolled. Patients with severe neurological deficits (such as cauda equina syndrome), radiculopathy with neoplasia or epidural abscess, as well as patients with very minor symptoms, were not part of the population of interest.
The path probabilities of the decision analytic model were based on the randomised controlled trials (RCTs) of Peul et al., Österman et al. and Weber et al. [1, 14, 15]. The included studies were conducted in Finland (Österman et al. [15]), the Netherlands (Peul et al. [14]) and Norway (Weber et al. [1]). The number of randomised patients in the smallest study, by Österman et al. [15], was 56, and the larger studies of Weber and Peul et al. [1, 14] had 126 and 283 patients, respectively. The proportion of women varied between 32% and 47%, and the average age at baseline between 37 and 43 years. The maximum observation period ranged from 2 to 10 years. The population of interest had subacute symptoms in the studies of Österman and Peul et al. [14, 15] and acute symptoms in the study of Weber et al. [1]. The presence of a hernia was confirmed by computed tomography in Österman et al. [15], magnetic resonance imaging in Peul et al. [14] and myelography in Weber et al. [1]. To estimate the probability of crossover from PCT to PST, a random effects meta-analysis of these three studies was undertaken (appendix 1), in which 37.0% of patients managed with PCT moved to surgery. The probability of patients assigned to PST but not undergoing surgery was also extracted from the three trials, and was 2.0%. Moreover, the number of reoperations for both treatment strategies was extracted for 12 and 24 months. Patients in the PST groups had a 6.0% probability of reoperation, and patients in the PCT groups who moved to surgery also had a 6.0% probability of reoperation over 2 years of follow-up. Details are available in appendices 1 and 2.
Utilities (quality of life weights) were taken from the cost-effectiveness analysis of van den Hout et al. [5]. This study was based on the trial by Peul et al., and was designed to assess the impact of early surgery versus prolonged conservative treatment on Dutch patients with sciatica from lumbar disc herniation [14]. The instrument used to generate utilities in van den Hout et al. [5] was the EQ-5D questionnaire. Utilities were provided only for the first 12 months, with four point estimates over 12 months of follow-up (appendix 2). In the base-case analysis, we assumed that the difference at 12 months (0.02 on a scale of 0 to 1) was maintained for a further time period up to 24 months. This assumption was supported by the findings of Österman et al. [15], in which the utility value difference at the end of 24 months was 0.02, and of Hansson et al. [12], where 2-year results were reported. However, for other reasons described in the discussion, Hansson et al. was not included in the analyses.
The study by Österman et al. [15] was not considered in the base-case analysis because of a different method of measuring utilities (use of the 15D instrument), and small standard deviation of the reported utility estimates, which indicated a possible “ceiling” effect. However, pooled utility values by Österman et al. [15] and van den Hout et al. [5], based on random effects meta-analyses (appendix 4), were applied in a scenario analysis. Also, additional scenario analyses were performed, in which no difference in utility scores between PST and PCT was assumed for the second year of the analysis.
Costs were estimated both from the Swiss healthcare system perspective and from the societal perspective, taking into account various statistical data for Switzerland for 2011 and 2012, which was the latest available year. These costs were then updated to 2015 values with use of the Swiss consumer price index. The consumer price index values for 2011 to 2015 were 100.2, 99.5, 99.3, 99.3 and 98.2, respectively [16].
The costs (inpatient, outpatient and pharmaceuticals) for the base-case analysis were mainly derived from Swiss health insurance claim data provided by Helsana (a health insurance provider). These data represent a 14.0% market share, with higher values in the German-speaking cantons of Switzerland and lower values in the French-speaking cantons.
Using the claims data, patients who underwent surgery due to intervertebral disc herniation were identified by the Swiss diagnoses related group (SwissDRG) codes I53Z and I56Z [17] (for definitions, see appendix 3). The base-case unit costs for hospitalisations are reported in appendix 3. For scenario analyses, inpatient costs were derived from two alternative sources, namely costs per SwissDRG as provided by the Swiss Federal Statistical Office (FSO) and average inpatient costs per day using Swiss statistical hospital data [18] (appendix 3).
Based on published literature (van den Hout et al. [5] and Tosteson et al. [6]) and expert opinion, the medical specialities and services relevant for the outpatient care of our patient population were identified. These services were general medicine, physiotherapy, chiropractic, ergotherapy, neurosurgery, neurology, rheumatology, attendance at a rheumatology or rehabilitation hospital and therapeutic baths.
Differences in medical resource use between the PST and PCT approaches are reported in appendix 2, with their relevant literature sources. Published literature was used to estimate the difference in medical resource use between PST and PCT where available. Where information was lacking, this was supplemented with assumptions based on clinical expert opinion. This was required only in the case of drug use, where estimates provided by four experts were averaged. The Fachgesellschafte (professional societies) proposed clinical experts who received letters of invitation. Details of research questions and important outcomes were defined with the clinical experts. Four reports with closed questions were returned by the clinical experts, describing information about PST and PCT and their differences with regards to drug use, physiotherapy sessions, epidural injections and diagnostic tests.
Medical resource use estimates were then combined with unit costs extracted from the Helsana dataset to derive outpatient costs incurred during 12 months and between 12 to 24 months of follow-up (appendix 3).
Unit costs of drugs with relevant Anatomical Therapeutic Chemical Classification System (ATC) [19] codes in the Helsana data set were combined with clinical expert estimates of the probability of drug use when comparing the two treatment approaches (appendix 3). Drugs from the following ATC groups were assumed to be used by our study population: oral steroids (H02), musculoskeletal system including anti-inflammatory and partially antirheumatic products, topical products for joint and muscular pain and muscle relaxants (M01, M02, M03), and products from the nervous system including anaesthetics, analgesics, psycholeptics and psychoanaleptics (N01, N02, N05, N06).
Productivity costs applied in the economic model were based on the human capital approach, which values lost work-time using salary levels [20]. Only van den Hout et al. [5, 14] reported on productivity lost in both treatment approaches of interest. According to these authors, patients in “early surgery” lost 377 hours over a 12-month period of follow-up whereas patients in “prolonged conservative care” lost 416 hours (difference 39 hours; 95% confidence interval [CI] −67 to 144 hours). This information was combined with the median Swiss salary level. The median pay rate per hour was CHF 35.37 (2012 data) [21], which was then updated to 2015 data, by use of wages and income from employment indicators (CHF 36.11) [22]. This resulted in mean costs of lost productivity for PST and PCT of CHF 13 614 and CHF 15 002, respectively. The resulting difference in indirect costs between PST and PCT in the first year was CHF 1408, favouring PST. For the second year we assumed that the difference between the two strategies would be the same as in the first year. In a scenario analysis, we assumed no difference for the second year.
Sensitivity analyses were performed to assess the impact of uncertainty around model input parameters, especially those likely to have a relevant effect on the main outcomes, namely hospital, physiotherapy, medications, general practice, neurosurgery, crossover, reoperation and productivity costs. All parameters underlying uncertainty were deterministically varied one at a time, based on their 95% CIs, where available, or by ±30%. In addition, probabilistic sensitivity analysis (PSA) was undertaken by assigning probability distributions to input parameters, reflecting the ranges of variation used in deterministic sensitivity analysis, and performing Monte Carlo simulation with 10 000 iterations. All parameters used and their respective distributions are presented in appendices 2 and 3.
Additional scenario analyses were necessary owing to uncertainty that went beyond stochastic uncertainty around model parameters. The analyses that were undertaken are presented with the results (see table 3 below).
Microsoft Excel (Microsoft Office Professional Plus 2013, Redmond, WA, USA), in combination with @Risk (version 6, 2013, [place and country, as above]), was used as the technical platform for the current model.
Base-case results are summarised in table 1. The PST approach was characterised by higher surgery costs, but lower physiotherapy and treatment costs. From a healthcare system perspective, the PST approach leads to 0.0634 additional QALYs (discounted) per person over 2 years, at a net cost (discounted) of CHF 7198 per person, compared with the PCT approach. These numbers equate to an ICER of CHF 113 396 per QALY gained (table 1). From a societal perspective, which includes all healthcare care costs and costs of lost productivity, the net costs were CHF 4489 (discounted), implying an ICER of CHF 70 711 per QALY gained. In the latter case, the estimated difference in total costs between strategies was reduced because of reductions in the costs of lost productivity, and therefore the ICER was improved (table 1).
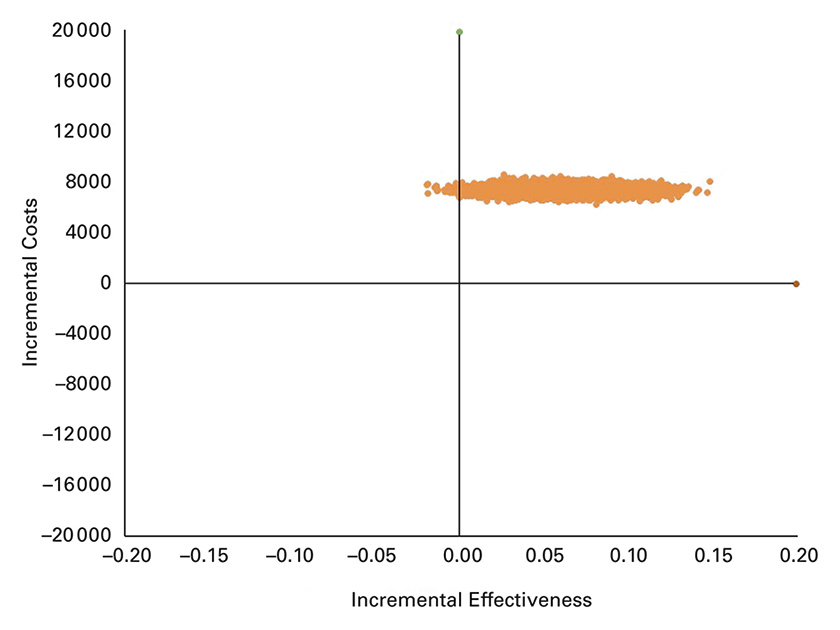
Figure 2
Scatter plot of incremental costs per person and incremental effectiveness derived from 10 000 iterations of the Monte Carlo simulation. Incremental effectiveness is expressed as quality adjusted life years (QALYs) gained and incremental costs are in CHF, from the healthcare system perspective.
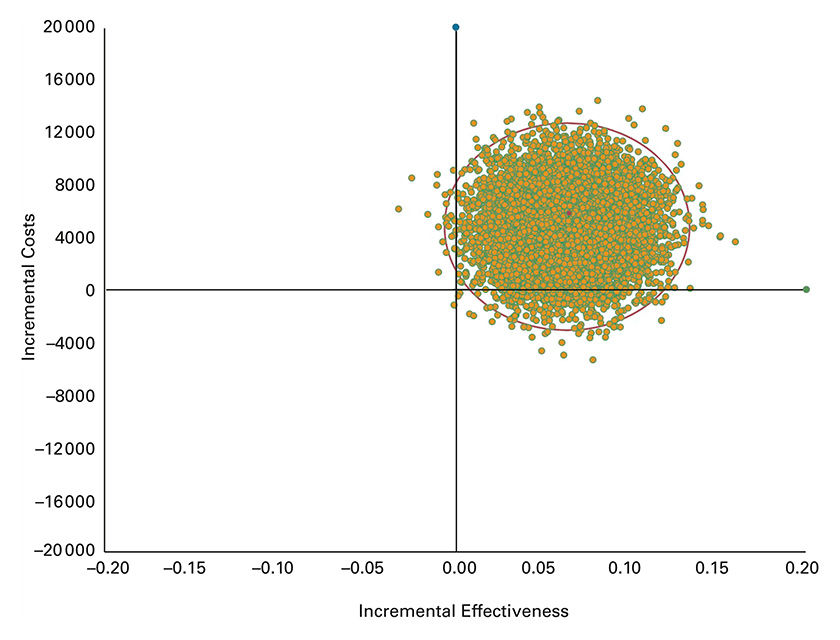
Figure 3
Scatter plot of incremental costs per person and incremental effectiveness derived from 10 000 iterations of the Monte Carlo simulation. Incremental effectiveness is expressed as quality adjusted life years (QALYs) gained and incremental costs are in CHF, from the societal perspective.
In the deterministic sensitivity analysis, results were mostly sensitive to the costs of surgery, utility values and productivity costs (table 2). For example, the use of upper limits for utility values increased the ICER, favouring PCT. In contrast, the use of upper limits for values of productivity costs made PST a cost saving (dominant) approach.
Scenario analysis results are presented in table 3. ICERs were sensitive to different assumptions made for the utility values between strategies, or when the time horizon of the analysis was extended or shortened. For example, using a 1-year time horizon instead of a 2-year time horizon increased the ICER by 34.0%, whereas using a 4-year time horizon in fact decreased the ICER by 36.0%. Results remained the same when two other methods for estimating hospital inpatient costs were used. Use of utility values from the Spine Patient Outcomes Research Trial (SPORT) [6], where chronically ill patients with a longer duration of symptoms than our population of interest were enrolled, improved the ICER substantially (decrease of ICER by 70.0%). Furthermore, the ICER was increased by 70.0%, from a societal perspective when PST patients who did not undergo surgery but continued with PCT were modelled with the same costs and effects as those seen with the PCT approach, and PCT patients who crossed over to surgery with the same costs and effects as seen with the PST approach. Additionally, in the scenario analysis which assumed no difference in utility scores in the second year between PST and PST, the ICER was increased to CHF 99 745, from a societal perspective.
PSA results are presented as cost-effectiveness scatterplots in figure 2 and figure 3. The results fell within the upper right of the cost-effectiveness plane, indicating that the PST approach was more costly and more effective. The distribution indicated substantial uncertainty in the modelled economic results. In the analysis from the healthcare system perspective, the 2.5th and 97.5th percentiles for ICERs were CHF 65 869 and CHF 275 461 per QALY gained, respectively (fig. 2). From the societal perspective, the 2.5th and 97.5th percentiles for ICERs ranged from being cost saving (dominant) to CHF 273 431 per QALY gained, respectively (fig. 3).
| Table 1: Base-case results (healthcare system and societal perspective) of the decision model comparing primarily surgical treatment with primarily conservative treatment approach. The results are expressed per person. | |||
| Parameters | Primarily surgical treatment | Primarily conservative treatment | Difference |
| QALYs (discounted) | 1.554 | 1.490 | 0.0634 |
| Costs (discounted) | |||
| Cost of surgery, reimbursed by statutory health insurance | 5350 | 2003 | 3347 |
| Cost of surgery, cantonal contribution | 6539 | 2448 | 4091 |
| Physiotherapy costs | 1164 | 1325 | −160 |
| Drug costsa | 252 | 321 | −69 |
| Physician and other healthcare costsb | 2297 | 2309 | −11.99 |
| Total healthcare costs | 15 604 | 8406 | 7198 |
| Costs of lost productivityc | 26 192 | 28 901 | −2,709 |
| Total costs from the societal perspective | 41 796 | 37 307 | 4489 |
| Incremental cost-effectiveness ratio (cost per QALY gained, discounted) | |||
| Healthcare system perspective | 113 396d | ||
| Societal perspective | 70 711e | ||
| QALY = Quality Adjusted Life Year; ICER = incremental cost effectiveness ratio. Healthcare system perspective for hospital costs – 45.0% of costs covered by the statutory health insurance and 55.0% by cantonal contributions. a Drug costs include drugs from the following ACT groups: H02, M01, M02, M03, N01, N02, N05, N06. b Physician and other healthcare costs include cost of general medicine, physiotherapy, chiropractic, ergotherapy, neurosurgery, neurology, rheumatology, attendance at a rheumatology or rehabilitation hospital, and therapeutic bath. c Indirect costs of absence from work due to discal hernia. d Healthcare system perspective (ICER = 7198 / 0.0634 = 113 396). e Societal perspective (ICER = 4489 / 0.0634 = 70 711). (All costs in 2015 CHF). | |||
| Table 2: Deterministic sensitivity analysis, comparing primarily surgical treatment (PST) with primarily conservative treatment (PCT). | ||
| Base-case model from a healthcare system perspective | Incremental cost-effectiveness ratio | |
| 113,396 | ||
| Input parameters | Low parameter values | High parameter values |
| Hospital costs | 111 186 | 129 795 |
| Physiotherapy costs for PST over 24 months | 111 852 | 114 941 |
| Physiotherapy costs for PCT over 24 months | 115 154 | 111 638 |
| Cost of medications, including all ATC codes | 113 535 | 113 257 |
| General practice costs for PST | 112 025 | 114 768 |
| General practice costs for PCT | 114 905 | 111 888 |
| Neurosurgery costs for PST | 112 944 | 113 848 |
| Neurosurgery costs for PCT | 113 625 | 113 167 |
| Utility value ranges | 87 228 | 161 995 |
| Crossover from PCT to PST | 132 344 | 92 554 |
| Reoperation at 24 months, PST | 106 895 | 119 898 |
| Reoperation at 24 months, PCT | 117 078 | 109 101 |
| Difference in productivity costs between PST vs. PCT (societal perspective) | 186 728 | Dominant, cost saving |
| a Variation of input parameters was based on the information that was presented in the appendices 2 and 3. (All costs in 2015 CHF) | ||
| Table 3: Scenario analysis for the decision analytical model, comparing primarily conservative treatment (PCT) with primarily surgical treatment (PST). | ||
| Parameters | Values | ICER (Cost per QALY) |
| Healthcare system perspective | ||
| Base-case model from healthcare system perspective | 113,396 | |
| Time framea | 1 year | 152,257 |
| Time frameb | 4 years | 72,451 |
| No difference in utility scores in the second year between PST and PCT | Utility scores (PST: 0.84; PCT 0.84) | 159,957 |
| Utility values from pooled meta-analysisc | PST (0.66; 0.87; 0.849; 0.849): PCT (0.62; 0.816; 0.839; 0.839) | 139,124 |
| Utility value differences between strategies derived from SPORT trial [6] | 0.21 | 34,272 |
| Hospital costs for surgery based on DRG codes (I53Z, I56Z) | 9911 | 98,126 |
| Hospital costs for surgery calculated using data on cost per day in a Swiss acute care hospital | 12,264 | 122,330 |
| Societal perspective | ||
| Base-case model from societal perspective | 70,711 | |
| Time frameb | 4 years | 45,178 |
| No difference in utility scores in the second year between PST and PCT | Utility scores (PST: 0.84; PCT 0.84) | 99,745 |
| Productivity cost data from Koenig et al. only for first 12 months [4] | 3,022 | 85,105 |
| Productivity cost data from Koenig et al. only for 24 months [4]d | 6,044 | 21,811 |
| No cost attached in second year to productivity lost | 91,209 | |
| a 1-year time frame, each base-case value was kept the same, except time frame. b 4-year time frame, each base-case value was kept and extended to 4 years, except no costs were attached to 3rd and 4th year. c Utility values derived from pooled meta-analysis of the studies Österman et al. and van den Hout et al. [5, 15]. d Koenig (2014), cost data about productivity, participants in the PST approach earned over 24 months CHF 6,044 more than PCT approach. (All costs in 2015 CHF) | ||
The cost-effectiveness of PST versus PCT was assessed in adults with acute or subacute lumbar radicular syndrome due to intervertebral disc herniation. The ICER for PST was CHF 113 396 per QALY gained over 2 years, from the Swiss healthcare system perspective. From the societal perspective, the ICER of PST was improved to CHF 70 711 per QALY gained. In Switzerland, there is no official threshold for cost-effectiveness, and in this situation we have used a willingness to pay (WTP) threshold of CHF100 000 per QALY gained as tentative reference [23, 24]. Assuming a WTP threshold of CHF100 000 per QALY gained, a PST approach, when compared with PCT, may be cost-effective from a societal perspective. However, it is less likely to be cost-effective from the Swiss healthcare system perspective. It should be noted that our cost-effectiveness results are valid only for patients with moderate disease severity, not for patients with severe neurological symptoms that suggest an operation is imperative, or for patients with only minor discomfort.
Compared with analyses for other countries, our ICER estimates for Switzerland are substantially less favourable for PST. This is mainly due to differences in methodological approaches, time horizon of analysis, utility parameters used and cost differences between strategies. For example, the Dutch study by van den Hout et al. [5] reported early surgery to be cost-effective from a societal perspective, with an ICER for PST of EUR 41 000 per QALY gained. In this study, the total cost difference between strategies was substantially lower owing to lower surgery costs and other related costs. Some US studies showed favourable ICER results for PST driven by substantially higher QALY differences than in our study. For example, Malter et al. [7], partially based on the clinical trial by Weber et al. [1], reported that surgery gained 0.43 QALYs and that, from a payer perspective, surgical discectomy was a cost-effective strategy with an ICER of USD 33 900 per QALY gained during 10 years of follow-up. Even after the first 12 months, the QALY difference between surgical discectomy and medical management was 0.10, considerably higher than in our base-case analysis (QALY gained in the first year 0.0450). However, the underlying utility estimates were generated indirectly by combination of clinical parameters with preferences elicited from persons with a history of lumbar spine symptoms. A recent study by Koenig et al. [4], who based their effectiveness results on the SPORT study and Malter et al. [6, 7], and used the same utility estimates as Malter et al., calculated an ICER of USD 52 416 per QALY gained. When costs of lost productivity were incorporated into the results, the ICER was USD 4 186 (societal perspective). Koenig et al. classified patients according to actual treatment received, not primary treatment approach, which affects comparability. This was also true for an analysis from a societal perspective based on the SPORT study by Tosteson et al. [6], which reported a cost per QALY gained of USD 69 403 for all age groups and USD 34 355 for individuals aged 65 years and older [6]. Some patients enrolled in the SPORT study were chronically ill, with a longer duration of symptoms than in our population of interest, and which limits comparability with our study population [6]. An invstigation from a societal perspective by Hansson et al. [12] was based on patients with at least 28 days of sick leave prior to enrolment into the prospective cohort study, and is thus also potentially not comparable with our study population. It showed favourable results for surgery, as a result of a QALY difference of 0.327 after the second year.
The present study had several limitations. Firstly, clinical data indicated that the impact of the initial treatment approach was limited to 2 years [5, 15]. There was, however, a lack of reliable information on longer-term utility values and cost data. We addressed this uncertainty in scenario analyses. For example, the model was run over 4 years, with each base-case value kept and extended to 4 years, except that no costs were attached to the third and fourth years. The corresponding ICER was CHF 45 178 per QALY gained form a societal perspective.
Secondly, our estimates of costs were based on health insurance claims data that may not be perfectly representative of the Swiss population, as the Helsana enrolees have a slightly higher average age. This is a common practice. However, the selection of patients based solely on the SwissDRGs I53Z and I56Z is relatively nonspecific, which might lead to the inclusion of a relevant proportion of patients not meeting the intended inclusion criteria. To account for this uncertainty around surgery costs, two other sources of information were used, namely information on the costs of SwissDRGs provided by the Swiss Ferderal Office of Public Health and Swiss statistical data on hospitalisations. The results of both were similar with the estimations of health insurance claims data.
Thirdly, over-the-counter costs directly paid by the patients could not be considered, and indirect costs are theoretically comprised of more than just lost working hours, such as the possibility of early retirement, reduced degree of employment, or reduced paid work of family caregivers. Therefore, our approximation of the societal perspective is limited.
Additionally, the insurance claims data did not allow for the identification of subjects who only received conservative treatment but did not undergo surgery. We could not directly distinguish between use of resources and costs related and unrelated to disc herniation. However, based on information from the literature and answers received from clinical experts, efforts were made to achieve a reasonable approximation of the cost differences between the two strategies, and to assess the impact of related uncertainty.
Utility values used in the base-case analysis were derived from only one Dutch study [5]. In a scenario analysis, utility values based on a meta-analysis of data from two clinical trials yielded consistent results. The assumption that utility values remain the same in year 2 as in year 1 was potentially in favour of PST. To address this limitation, we performed additional scenario analyses in which we assumed no difference in utility scores between the PST and PCT approaches. The corresponding ICER from a societal perspective was CHF 99 745 per QALY gained.
The surgery rate in the conservative treatment group (patients who crossed over from conservative treatment to surgery) in the base-case analysis was 37.0%. If the crossover percentage had been lower, better results might potentially have been achieved, leading to larger differences in QALYs. If the crossover percentage had been higher than 37%, it might have affected the ICERs in either direction.
The results presented here may reasonably reflect true ICERs for our target population with acute and subacute sciatica in Switzerland. However, they are sensitive to assumptions made in the model and potentially affected by substantial uncertainty in some model input parameters, specifically utility parameters and estimates of productivity costs. More research is needed to achieve a firm understanding of the long-term health economic implications of alternative treatment approaches in the population of interest. There is a need for better information on quality of life beyond 12 months of follow up, and cost data that allow use of resources and costs related to disc herniation to be more precisely distinguished from those unrelated.
A PST approach, when compared with a PCT approach, may be cost-effective from the societal perspective based on a willingness to pay threshold of CHF100 000 per QALY gained. However, it is less likely to be a cost-effective treatment approach from the perspective of the Swiss healthcare system. More research is needed to understand the long-term economic implications of treatment approaches among this patient group.
a) Proportion of crossover in the PST group at 1 year.
b) Proportion of crossover in the PCT group at 1 year.
c) Proportion of reoperations in the PCT group over 24 months of follow up.
d) Proportion of reoperations in the PST over 24 months of follow up.
| Base-case value | Range of variation in sensitivity analyses | Basis of variation: distribution type in PSA | Reference | |
| Parameters | ||||
| Percentage not operated, PST | 2% | 1–3% | γ distribution with mean and SE | Peul et al. and Weber et al. [1, 2] |
| Percentage that undergo surgery, PCT | 37% | 27–48% | γ distribution with mean and SE | Peul et al., Österman et al. and Weber et al. [1–3] |
| Reoperation in 24 months, PST | 7.0% | 3–11% | γ distribution with mean and SE | Peul et al. and Österman et al. [1, 3] |
| Reoperation in 24 months, PCT | 6.0% | 0–13% | γ distribution with mean and SE | Peul et al. and Österman et al. [1, 3] |
| Parameters regarding probability of drug use | ||||
| Oral steroids, 12 months, PST | 21.25% | 15–28% | ±30.0 uniform distribution | Expert opinion |
| Oral steroids, 12 months, PCT | 16.25% | 11–21% | ±30.0 uniform distribution | Expert opinion |
| Muscle relaxants and cox-inhibitors, 12 months, PST | 57.78% | 40–75% | ±30.0 uniform distribution | Expert opinion |
| Muscle relaxants and COX-inhibitors, 12 months, PCT | 62.22% | 44–81% | ±30.0 uniform distribution | Expert opinion |
| Narcotics and Antidepressants, 12 months, PST | 28.13% | 20–37% | ±30.0 uniform distribution | Expert opinion |
| Narcotics and Antidepressants, 12 months, PCT | 28.33% | 20–37% | ±30.0 uniform distribution | Expert opinion |
| Muscle relaxants and cox-inhibitors, 24 months, PST | 13% | 9–17% | ±30.0 uniform distribution | Expert opinion |
| Muscle relaxants and COX-inhibitors, 24 months, PCT approach | 23% | 16–30% | ±30.0 uniform distribution | Expert opinion |
| Narcotics and Antidepressants, 24 months, PST | 8% | 5–10% | ±30.0 uniform distribution | Expert opinion |
| Narcotics and Antidepressants, 24 months, PCT | 20% | 14–26% | ±30.0 uniform distribution | Expert opinion |
| Utility values, PST | ||||
| 1st quartile | 0.63 | 0.52–0.74 | β distribution | van den Hout et al. [4] |
| 2nd quartile | 0.81 | 0.75–0.87 | β distribution | van den Hout et al. [4] |
| 3rd quartile | 0.83 | 0.78–0.88 | β distribution | van den Hout et al. [4] |
| 4th quartile | 0.84 | 0.79–0.89 | β distribution | van den Hout et al. [4] |
| Second year | 0.84 | 0.79–0.89 | β distribution | van den Hout et al. [4] |
| Utility values, PCT | ||||
| 1st quartile | 0.57 | 0.44–0.69 | β distribution | van den Hout et al. [4] |
| 2nd quartile | 0.74 | 0.66–0.81 | β distribution | van den Hout et al. [4] |
| 3rd quartile | 0.8 | 0.74–0.86 | β distribution | van den Hout et al. [4] |
| 4th quartile | 0.82 | 0.76–0.87 | β distribution | van den Hout et al. [4] |
| Second year | 0.82 | 0.76–0.87 | β distribution | van den Hout et al. [4] |
| COX = cyclooxygenase; PSA = probabilistic sensitivity analysis; SE = standard error | ||||
| Base-case value | Range of variation in sensitivity analyses | Basis of variation: distribution type in PSA | |
| Parameters – Unit costs (CHF) | |||
| Hospital costs (DRG codes: I53Z, I56Z), derived from Helsana data1 | 5128 | (5031–5845) | γ distribution |
| Additional hospital costs covered by cantonal contribution2 | 6267 | (6149–7144) | γ distribution |
| Average inpatient cost per day using Swiss statistical hospital data for I53Z, I56Z [5, 6] | 5518 | *Alternative data for hospital costs | |
| Average inpatient cost per day using Swiss statistical hospital data for I53Z, I56Z | 6745 | *Alternative data for hospital costs | |
| DRG codes: I53Z, I56Z, derived from FSO [7, 8] | 4460 | *Alternative data for hospital costs | |
| DRG codes: I53Z, I56Z, derived from FSO covered by cantonal contribution | 5451 | *Alternative data for hospital costs | |
| Data for the following costs derived from Helsana | |||
| Physiotherapy cost, 12 months, PST approach | 733 | (690–778) | γ distribution |
| Physiotherapy cost, 24 months, PST approach | 465 | (407–524) | γ distribution |
| Physiotherapy cost, 12 months, PCT approach3 | 835 | (785–885) | γ distribution |
| Physiotherapy cost, 24 months, PCT approach | 530 | (463–597) | γ distribution |
| Cost of medication, ATC code H02, 12 months | 52 | (48–56) | γ distribution |
| Cost of medication, ATC codes M01, M02, and M03, 12 months | 129 | (121–138) | γ distribution |
| Cost of medication, ATC codes N01, N02, N05, and N06, 12 months | 419 | (381–457) | γ distribution |
| Cost of medication, ATC code H02 | 63 | (54–73) | γ distribution |
| Cost of medication, ATC codes M01, M02, and M03 | 134 | (116–150) | γ distribution |
| Cost of medication, ATC codes N01, N02, N05, and N06 | 455 | (394–516) | γ distribution |
| Chiropractic costs, 12 months | 18 | (13–22) | γ distribution |
| Chiropractic costs, 24 months | 24 | (14–34) | γ distribution |
| Ergotherapy, 12 months | 18 | (5–31) | γ distribution |
| Ergotherapy, 24 months | 19 | (6–34) | γ distribution |
| General practice, 12 months, PST approach | 721 | (685–758) | γ distribution |
| General practice, 12 months, PCT approach4 | 793 | (753–834) | γ distribution |
| General practice, 24 months, PST approach | 717 | (662–771) | γ distribution |
| General practice, 24 months, PCT approach | 789 | (729–849) | γ distribution |
| Neurosurgery, 12 months PST approach | 105 | (92–119) | γ distribution |
| Neurosurgery, 24 months PST approach | 45 | (29–61) | γ distribution |
| Neurology, 12 months, PST approach | 52 | (40–64) | γ distribution |
| Neurology, 24 months, PST approach | 62 | (44–78) | γ distribution |
| Neurosurgery, 12 months, PCT approach5 | 54 | (46-60) | γ distribution |
| Neurosurgery, 24 months, PCT approach | 22 | (14–32) | γ distribution |
| Neurology, 12 months, PCT approach5 | 26 | (20–32) | γ distribution |
| Neurology, 24 months, PCT approach | 31 | (23–40) | γ distribution |
| Rheumatology, 12 months | 78 | (64–92) | γ distribution |
| Rheumatology, 24 months | 72 | (54–90) | γ distribution |
| Rheuma- und Rehabilitation clinic, 12 months6 | 426 | (340–512) | γ distribution |
| Therapeutic baths (Heilbäder), 12 months | 5 | (1–8) | γ distribution |
| Therapeutic baths (Heilbäder), 24 months | 4 | (−3–10) | γ distribution |
| Difference in productivity cost PST vs PCT, 12 months | 1408 | (−2419–5200) | γ distribution |
| Difference in productivity cost PST vs PCT, 24 months | 1408 | (−2419–5200) | γ distribution |
| ATC = anatomical therapeutic class; DRG = diagnosis-related group; FSO = Swiss Federal Statistical Office; PSA = probabilistic sensitivity analysis Costs were derived from Swiss health insurance claims data provided by Helsana, and updated to values for the year 2015. 1,2 Hospital costs were assumed to be covered by the statutory health insurance (45%) and by cantonal contribution (55%). The base-case value reflects the mean value of the input parameter. Range of variation for cost values reflected the 95% CI derived from Helsana health insurance claims data. 3 In accordance with van den Hout et al. [4], patients in the PCT approach used 13.8% more physiotherapy services in the first year than patients in the PST approach. The same proportion was assumed for the second year. 4The assumption was made that the PCT approach would involve 10% more general practice visits than the PST approach in the first and second year. 5 The assumption was made that PCT approach would involve 50% less neurosergery and neurology based on van den Hout et al. [4]. 6 Rheuma- und Rehabilitation clinic, information was available only for the first 12 months from statutory health insurance data (i.e. Helsana). * This information was used in the scenario analyses. The average cost for DRG I53Z and I56Z was CHF 12 264.I53Z (Andere Eingriffe an der Wirbelsäule ohne äusserst schwere CC, mit komplexem Eingriff oder Halotraktion) and I56Z (Andere Eingriffe an der Wirbelsäule ohne äusserst schwere CC, ohne komplexen Eingriff oder Implantation eines interspinösen Spreizers). | |||
a) Mean utility values for 3 months comparing PST versus PCT.
b) Mean utility values for 6 months comparing PST versus PCT.
c) Mean utility values for 12 months comparing PST versus PCT.
Mean values represent pooled utility values at 3, 6 and 12 months of follow up, based on random effects meta-analyses of the values reported by Österman et al. [3] and van den Hout et al. [4]. These values were only use in a scenario analysis.
Acknowledgment: We would like to thank Prof, Dr. Andreas Raabe, PD Dr. Stephan Reichenbach, Dr. Gaby Eglseer, Prof. Dr. Constantin Schizas, Dr. Anna Thoma, and Dr. Stephan Marx for their expertise and help during the scoping process. The authors are solely responsible for the content of the manuscript.
This manuscript was based on a report previously published by the Swiss Medical Board (http://www.medical-board.ch/fileadmin/docs/public/mb/berichte/SMB_Assessment_Diskushernien_pub.pdf). Some information provided in the manuscript differs slightly from the initial report, owing to updates of cost data to the year 2015 and additional assumptions made in the model.
1 Weber H. Lumbar disc herniation. A controlled, prospective study with ten years of observation. Spine. 1983;8(2):131–40. doi:http://dx.doi.org/10.1097/00007632-198303000-00003.
2 Agency for Healthcare Research and Quality. Health-Care-Costs and Utilization Project. Available at: http://hcupnet.ahrq.gov/HCUPnet.jsp.
3 Medizinische Statistik der Krankenhäuser: Anzahl Fälle und durchschnittliche Aufenthaltsdauer nach Altersklasse und Behandlungskode, excel file. 2012 [cited 2014 July 2014]; Available from: http://www.bfs.admin.ch/bfs/portal/de/index/themen/14/04/01/data/01/05.html.
4 Koenig L, Dall TM, Gu Q, Saavoss J, Schafer MF. How does accounting for worker productivity affect the measured cost-effectiveness of lumbar discectomy? Clin Orthop Relat Res. 2014;472(4):1069–79. doi:http://dx.doi.org/10.1007/s11999-013-3440-6.
5 van den Hout WB, Peul WC, Koes BW, Brand R, Kievit J, Thomeer RT; Leiden-The Hague Spine Intervention Prognostic Study Group. Prolonged conservative care versus early surgery in patients with sciatica from lumbar disc herniation: cost utility analysis alongside a randomised controlled trial. BMJ. 2008;336(7657):1351–4. doi:http://dx.doi.org/10.1136/bmj.39583.709074.BE.
6 Tosteson AN, Skinner JS, Tosteson TD, Lurie JD, Andersson GB, Berven S, et al. The cost effectiveness of surgical versus nonoperative treatment for lumbar disc herniation over two years: evidence from the Spine Patient Outcomes Research Trial (SPORT). Spine. 2008;33(19):2108–15. doi:http://dx.doi.org/10.1097/BRS.0b013e318182e390.
7 Malter AD, Weinstein J. Cost-effectiveness of lumbar discectomy. Spine. 1996;21(24, Suppl):69S–74S. doi:http://dx.doi.org/10.1097/00007632-199612151-00008.
8 Fitzsimmons D, Phillips CJ, Bennett H, Jones M, Williams N, Lewis R, et al. Cost-effectiveness of different strategies to manage patients with sciatica. Pain. 2014;155(7):1318–27. doi:http://dx.doi.org/10.1016/j.pain.2014.04.008.
9 Österman H, Seitsalo S, Karppinen J, Malmivaara A. Effectiveness of microdiscectomy for lumbar disc herniation: a randomized controlled trial with 2 years of follow-up. Spine. 2006;31(21):2409–14. doi:http://dx.doi.org/10.1097/01.brs.0000239178.08796.52.
10 Peul WC, van Houwelingen HC, van der Hout WB, Brand R, Eekhof JA, Tans JT, et al. Prolonged conservative treatment or ‘early’ surgery in sciatica caused by a lumbar disc herniation: rationale and design of a randomized trial [ISRCT 26872154] [ISRCT 26872154]. BMC Musculoskelet Disord. 2005;6(1):8. doi:http://dx.doi.org/10.1186/1471-2474-6-8.
11 Briggs A, Claxton K, Sculpher M. Decision Modelling for Health Economic Evaluation. Oxford: Oxford University Press; 2006.
12 Hansson E, Hansson T. The cost-utility of lumbar disc herniation surgery. Eur Spine J. 2007;16(3):329–37. doi:http://dx.doi.org/10.1007/s00586-006-0131-y.
13 Gesundheitsdirektion des Kantons Zürich. Beurteilung medizinischer Verfahren. Zollicon: medical board: 2009. p. 14.
14 Peul WC, van den Hout WB, Brand R, Thomeer RT, Koes BW; Leiden-The Hague Spine Intervention Prognostic Study Group. Prolonged conservative care versus early surgery in patients with sciatica caused by lumbar disc herniation: two year results of a randomised controlled trial. BMJ. 2008;336(7657):1355–8. doi:http://dx.doi.org/10.1136/bmj.a143.
15 Österman H, Seitsalo S, Karppinen J, Malmivaara A. Effectiveness of microdiscectomy for lumbar disc herniation: a randomized controlled trial with 2 years of follow-up. Spine. 2006;31(21):2409–14. doi:http://dx.doi.org/10.1097/01.brs.0000239178.08796.52.
16 OECD consumer price index. Available from: https://stats.oecd.org/index.aspx?queryid=221#
17 Bundesamt für Statistik. Cost per DRG. 2011 July 2014]; Available from: http://www.bfs.admin.ch/bfs/portal/de/index/themen/14/01/new/nip_detail.html?gnpID=2013-210.
18 Erhebungen, Quellen – Krankenhausstatistik. 2014 [cited 2014]; Available from: http://www.bfs.admin.ch/bfs/portal/de/index/infothek/erhebungen__quellen/blank/blank/kh/06.html.
19 WHO. Collaborating Centre for Drug Statistics Methodology, Guidelines for ATC classification and DDD assignment 2014. 2014, World Health Organization: Oslo, 2013.
20 Landefeld JS, Seskin EP. The economic value of life: linking theory to practice. Am J Public Health. 1982;72(6):555–66. doi:http://dx.doi.org/10.2105/AJPH.72.6.555.
21 Swiss Federal Statistical Office. Work and income. 2012 [cited August 2014; Available from: http://www.bfs.admin.ch/bfs/portal/en/index/themen/03.html.
22 Wages and income from employment – Indicators. Available from: http://www.bfs.admin.ch/bfs/portal/en/index/themen/03/04/blank/key/lohnentwicklung/quartal.html.
23 Brändle M, Goodall G, Erny-Albrecht KM, Erdmann E, Valentine WJ. Cost-effectiveness of pioglitazone in patients with type 2 diabetes and a history of macrovascular disease in a Swiss setting. Swiss Med Wkly. 2009;139(11-12):173–84.
24 Hirth RA, Chernew ME, Miller E, Fendrick AM, Weissert WG. Willingness to pay for a quality-adjusted life year: in search of a standard. Med Decis Making. 2000;20(3):332–42. doi:http://dx.doi.org/10.1177/0272989X0002000310.
1 Peul WC, van den Hout WB, Brand R, Thomeer RT, Koes BW; Leiden-The Hague Spine Intervention Prognostic Study Group. Prolonged conservative care versus early surgery in patients with sciatica caused by lumbar disc herniation: two year results of a randomised controlled trial. BMJ. 2008;336(7657):1355–8. doi:http://dx.doi.org/10.1136/bmj.a143.
2 Weber H. Lumbar disc herniation. A controlled, prospective study with ten years of observation. Spine. 1983;8(2):131–40. doi:http://dx.doi.org/10.1097/00007632-198303000-00003.
3 Österman H, Seitsalo S, Karppinen J, Malmivaara A. Effectiveness of microdiscectomy for lumbar disc herniation: a randomized controlled trial with 2 years of follow-up. Spine. 2006;31(21):2409–14. doi:http://dx.doi.org/10.1097/01.brs.0000239178.08796.52.
4 van den Hout WB, Peul WC, Koes BW, Brand R, Kievit J, Thomeer RT; Leiden-The Hague Spine Intervention Prognostic Study Group. Prolonged conservative care versus early surgery in patients with sciatica from lumbar disc herniation: cost utility analysis alongside a randomised controlled trial. BMJ. 2008;336(7657):1351–4. doi:http://dx.doi.org/10.1136/bmj.39583.709074.BE.
5 Bundesamt für Statistik. Schweizerischer Lohnindex aufgrund der Daten der Sammelstelle für die Statistik der Unfallversicherung (SSUV) 2014. [cited 2014].
6 Bundesamt für Statistik. Erhebungen, Quellen – Krankenhausstatistik. 2014 [cited 2014; Available from: http://www.bfs.admin.ch/bfs/portal/de/index/infothek/erhebungen__quellen/blank/blank/kh/06.html.
7 Bundesamt für Statistik. Cost per DRG. 2011 July 2014]; Available from: http://www.bfs.admin.ch/bfs/portal/de/index/themen/14/01/new/nip_detail.html?gnpID=2013-210.
8 Swiss Federal Statistical Office. SFOS data. 2014 [cited 2014 July 2014]; Available from: http://www.bfs.admin.ch/bfs/portal/de/index/themen/14/01/new/nip_detail.html?gnpID=2014-094.
Disclosure statement: This study was funded by Swiss Medical Board, Switzerland.
Correspondence: Dr Zanfina Ademi, Pharm, PhD, MPH, Institute of Pharmaceutical Medicine (ECPM), University of Basel, CH-4031 Basel, zanfina.ademi[at]unibas.ch