Figure 1
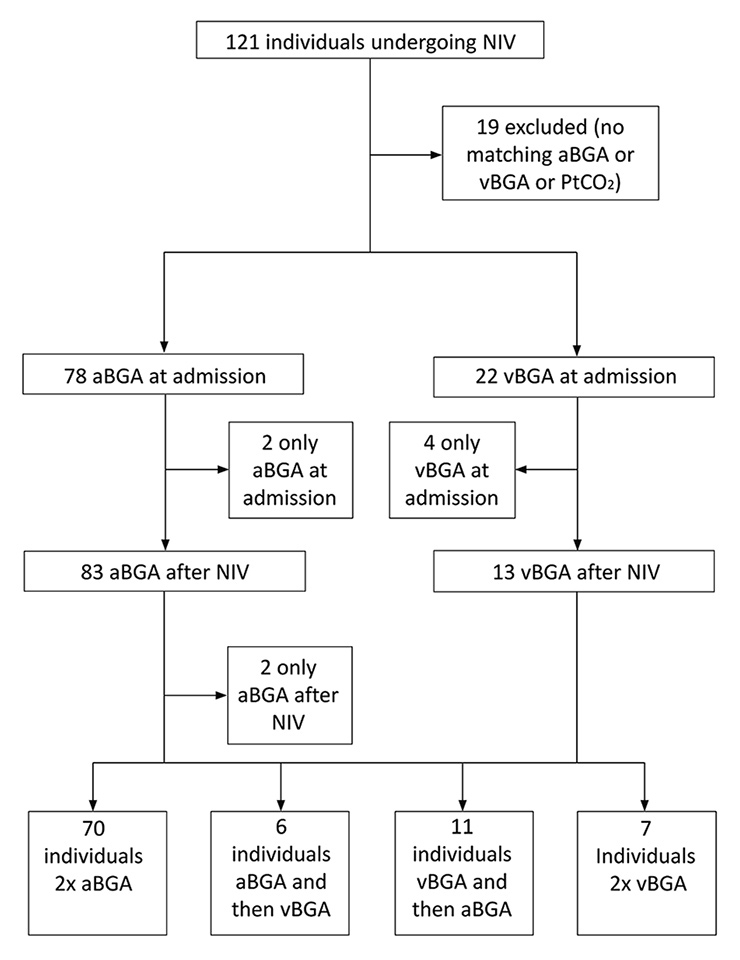
Study flow diagram.
aBGA = arterial blood gas analysis; NIV = noninvasive ventilation; PtCO2 = transcutaneous partial pressure of CO2; vBGA = venous blood gas analysis
DOI: https://doi.org/10.4414/smw.2016.14373
Transcutaneous measurement of carbon dioxide (PtCO2) offers constant monitoring of CO2 and is a pain-free alternative to arterial blood gas analysis [1], which has more potential side effects (bleeding, haematoma, thrombosis [2]) and results in only a snapshot compared with continuous monitoring. In a number of studies, PtCO2 monitoring has been shown to be a reliable alternative to measurement of arterial carbon dioxide tension (PaCO2) [3–13]. This was also demonstrated in hypotensive patients (mean arterial pressure <60 mm Hg) [14].
However, there are conflicting results in patients undergoing noninvasive ventilation (NIV) [3, 15, 16]. Only two studies were performed in patients with acute respiratory failure in the emergency department (ED) [15, 17]. The first study concluded that PtCO2 levels had an unacceptably wide margin compared with PaCO2, whereas the second demonstrated a good correlation between the respective measurements. In previous studies [3, 15], a margin of 10 mm Hg (≈1.33 kPa) has been suggested as the maximum acceptable disagreement between techniques. However, all of these studies compare PtCO2 with PaCO2, despite venous blood gases emerging as a potential replacement for arterial blood gases in emergency situations [18–20]. In our non-university hospital, we regularly and successfully use PtCO2 monitoring backed up with an initial invasive blood gas analysis (BGA) to guide the adaptation of NIV settings in the ED. This approach is implemented in the German guidelines for NIV as a monitoring tool [21], and a recent study [17] in hypercapnic patients showed a good correlation between hypothetical NIV changes compared with true management.
We hypothesised that there would be no clinically significant difference (≤1 kPa) at baseline and after acute NIV between transcutaneous and arterial measurements of CO2 in patients with severe respiratory failure. We also included patients who had only venous blood gas analysis, since it is essentially measured in every patient in our medical emergency department and we were sometimes unable to draw arterial blood for gas analysis. We arbitrarily choose 1 kPa as a clinically significant difference.
This was an observational and retrospective analysis. All patients undergoing NIV because of severe respiratory failure in the ED of our hospital (Kantonsspital St. Gallen, Switzerland) from 1 March 2012 to 28 February 2014 and who had at least one BGA, either venous (vBGA) or arterial (aBGA), and matching PtCO2 measurements were included in the study. At baseline, the time difference between BGA and start of the PtCO2 measurements was not defined; after initiation of NIV, BGA and PtCO2 were synchronously recorded. Severe respiratory failure was defined as hypoxaemic respiratory failure (respiratory rate [RR] above 25/min and an oxygen saturation [SpO2] of below 92% despite supplemental oxygen at 6 l/min) and/or hypercapnic respiratory failure (pH <7.35 and either hypercapnia [PaCO2 >6.0 kPa] or severe hypercapnia [PaCO2 >7.4 kPa]). We excluded patients who arrived intubated at the emergency department. For NIV, we used a portable homecare ventilator (StellarTM 100 or StellarTM 150, Resmed Ltd, Bella Vista, Australia).
The primary endpoint was the difference between arterial or venous carbon dioxide tension (PaCO2/PvCO2) and PtCO2 at admission and after up to 2 hours of NIV. We arbitrarily choose 1 kPa as a clinically significant difference. Secondary endpoints were feasibility of transcutaneous PCO2 monitoring, evolution of values of PtCO2 versus the evolution of values of PaCO2 (no change defined as within ±0.5 kPa and change defined as > ±0.5 kPa) and whether heart rate, respiratory rate, body temperature, body mass index (BMI), forced expiratory volume in 1 second (FEV1), haemoglobin levels, PaCO2 values, pH, underlying disease (acute cardiac pulmonary oedema [ACPE], lower respiratory tract infection [LRTI], exacerbated chronic obstructive pulmonary disease [COPD], COPD and LRTI, other) or the time gap between blood gas and PtCO2 measurement had any influence.
Data retrospectively collected from medical records included indication for NIV, heart rate (measured via electrocardiogram), respiratory rate (measured via electrocardiogram), blood pressure, failure of PtCO2 measurement, patient demographics, BMI, FEV1, haemoglobin levels and the time gap between drawing a blood sample and the measurement of PtCO2. The latter was calculated as the interval from the point of time when a sample for BGA was drawn to the point of time when the first value from the PtCO2 measurements was collected at baseline; during NIV the PtCO2 values were recorded simultaneously with the sampling for BGA. Venous or arterial BGA were analysed using a Radiometer ABL800 Flex (Thalwil, Switzerland) and the blood samples were drawn by the attending physicians of the ED. PtCO2 was measured using a SenTec Digital Monitor SDM (SMB SW 07.02.2, V-STATS/VCARE 3.01, Therwil, Switzerland) using a V-Sign sensor. V-Sign sensors use a Stow-Severinghaus type PtCO2 sensor measurement segment. In addition, V-Sign sensors also include SpO2 measurement and a heating segment. Probes were placed on the earlobe of the patients using a conductive lotion, as proposed by the manufacturer. The corresponding values were recorded as soon as the colour of the PtCO2 indicator turned from grey to green, marking a stable value (the earliest values were taken 5 min after sensor application). The sensor was attached solely by our team of respiratory therapists, consisting of nine people. Every 5 min, PtCO2 values, SpO2, RR, heart rate and blood pressure were recorded. In addition, from 2014 onwards, PtCO2 measurements were saved as PDF files. Drift correction of PtCO2 was not performed, since we considered this to be negligible owing to the minimal changes reported earlier (<0.1 kPa/h) [3].
The agreement between PtCO2 and PaCO2/PvCO2 was assessed using the Bland-Altman procedure [22]. Estimated biases (mean difference between the two methods) are given together with their 95% confidence intervals (CIs). The 95% limits of agreement (2 x standard deviations of the difference) are also reported. In addition, linear regression was used and the estimate of the slope of the regression line is provided together with its standard error. A significance level of 5% was chosen. All data are reported as median with interquartile range. All analyses were done using the R statistical software [23]
The study was approved by the Ethics Committee of the Canton of St. Gallen and was registered under EKSG13/118. Informed patient consent was waved by the institutional ethics board.
Baseline characteristics of the patients are shown in table 1. The patient flow chart is shown in figure 1. Thirteen of the 102 patients treated with NIV were subsequently intubated.
Figure 1
Study flow diagram.
aBGA = arterial blood gas analysis; NIV = noninvasive ventilation; PtCO2 = transcutaneous partial pressure of CO2; vBGA = venous blood gas analysis
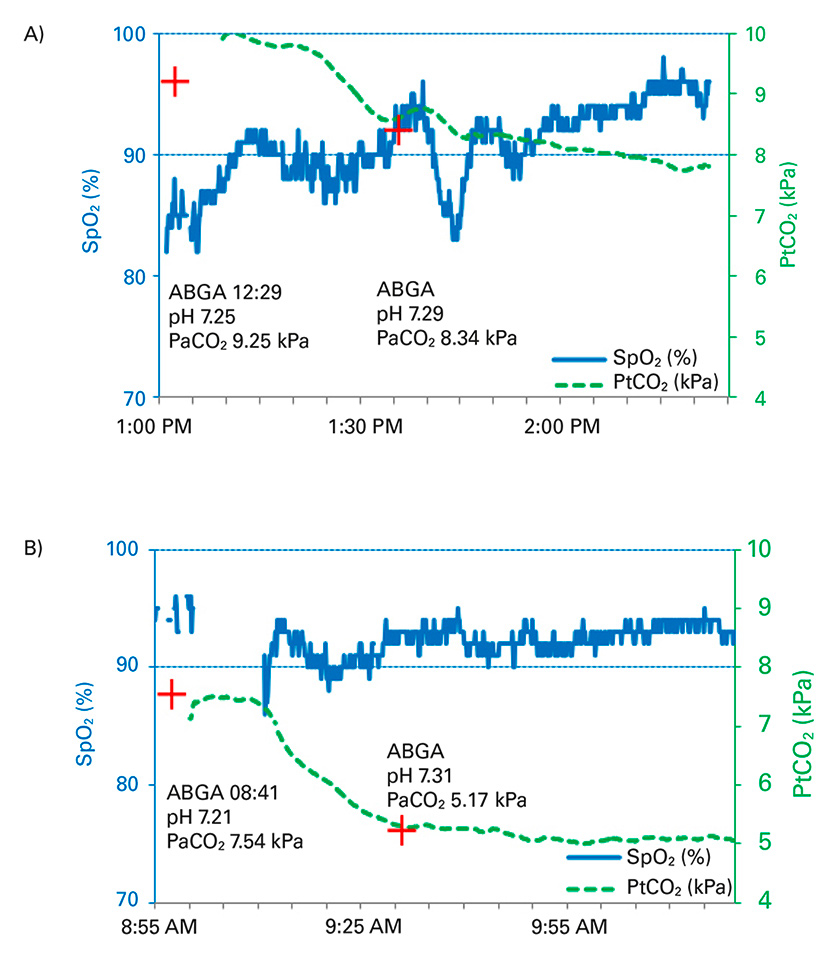
Figure 2
Real-time PtCO2 monitoring of two patients undergoing noninvasive ventilation. (A) Exacerbated chronic obstructive pulmonary disease, (B) Acute cardiac pulmonary oedema. The red cross indicates the PaCO2 values from the arterial blood gas analysis, PtCO2 values (dashed lines) and SpO2 values (solid lines) are demonstrated.
ABGA = arterial blood gas analysis; PaCO2 = arterial partial pressure of CO2; SpO2 = oxygen saturation
In figure 2, two examples of NIV using PtCO2 measurement are demonstrated, showing a good correlation with the respective aBGA and also showing how quickly PtCO2 changes.
Of a total of 121 identified cases, 102 had PtCO2 and PaCO2/PvCO2 measurements, 100 at baseline and 95 before and after intervention. In the remaining 19 patients, either no BGA or no measurement of PtCO2 was recorded. For patients with aBGA, a Bland-Altman analysis and a linear regression analysis are depicted in figure 3A–D. The mean difference was 0.46 kPa at baseline (95% CI 0.23 to 0.60, limits of agreement 95% CI –0.54 to 1.45) (fig. 3A) and 0.12 kPa after NIV (95% CI –0.04 to 0.29, limits of agreement 95% CI –0.61 to 0.86) (fig. 3C). The linear regression analysis found a correlation of R 2 0.88 (p <0.001) at baseline (fig. 3B) and of R 2 0.99 (p <0.001) after initiating NIV (fig. 3D). In patients with a time gap <60 min between aBGA and PtCO2 measurement at baseline, the mean difference was 0.52 kPa (95% CI 0.22 to 0.81, limit of agreement 95% CI –0.55 to 1.57), R 2 0.88 (p <0.001). Subgroup analysis for patients with aBGA revealed a similar good correlation for the different disease groups (ACPE, LRTI, acute exacerbated COPD, COPD and LRTI and other, data not shown).
Absolute changes of PtCO2 correlated in 73% of patients with no change in PaCO2 (±0.5 kPa) and in 76% with changes in PaCO2 >±0.5 kPa.
For patients with vBGA, the mean difference was 0.64 kPa at baseline (95% CI 0.04 to 1.24, limits of agreement 95% CI –0.72 to 2) and 0.80 kPa after NIV (95% CI 0.51 to 1.10, limits of agreement 95% CI 0.29 to 1.32), R 2 0.78 (p <0.001) at baseline and R 2 0.91 (p <0.001) after initiating NIV.
Univariate analysis of the effect of confounders on PtCO2 revealed that only a PaCO2/PvCO2 >8 kPa (n = 48 at baseline) was independently associated with a widened margin of PtCO2 (p <0.001). Residual standard error varied from 0.52 below 8 kPa up to 1.42 above 8 kPa. No other correlations were found (see table 2).
Problems with the PtCO2 measurement probe occurred in three cases: once because of a very thick earlobe, once because of probe malfunction – the probe had to be replaced – and once owing to insufficient peripheral perfusion most possibly secondary to low blood pressure.
| Table 1: Characteristics of patients at baseline. | |
| Age (n = 102) | 69 (59–77) |
| SBP (mm Hg) (n = 102) | 138 (117–158) |
| MAP (mm Hg) (n = 102) | 95 (86–108) |
| HR (beats/min) (n = 100) | 95 (79–112) |
| BMI (kg/m2) (n = 81) | 28.4 (22.6–35) |
| FEV1 (%) (n = 55) | 43 (34.0–60) |
| RR (breaths/min) (n = 101) | 28 (24.0–32) |
| Saturation of oxygen (%) (n = 102) | 90 (86–94) |
| Oxygen supply (l/min) (n = 102) | 3 (1–7) |
| pH overall (n = 100) | 7.32 (7.25–7.39) |
| pH in hypercapnic patients (PaCO2 >6 kPa) (n = 53) | 7.29 (7.24–7.34) |
| Temp (°C) (n = 91) | 37 (36.5–37.4) |
| Hb (g/dl) (n = 101) | 13.6 (12.1–15.2) |
| Time difference between BGA and PtCO2 measurement (min) (n = 100) | 35 (20–58) |
| PaCO2 (kPa) (n = 78) | 7.64 (5.31–9.25) |
| Underlying disease: | |
| AECOPD (n) | 35 |
| ACPE (n) | 19 |
| LRTI (n) | 19 |
| COPD+LRTI (n) | 7 |
| Other (n) | 22 |
| ACPE = acute cardiac pulmonary oedema; AECOPD = acute exacerbated COPD; BGA = blood gas analysis; BMI = body mass index; COPD = chronic obstructive pulmonary disease; Hb = haemoglobin; HR = heart rate; LRTI = lower respiratory tract infection; MAP = median blood pressure; PaCO2 = arterial carbon dioxide tension; PtCO2 = transmembraneous carbon dioxide tension; RR = respiratory rate; SBP = systolic blood pressure; Temp = temperature Values are reported as median with inter-quartile range. | |
| Table 2: Confounding factors of concordance of PtCO2 vs PvCO2/PaCO2 measurement. | |
| Underlying disease: | |
| AECOPD (n = 35) | p = 0.46 |
| ACPE (n = 19) | p = 0.96 |
| LRTI (n = 19) | p = 0.91 |
| COPD+LRTI (n = 7) | p = 0.28 |
| Other (n = 22) | p = 0.56 |
| PaCO2 >8 kPa (n = 48) | p <0.001 |
| Heart rate (beats/min) (n = 100) | p = 0.29 |
| Time difference between BGA and PtCO2 measurement (maximum 385 min) (n = 86) | p = 0.66 |
| SBP (n = 102) | p = 0.97 |
| SBP <90 mm Hg (n = 11) | p = 0.44 |
| MAP (n = 102) | p = 0.77 |
| MAP <60 mm Hg (n = 8) | p = 0.31 |
| BMI (n = 81) | p = 0.11 |
| Temp. (n = 91) | p = 0.42 |
| FEV1 (n = 55) | p = 0.90 |
| RR (breaths/min) (n = 101) | p = 0.06 |
| Age (n = 102) | p = 0.61 |
| pH | p = 0.97 |
| ACPE = acute cardiac pulmonary oedema; AECOPD = acute exacerbated COPD; BGA = blood gas analysis: BMI = body mass index; COPD = chronic obstructive pulmonary disease; FEV1 = forced expiratory volume in 1 second; HR = heart rate; LRTI = lower respiratory tract infection; MAP = median blood pressure; PaCO2 = arterial carbon dioxide tension; PtCO2 = transmembraneous carbon dioxide tension; PvCO2 = venous carbon dioxide tension; RR = respiratory rate; SBP = systolic blood pressure; Temp. = temperature | |
To our knowledge, this is the largest study in patients with severe respiratory failure undergoing NIV in an ED, monitored with real time PtCO2 measurements [3, 5, 16], and the only study to include patients with hypoxaemic failure. We created a unique setting by interpreting real-time PtCO2 measurements and did not use the drift correction during acute NIV. At baseline, transcutaneous PCO2 could not be obtained because of problems with the sensor in 3 (3%) cases. In all cases, the detection failure could be corrected within 1 h. In our setting, we found a good correlation of PtCO2 and arterial PCO2 at baseline, which was even better after intervention (fig. 3). The correlation was within the predefined clinically significant difference of 1 kPa in 75% of cases at baseline, which is not sufficient without prior validation with an aBGA. The better correlation after NIV is possibly directly related to the fact that CO2 levels were reduced (often <8 kPa, fig. 3), thus enabling the device to operate in the optimised range. We likewise noted a good correlation between the trends for PtCO2 and PaCO2 before and after intervention, especially in patients with a change in PaCO2 of ≥1 kPa. The former finding was also observed by Storre et al. [3] and Janssens and colleagues [16], but has never been formally investigated in patients undergoing acute NIV in the ED. The latter has been recently shown by the group of Van Oppen [17], although our trends of PtCO2 and PaCO2 were less well-correlated, probably as a result of the shorter observational time (up to 2 hours vs 12 hours) and because Van Oppen and colleagues included only hypercapnic patients in a different setting (medical high dependence unit). Therefore, this might be a good tool for real-time surveillance in this group of patients while in the emergency department but not a tool to measure the exact values of CO2.
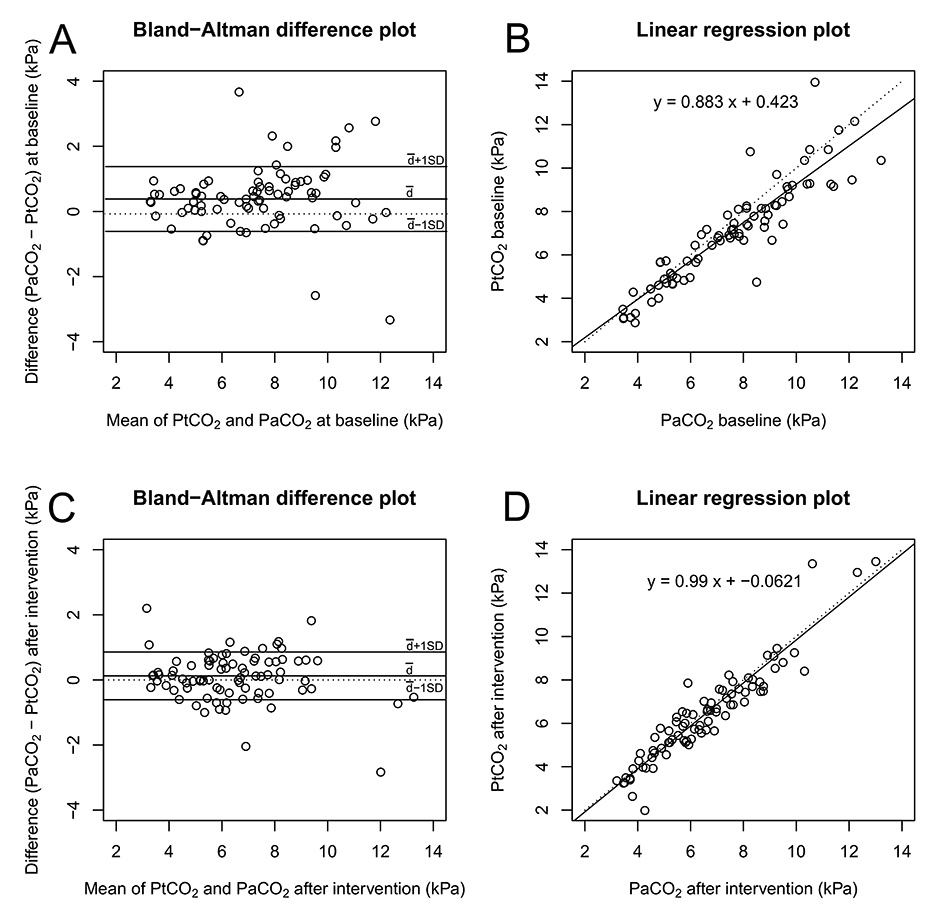
Figure 3
Comparison of transcutaneous and invasive PaCO2 at baseline and after intervention. Measurements were compared using both a Bland-Altman plot (A, C) and a linear regression plot (B, D). A and B at baseline, C and D after NIV. The Bland-Altman plot displays the mean bias and limits of agreement (solid lines). The linear regression plot displays the line of best fit (solid line) and the identity line (dashed line).
Before this study, end-tidal CO2 measurement was available in the ED but was rarely used. In comparison with transcutaneous PCO2, end-tidal CO2 measurements are often misleading in this setting [24] owing to the frequently used vented systems of NIV, additional oxygen application or air leakage of facial masks. We thus believe that PtCO2 could replace end-tidal CO2 for monitoring patients in severe respiratory failure undergoing NIV in the ED of other hospitals as well, since it is patient-friendly, feasible, reliable and safe in emergency situations.
The difference between PaCO2 and PtCO2 increased with higher levels of PCO2 (≥8 kPa). This is in agreement with the findings of other studies [13, 15]. We believe that this might be directly related to higher levels of CO2 within the tissue leading to acidosis and vasoconstriction, thus potentially resulting in reduced blood flow and, therefore, interfering with the measurement. However, despite increasing differences between arterial and transcutaneous CO2 levels, we found the use of PtCO2 very helpful in patients with excessive hypercarbia because of the correct real-time trend supplied by the device.
The Sentec Digital Monitor offers a relatively short time to stabilisation and the sensor can be disconnected from the machine without the need for an additional calibration. With these advances, PtCO2 monitoring could prove to be helpful in emergency situations and may even improve NIV guidance, because of the real-time documentation of ventilatory changes, especially in hypercapnic patients. Moreover, repeated aBGA may not be necessary to assess the success of NIV. Since PtCO2 measurement is an indirect measure of PCO2, a synchronous BGA at baseline is recommended to validate the respective levels and appears to be mandatory in cases of PtCO2 values ≥8 kPa. Evidently, BGA also offers additional information such as pH or lactate concentration. As an alternative, repeated vBGA might be useful as previously noted [18].
As shown in earlier studies, heart rate, blood pressure [14, 15], BMI [5] and skin temperature [25] had no significant influence on levels of PtCO2. The latter finding is in contrast to that of Bobbia and colleagues [13]. Furthermore, respiratory rate, FEV1 and underlying disease did not influence PtCO2 in our mixed patient group.
Since implementing PtCO2 measurements, NIV has been used more often on the emergency department in our hospital, and from our perspective the demand for beds in the intensive care unit has diminished, since some of the patients could be directly transferred to the pneumology ward in our hospital.
There are some limitations to this study – especially its observational and retrospective nature. We cannot rule out a selection bias and also the time between BGA and measurement of PtCO2 at baseline was not standardised. However, as a result of a high degree of adherence to a standardised NIV protocol in the ED in our hospital, we are optimistic that we have provided sufficient data quality for the current analysis. This is a single-centre study and we used only one type of sensor device, which limits the transferability of the results to other centres or other transcutaneous measurement devices.
Transcutaneous PCO2 monitoring shows a good concordance with PaCO2 and is a reliable, feasible, patient-friendly and safe alternative to repeated blood gas analysis for patients with severe hypoxaemic and/or hypercapnic respiratory failure receiving emergency NIV in the ED. In addition, it can be used to adapt NIV settings in real time. An initial BGA to evaluate the respiratory and metabolic state and to rule out a significant discrepancy compared with the transcutaneous measurement is recommended.
1 Giner J, Casan P, Belda J, González M, Miralda RM, Sanchis J. Pain during arterial puncture. Chest. 1996;110(6):1443–5. doi:http://dx.doi.org/10.1378/chest.110.6.1443. PubMed
2 Gillies ID, Morgan M, Sykes MK, Brown AE, Jones NO. The nature and incidence of complications of peripheral arterial puncture. Anaesthesia. 1979;34(5):506–9. doi:http://dx.doi.org/10.1111/j.1365-2044.1979.tb06332.x. PubMed
3 Storre JH, Magnet FS, Dreher M, Windisch W. Transcutaneous monitoring as a replacement for arterial PCO(2) monitoring during nocturnal non-invasive ventilation. Respir Med. 2011;105(1):143–50. doi:http://dx.doi.org/10.1016/j.rmed.2010.10.007. PubMed
4 Storre JH, Steurer B, Kabitz H-J, Dreher M, Windisch W. Transcutaneous PCO2 monitoring during initiation of noninvasive ventilation. Chest. 2007;132(6):1810–6. doi:http://dx.doi.org/10.1378/chest.07-1173. PubMed
5 Maniscalco M, Zedda A, Faraone S, Carratù P, Sofia M. Evaluation of a transcutaneous carbon dioxide monitor in severe obesity. Intensive Care Med. 2008;34(7):1340–4. doi:http://dx.doi.org/10.1007/s00134-008-1078-8. PubMed
6 McVicar J, Eager R. Validation study of a transcutaneous carbon dioxide monitor in patients in the emergency department. Emerg Med J. 2009;26(5):344–6. doi:http://dx.doi.org/10.1136/emj.2007.055715. PubMed
7 Delerme S, Montout V, Goulet H, Arhan A, Le Saché F, Devilliers C, et al. Concordance between transcutaneous and arterial measurements of carbon dioxide in an ED. Am J Emerg Med. 2012;30(9):1872–6. doi:http://dx.doi.org/10.1016/j.ajem.2012.03.033. PubMed
8 Nicolini A, Ferrari MB. Evaluation of a transcutaneous carbon dioxide monitor in patients with acute respiratory failure. Ann Thorac Med. 2011;6(4):217–20. doi:http://dx.doi.org/10.4103/1817-1737.84776. PubMed
9 Heuss LT, Chhajed PN, Schnieper P, Hirt T, Beglinger C. Combined pulse oximetry/cutaneous carbon dioxide tension monitoring during colonoscopies: pilot study with a smart ear clip. Digestion. 2004;70(3):152–8. doi:http://dx.doi.org/10.1159/000081515. PubMed
10 Chhajed PN, Kaegi B, Rajasekaran R, Tamm M. Detection of hypoventilation during thoracoscopy: combined cutaneous carbon dioxide tension and oximetry monitoring with a new digital sensor. Chest. 2005;127(2):585–8. doi:http://dx.doi.org/10.1378/chest.127.2.585. PubMed
11 Chhajed PN, Rajasekaran R, Kaegi B, Chhajed TP, Pflimlin E, Leuppi J, et al. Measurement of combined oximetry and cutaneous capnography during flexible bronchoscopy. Eur Respir J. 2006;28(2):386–90. doi:http://dx.doi.org/10.1183/09031936.06.00088005. PubMed
12 Schafroth Török S, Leuppi JD, Baty F, Tamm M, Chhajed PN. Combined oximetry-cutaneous capnography in patients assessed for long-term oxygen therapy. Chest. 2008;133(6):1421–5. doi:http://dx.doi.org/10.1378/chest.07-0960. PubMed
13 Bobbia X, Claret P-G, Palmier L, Robert M, Grandpierre RG, Roger C, et al. Concordance and limits between transcutaneous and arterial carbon dioxide pressure in emergency department patients with acute respiratory failure: a single-center prospective observational study. Scand J Trauma Resusc Emerg Med. 2015;23(1):40. doi:http://dx.doi.org/10.1186/s13049-015-0120-4. PubMed. Erratum in: Scand J Trauma Resusc Emerg Med. 2015 Oct 6;23:77. doi:10.1186/s13049-015-0154-7. PMID 26572985
14 Kim J-Y, Yoon Y-H, Lee S-W, Choi S-H, Cho Y-D, Park S-M. Accuracy of transcutaneous carbon dioxide monitoring in hypotensive patients. Emerg Med J. 2014;31(4):323–6. doi:http://dx.doi.org/10.1136/emermed-2012-202228. PubMed
15 Kelly A-M, Klim S. Agreement between arterial and transcutaneous PCO2 in patients undergoing non-invasive ventilation. Respir Med. 2011;105(2):226–9. doi:http://dx.doi.org/10.1016/j.rmed.2010.11.010. PubMed
16 Janssens JP, Howarth-Frey C, Chevrolet JC, Abajo B, Rochat T. Transcutaneous PCO2 to monitor noninvasive mechanical ventilation in adults: assessment of a new transcutaneous PCO2 device. Chest. 1998;113(3):768–73. doi:http://dx.doi.org/10.1378/chest.113.3.768. PubMed
17 van Oppen JD, Daniel PS, Sovani MP. What is the potential role of transcutaneous carbon dioxide in guiding acute noninvasive ventilation? Respir Care. 2015;60(4):484–91. doi:http://dx.doi.org/10.4187/respcare.03335. PubMed
18 Kelly A-M, McAlpine R, Kyle E. Venous pH can safely replace arterial pH in the initial evaluation of patients in the emergency department. Emerg Med J. 2001;18(5):340–2. doi:http://dx.doi.org/10.1136/emj.18.5.340. PubMed
19 Kelly A-M, Kerr D, Middleton P. Validation of venous pCO2 to screen for arterial hypercarbia in patients with chronic obstructive airways disease. J Emerg Med. 2005;28(4):377–9. doi:http://dx.doi.org/10.1016/j.jemermed.2004.10.017. PubMed
20 Lemoël F, Govciyan S, El Omri M, Marquette C-H, Levraut J. Improving the validity of peripheral venous blood gas analysis as an estimate of arterial blood gas by correcting the venous values with SvO2. J Emerg Med. 2013;44(3):709–16. doi:http://dx.doi.org/10.1016/j.jemermed.2012.07.041. [A]. PubMed
21 Schönhofer B, Kuhlen R, Neumann P, Westhoff M, Berndt C, Sitter H. Nichtinvasive Beatmung als Therapie der akuten respiratorischen Insuffizienz1 [Non-invasive mechanical ventilation in acute respiratory failure]. Pneumologie. 2008;62(8):449–79. German. PubMed
22 Bland JM, Altman DG. Statistical methods for assessing agreement between two methods of clinical measurement. Lancet. 1986;1(8476):307–10. doi:http://dx.doi.org/10.1016/S0140-6736(86)90837-8. PubMed
23 R-project.org. [homepage on the internet]. Vienna: R Foundation for Statistical Computing R Core Team (2015). [updated 2015 December 12; cited 2015 December 14]. Available from: www.R-project.org
24 Hinkelbein J, Floss F, Denz C, Krieter H. Accuracy and precision of three different methods to determine Pco2 (Paco2 vs. Petco2 vs. Ptcco2) during interhospital ground transport of critically ill and ventilated adults. J Trauma. 2008;65(1):10–8. doi:http://dx.doi.org/10.1097/TA.0b013e31815eba83. PubMed
25 Wimberley PD, Grønlund Pedersen K, Olsson J, Siggaard-Andersen O. Transcutaneous carbon dioxide and oxygen tension measured at different temperatures in healthy adults. Clin Chem. 1985;31(10):1611–5. PubMed
Disclosure statement:No financial support and no other potential conflict of interest relevant to this article was reported. This study was funded by the Lungenliga St. Gallen and institutional research funds.
We thank Anne-Kathrin Brill, MD, University Hospital and University of Bern, Department of Pneumology for critical review of the manuscript.