Figure 1
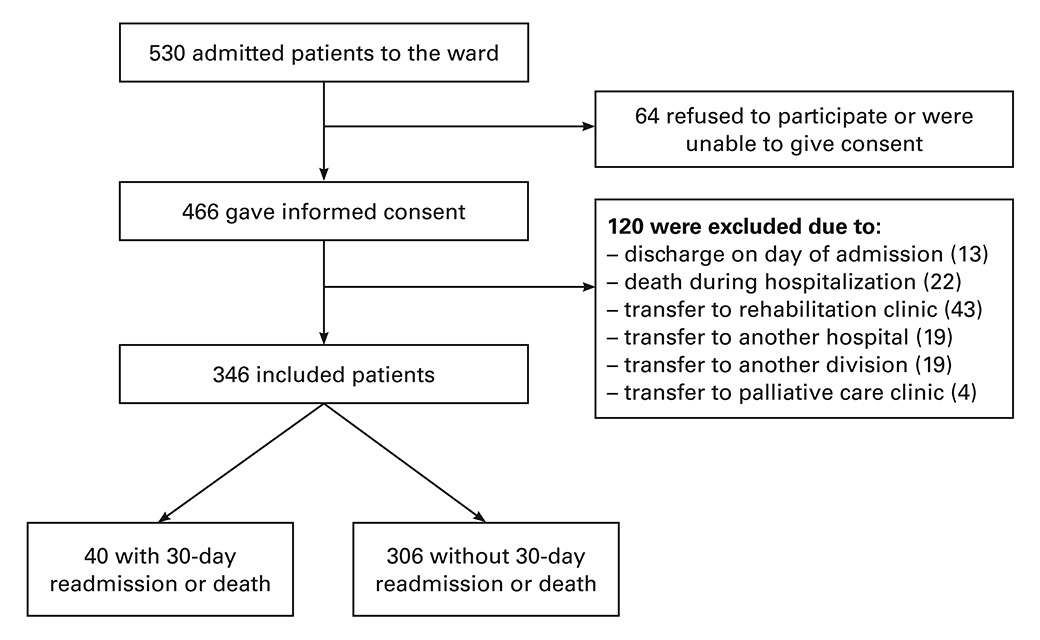
Study recruitment and outcome.
DOI: https://doi.org/10.4414/smw.2016.14335
Readmissions after an acute care hospitalisation are frequent and associated with significant burden for patients and healthcare systems. Overall, 14–22% of the patients are readmitted within 30 days after discharge from an acute care hospitalisation [1–3]. A recent systematic review showed that interventions could reduce rates of readmission, but also that the most successful interventions are the most complex ones [4]. Therefore, to be efficient, we need to target these intensive discharge interventions to the patients with a high risk of readmission. However, clinical providers are not able to identify accurately which patients are at high risk for readmission [5].
The HOSPITAL score has been shown to identify accurately medical patients at high risk for 30-day readmission and is currently one of the best validated readmission prediction models, with good performance shown in five countries and nearly 150 000 patients [1, 6, 7]. The score consists of seven variables readily available at discharge, and allows stratification of the patients before hospital discharge into three categories of risk for readmission. The HOSPITAL score has yet not been validated prospectively. A prospective validation study is an essential step in the level of evidence [8–10]. It also demonstrates the performance of the score and its practicability in real life. Moreover, this study would inform about the validity of the score in another population outside a tertiary care hospital (generalisability). We aimed, therefore, to assess the performance of the HOSPITAL score using a prospective cohort of medical patients in Switzerland.
We conducted a prospective cohort study between 8 April and 23 September 2013. We included all consecutive patients aged ≥50 years admitted to three of seven divisions of the department of general internal medicine of the Fribourg Cantonal Hospital (115 beds, 4400 admissions/year). The patient was the unit and was included only once. We excluded patients who refused or were unable to give informed consent, who died during hospitalisation or who were transferred to another acute care, rehabilitation or palliative care facility. We aimed to include 350 patients. The study was approved by the local ethics committee and follows the criteria from the “Transparent reporting of a multivariable prediction model for individual prognosis or diagnosis” (TRIPOD) initiative [11].
The primary outcome was the first unplanned readmission and/or death within 30 days after the index hospital discharge. Unplanned readmission was defined as emergent or urgent, i.e., not scheduled in advance for treatment or investigation. We contacted all patients by telephone 6 months after the first hospital discharge to identify the first readmission and/or death. For patients who could not be reached after several phone call attempts, we called the primary care physician, family members, close relations, or the nursing home, as available. Additionally, electronic patients’ files were checked for any readmission or death within Fribourg Hospital Network, which includes three acute care centres (Fribourg, Riaz, Tavel).
“HOSPITAL” is the acronym for the seven variables included in the score (table 1) [1]: Haemoglobin at discharge (positive if <120 g/l), discharge from an Oncology service, Sodium level at discharge (positive if <135 mmol/l), any Procedure performed during the index hospitalization (i.e. any International Classification of Disease [ICD] coded procedure), Index admission Type (positive if emergent or urgent as opposed to elective), number of Admissions in the previous 12 months (0 point for 0–1 admission, 2 points for 2–5 admissions, and 5 points for >5 admissions), and Length of stay (positive if ≥5 days). Some of the predictors were adapted according to the study setting for practical reasons, before the start of patient inclusion. Because the hospital had no specific oncology division, the variable “discharge from an oncology service” was replaced by “active oncological diagnosis on admission or during hospitalisation” (i.e. in the past 5 years, including metastatic and nonmetastatic solid tumors and haematological malignancies). The following procedures were considered: coronary angiography, angioplasty, thromboaspiration, stenting, pacemaker implantation, transoesophagal echocardiography, oesogastroduodenoscopy, endoscopic retrograde cholangio-pancreatography, colonoscopy, bronchoscopy, biopsy, thoracocentesis, lumbar puncture, paracentesis, chemotherapy, radiotherapy, continuous pressure ventilation, intubation, transfusion (blood or platelets), graft, dialysis, operation, suture, electro-neuromyography, joint aspiration, cystoscopy, bone marrow aspiration/biopsy, magnetic resonance imaging, computed tomography, angiography, positron emission tomography, scintigraphy. Because the mean length of hospital stay is longer in Switzerland [12] than in the USA [13], where the score was originally developed, the cut-off for the variable “length of stay” was increased from ≥5 to ≥8 days, in order to have the same proportion of patients receiving one point for this variable. As we recorded admissions in the past 6 months, and not in the past 12 months as originally, the categories were adapted accordingly as follows: 0 point for 0 admission, 2 points for 1–2 admission(s), and 5 points for >2 admissions. For haemoglobin and sodium levels, a blood sample was collected within 24 hours before discharge. We imputed 0 point (= normal) for missing values. Sodium and haemoglobin were missing for 2 (0.6%) and 3 (0.9%) patients, respectively. Other variables used in the score and outcome data were available for all the included patients. The scoring system ranges from a minimum of 0 point to a maximum of 13 points, with a risk of 30-day unplanned readmission that increases with the number of points.
We compared the performance of the HOSPITAL score with another score developed in Canada, in order to evaluate whether the HOSPITAL score has better generalisability than another prediction model [14]. We chose the LACE score because it is one of the best known scores besides the HOSPITAL score, even though validation studies are lacking outside Canada. The LACE index was calculated according to the original derivation study [14]. The LACE index includes the following variables: length of stay, admission mode, Charlson comorbidity index score and number of visits to the emergency department during the last 6 months.
Causes of readmission and death were determined based on the patients’ or their primary care physicians’ information, as available, when readmission or death was outside Fribourg Hospital Network.
Categorical variables were described as frequency (percentage) and continuous variables as mean (standard deviation [SD]) or median (interquartile range [IQR]), as appropriate.
The total number of points of the HOSPITAL score was calculated for each hospital discharge and used to create three categories of risk for 30-day unplanned readmission or death: low risk if 0 to 4 point(s), intermediate risk if 5 or 6 points, and high risk if 7 or more points. The predicted risk of 30-day unplanned readmission or death was estimated according to the HOSPITAL score for each of these three categories.
The performance of the score was assessed using the following measures:
1. The overall accuracy of the score was assessed with the Brier score, which evaluates how close predicted rates are to the observed rates [15, 16]; the lower the Brier score, the better the prediction model, with a value <0.25 indicating a useful model [17].
2. The discrimination power of the score was tested with the C-statistic, which assesses the capacity of the score to discriminate between cases and non-cases, according to sensitivity and specificity of the model [18, 19].
3. The calibration of the score was tested using the Hosmer-Lemeshow goodness-of-fit statistic, which evaluates how the model can produce probabilities matching the actual rates of outcome [16]; a p ≥0.05 reflects good fit, and the higher the p-value, the better the fit.
For each category of risk described above (low, intermediate, high), the calibration of the score was examined by comparing the observed rates of 30-day unplanned readmission or death with the estimated risks according to the HOSPITAL score.
We also looked at the performance of a simplified version of the HOSPITAL score that excluded the variable “procedure performed during the index hospitalisation”. This variable was among the least significant variables in the previous validation studies [1, 7], and might be more difficult to capture prospectively than the others.
All tests were conducted as two-sided at a 0.05 level of significance. All analyses were performed with STATA release 12.1 (StataCorp LP, College Station, Texas).
| Table 1:HOSPITAL score for 30-day unplanned readmissions, as developed originally (maximum score: 13 points) [1]. | ||
| Attribute | Value | Points |
| Low Haemoglobin level at discharge (<120 g/l) | Yes | 1 |
| Discharge from an Oncology service | Yes | 2 |
| Low Sodium level at discharge (<135 mmol/l) | Yes | 1 |
| Procedure during the index hospitalisation | Yes | 1 |
| Index admission Type: urgent or emergent (nonelective) | Yes | 1 |
| Number of hospital Admission(s) during the previous year | 0–1 | |
| 2–5 | 2 | |
| >5 | 5 | |
| Length of stay ≥5 days | Yes | 2 |
During the study period, we included 346 consecutive discharged patients (fig. 1), among whom 40 (11.6%) were readmitted or died within 30 days. Among them, 37 had an unplanned readmission and 5 died (2 died after being readmitted). Baseline characteristics of the study population, according to the occurrence or absence of 30-day readmission or death, are reported in table 2. Mean age of the patients was 73.4 years (SD 11.5), and median length of stay 7 days (IQR 4–12). Comparison of the baseline characteristics between the derivation study and the current study are in the appendix (supplementary table S1).
Figure 1
Study recruitment and outcome.
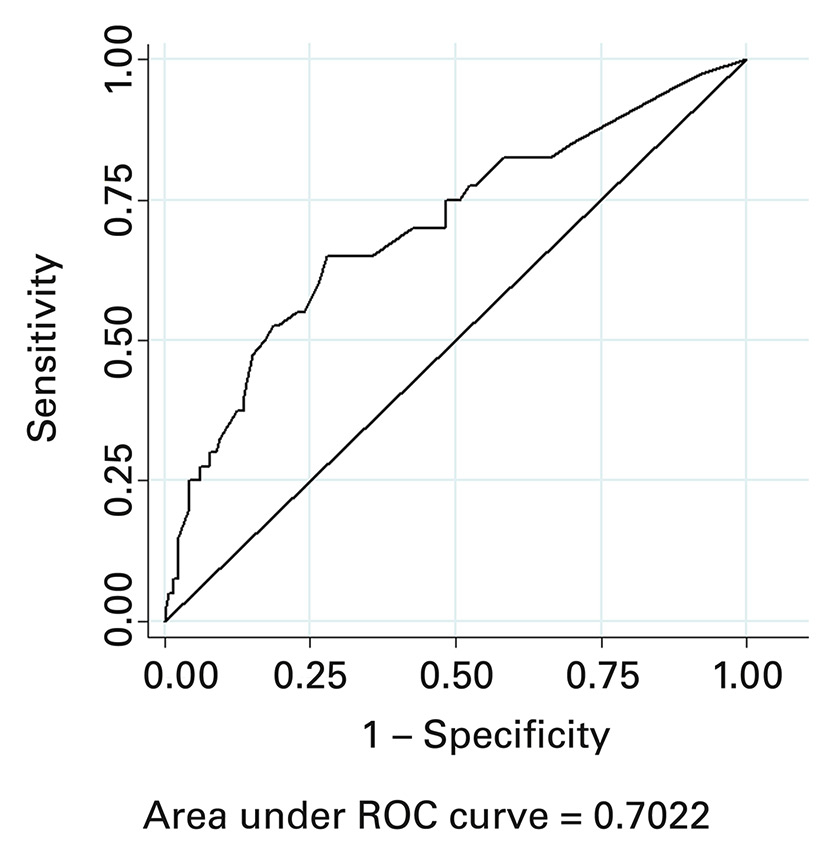
Figure 2
Receiver operating characteristic (ROC) curve for readmission or death within 30 days after hospital discharge.
According to the HOSPITAL score, 59.0% of the patients were classified at low risk, 20.8% at intermediate risk, and 20.2% at high risk of 30-day unplanned readmission or death. The estimated risks of 30-day readmission or death were 8.2% for low-risk patients, 11.3% for intermediate-risk patients and 21.6% for high-risk patients (table 3, supplementary table S2). The p-value of the Hosmer-Lemeshow goodness-of-fit statistic was 0.77, indicating excellent calibration. The low Brier score of 0.10 indicated a very good overall accuracy of the score and the C-statistic of 0.70 (95% confidence interval [CI] 0.62–0.79) indicated a good discriminatory power (fig. 2). When taking only the outcome of unplanned readmission without death, the C-statistic was 0.68 (95% CI 0.60–0.77).
The simplified score excluding the variable “procedure performed during the index hospitalisation” showed the same performance, with a Brier score of 0.10, a C-statistic of 0.70 (95% CI 0.61–0.79), and a goodness-of-fit statistic of 0.40.
Only 4.6% (n = 16) of the patients were classified at low risk for readmission according to the LACE index. The C-statistic of the LACE index was 0.56 (95% CI 0.46–0.66). The calibration was, however, good with a p-value for Hosmer-Lemeshow goodness-of-fit statistic of 0.88.
The most common primary diagnoses at admission were cardiovascular disorders (26.6%), infectious disorders (20.2%) and neurological and psychiatric disorders (19.0%). Among the patients who presented the primary outcome, 10 were readmitted for cancer, 7 for an infectious disorder and 5 for a respiratory disorder, while 3 died of cancer and 2 of respiratory disorder.
| Table 2: Baseline characteristics of the study population stratified according to the occurrence or absence of readmission or death within 30 days after discharge. | |||
| Clinical characteristics | Entire cohort (n = 346) | Without 30-day readmission/death (n = 306) | With 30-day readmission/death (n = 40) |
| Age, mean (SD) | 73.4 (11.5) | 73.3 (11.7) | 71.2 (10.1) |
| Male gender, n (%) | 172 (49.7) | 151 (49.4) | 21 (52.5) |
| Charlson comorbidity index, mean (SD) | 6.9 (2.8) | 6.7 (2.7) | 8.1 (3.2) |
| Urgent or emergent index admission, n (%) | 333 (96.2) | 295 (96.4) | 38 (95.0) |
| Oncology diagnosis, n (%) | 83 (24.0) | 65 (21.2) | 18 (45.0) |
| Length of stay of the index hospitalisation ≥8 days, n (%) | 160 (46.2) | 142 (46.4) | 18 (45.0) |
| Number of hospital admissions in the past 6 months, n (%) | |||
| 0 | 248 (71.7) | 225 (73.5) | 23 (57.5) |
| 1–2 | 83 (24.0) | 72 (23.5) | 11 (27.5) |
| >2 | 15 (4.3) | 9 (2.9) | 6 (15.0) |
| ≥1 procedure during the index hospitalisation, n (%) | 248 (71.7) | 219 (71.6) | 29 (72.5) |
| Low haemoglobin level at discharge (<120 g/l), n (%) | 152 (43.9) | 128 (41.8) | 24 (60.0) |
| Low sodium level at discharge (<135 mmol/l), n (%) | 36 (10.4) | 30 (9.8) | 6 (15.0) |
| SD = standard deviation | |||
| Table 3:Observed proportions versus estimated risk of 30-day unplanned readmission or death. | ||||
| Points* | Risk category | Number of patients in each category n (%) | Observed proportion with readmission or death in the validation study % | Estimated risk of readmission or death in the validation study using the HOSPITAL score % |
| 0–4 | Low | 204 (59.0) | 9.8 | 8.2 |
| 5–6 | Intermediate | 72 (20.8) | 8.3 | 11.3 |
| ≥7 | High | 70 (20.2) | 20.0 | 21.6 |
| * According to the HOSPITAL score [1]. | ||||
In this study including 346 adult medical patients, we prospectively and externally validated the HOSPITAL score for predicting 30-day unplanned readmission or death. The score showed good performance, with a very good overall accuracy (Brier score 0.10), a good discriminatory power (C-statistic 0.70) and an excellent calibration (p-value for Hosmer-Lemeshow goodness-of-fit test 0.77). Among the 20.2% patients classified at high risk of unplanned readmission or death within 30 days after discharge, 21.6% were identified as at risk of readmission or death, and 20.0% were actually readmitted and/or died. The HOSPITAL score also had performed better than the LACE index in this population.
We observed an 11.6% (40/346) rate of unplanned readmission or death, which is consistent with previous data [1, 3, 20]. Although our study population characteristics were different from the original derivation and validation study, the performance of the HOSPITAL score was similar, which indicates a very good generalisability of the score. Our study population was older (mean age 73.4 vs 61.3 years), had more nonelective admissions (96 vs 87%), had fewer patients with at least one procedure performed during the index hospitalisation (40 vs 72%), had less anaemia at discharge (44 vs 61%), and had more patients with a negative history of hospitalisation before index admission (72% vs 47% in the original study, although the timeframe was different). As expected, the length of stay was longer in our study (73% were hospitalised for more than 4 days, vs 44% in the original study), which is consistent with previous data showing that hospital stay is longer in Switzerland than in the USA [1, 12, 13], and supports the need to adapt the points imputed for the variable “length of stay” according to the country. In terms of calibration, the absolute proportions in each risk group were somewhat different from the original study (59 % vs 49%, 21% vs 26% and 20% vs 24% in the low-, intermediate-, and high-risk categories, respectively). However, the overall concordance within each decile was excellent, as shown by the Hosmer-Lemeshow goodness-of-fit statistic. Despite these differences between our study and the original study, we found a similar discriminatory power (0.70 vs 0.71), and a better goodness-of-fit than in the original study (p = 0.77 vs p = 0.15). We may therefore assume a wide generalisability of the HOSPITAL score to different patient populations and settings, as differences in the proportions of patients presenting the different items of the score did not invalidate its performance.
Previous studies associated cancer with hospital readmission [21–23]. In the derivation study of the HOSPITAL score also, being discharged from an oncology service was associated with a high risk of unplanned readmission [1]. Although a diagnosis of cancer was significantly associated with 30-day readmission in the original derivation study, the choice of “discharge from an oncology division” was made because this variable could be easier to collect than a diagnosis of cancer. However, not all hospitals have an oncology division, and we showed here that the diagnosis of a recent cancer can also be used instead of the oncology division. We also showed in our population that the variable “any procedure performed during the hospital stay” may be left out if difficult to collect, without reducing the score performance. The discrimination power was indeed identical with or without this variable (C-statistic 0.70) in our study. This simplified version of the HOSPITAL score may allow wider and easier implementation in everyday clinical practice.
The HOSPITAL score has several advantages. First, it performs overall better than most of the previously derived scores [24]. In this study, we also showed that the LACE score had a lower discriminatory power in comparison with the HOSPITAL score (C-statistic 0.56 vs 0.70). The superiority of the HOSPITAL score in comparison with the LACE score has also been recently showed in two hospitals in Denmark [6]. Second, it can be applied to any medical patient, regardless of the main diagnosis, as opposed to scores derived for specific diseases only [25–28]. Third, the predictors used to calculate the score are easily available before discharge. Fourth, it predicts the outcome within 30 days after discharge; we can indeed suppose that readmissions and deaths within a longer time frame may be less closely related to the index hospitalisation. Finally, after having been largely validated retrospectively in five countries and nearly 150 000 patients [7], it has been now validated prospectively.
This study had some strengths. First, we recorded readmissions that occurred within any hospital and not only inside our hospital network. Second, we also recorded deaths occurring after discharge, hypothesising that patients who died might have been readmitted if they had not died. Third, we had no missing data for the outcome of interest, and only very few missing data for the variables included in the score. Finally, all variables were recorded prospectively, which demonstrates the practicability of the score in real-life, and provides a high evidence level to the prediction model [8].
We must, however, mention some limitations. First, the sample size was relatively small and the study was conducted at a single centre. Second, unplanned readmissions were not defined according to a validated algorithm, but to hospital or patient reports only. Third, we had no oncology service and recorded hospitalisation during the past 6 months only, and therefore had to slightly adapt the score accordingly; however, it obviously did not distort the performance of the score. Finally, as a result of the prospective design, the outcome of readmission was based on patient-reported hospital outcomes. On one hand, the prospective study design allowed us to contact all participants in order to capture all first readmissions to any hospital as mentioned above. This is a major advantage in comparison with a retrospective study design where only readmissions to the same hospital can be typically captured. On the other hand, the patients might not remember all the events.
In this prospective study, we validated the good performance of the HOSPITAL score to predict unplanned readmissions and deaths within 30 days after hospital discharge in medical patients. This score uses predictors that are readily available before discharge and could, therefore, be easily implemented in the daily clinical practice. The HOSPITAL score may help clinicians to target more intensive transitional care interventions at the patients who are most likely to benefit, in order to efficiently reduce the negative burden of readmission.
| Table S1:Comparison of the baseline characteristics between the original derivation study in the USA and the prospective external validation study in Switzerland. | ||||||
| Clinical characteristics | Entire original cohort (n = 9212) | Without 30-day PAR in the original derivation cohort (n = 5553) | With 30-day PAR in the original derivation cohort (n = 588) | Entire cohort (n = 346) | Without 30-day readmission/death (n = 306) | With 30-day readmission/death (n = 40) |
| Age, mean (SD) | 61.3 | NA | NA | 73.4 (11.5) | 73.3 (11.7) | 71.2 (10.1) |
| Male gender, n (%) | 4476 (48.6) | 2652 (47.8) | 282 (48.0) | 172 (49.7) | 151 (49.4) | 21 (52.5) |
| Charlson comorbidity index, mean (SD) | NA | NA | NA | 6.9 (2.8) | 6.7 (2.7) | 8.1 (3.2) |
| Urgent or emergent index admission, n (%) | 8021 (87.1) | 4817 (86.7) | 524 (89.1) | 333 (96.2) | 295 (96.4) | 38 (95.0) |
| Oncology diagnosis, n (%) | 2192 (23.8) | 1204 (21.7) | 232 (39.5) | 83 (24.0) | 65 (21.2) | 18 (45.0) |
| Long length of stay of the index hospitalization, n (%) | 4031 (43.8) | 2301 (41.1) | 329 (56.0) | 160 (46.2) | 142 (46.4) | 18 (45.0) |
| Number of hospital admissions in the past year (original study) / past 6 months (validation study), n (%) | ||||||
| 0 | 4321 (46.9) | 2698 (48.6) | 178 (30) | 248 (71.7) | 225 (73.5) | 23 (57.5) |
| 1–5 / 1–2 | 4456 (48.4) | 2629 (47.3) | 344 (58.5) | 83 (24.0) | 72 (23.5) | 11 (27.5) |
| >5 / >2 | 435 (4.7) | 226 (4.1) | 66 (11) | 15 (4.3) | 9 (2.9) | 6 (15.0) |
| ≥1 procedure during the index hospitalisation, n (%) | 5576 (60.5) | 3290 (59.2) | 411 (69.9) | 248 (71.7) | 219 (71.6) | 29 (72.5) |
| Low haemoglobin level at discharge (< 120 g/l), n (%) | 5626 (61.1) | 3761 (61.2) | 481 (81.8) | 152 (43.9) | 128 (41.8) | 24 (60.0) |
| Low sodium level at discharge (< 135 mmol/l), n (%) | 1454 (15.8) | 832 (15.0) | 137 (23) | 36 (10.4) | 30 (9.8) | 6 (15.0) |
| NA = not available; PAR = potentially avoidable readmission; SD = standard deviation | ||||||
| Table S2:Comparison between the observed proportions versus estimated risk of readmission in the original derivation study and the prospective external validation study. | |||||||
| Points* | Risk category | Number of patients in each category in the derivation study n (%) | Observed proportion with readmission or death in the derivation study % | Estimated risk of readmission or death in the derivation study using the HOSPITAL score % | Number of patients in each category n (%) | Observed proportion with readmission or death in the validation study % | Estimated risk of readmission or death in the validation study using the HOSPITAL score % |
| 0–4 | Low | 3027 (49.3) | 5.4 | 5.2 | 204 (59.0) | 9.8 | 8.2 |
| 5–6 | Intermediate | 1617 (26.3) | 9.0 | 9.8 | 72 (20.8) | 8.3 | 11.3 |
| ≥7 | High | 1497 (24.4) | 18.7 | 18.3 | 70 (20.2) | 20.0 | 21.6 |
| * According to the HOSPITAL score | |||||||
1 Donzé J, Aujesky D, Williams D, Schnipper JL. Potentially avoidable 30-day hospital readmissions in medical patients: derivation and validation of a prediction model. JAMA Intern Med. 2013;173(8):632–8.
2 Donzé J, Lipsitz S, Bates DW, Schnipper JL. Causes and patterns of readmissions in patients with common comorbidities: retrospective cohort study. BMJ. 2013;347:f7171.
3 Jencks SF, Williams MV, Coleman EA. Rehospitalizations among patients in the Medicare fee-for-service program. N Engl J Med. 2009;360(14):1418–28.
4 Leppin AL, Gionfriddo MR, Kessler M, Brito JP, Mair FS, Gallacher K, et al. Preventing 30-day hospital readmissions: a systematic review and meta-analysis of randomized trials. JAMA Intern Med. 2014;174(7):1095–107.
5 Allaudeen N, Schnipper JL, Orav EJ, Wachter RM, Vidyarthi AR. Inability of providers to predict unplanned readmissions. J Gen Intern Med. 2011;26(7):771–6.
6 Cooksley T, Nanayakkara PW, Nickel CH, Subbe CP, Kellett J, Kidney R, et al. Readmissions of medical patients: an external validation of two existing prediction scores. QJM. 2015.
7 Donze JD, Williams MV, Robinson EJ, Zimlichman E, Aujesky D, Vasilevskis EE, et al. International Validity of the HOSPITAL Score to Predict 30-Day Potentially Avoidable Hospital Readmissions. JAMA Intern Med. 2016;176(4):496–502.
8 McGinn TG, Guyatt GH, Wyer PC, Naylor CD, Stiell IG, Richardson WS. Users’ guides to the medical literature: XXII: how to use articles about clinical decision rules. Evidence-Based Medicine Working Group. JAMA. 2000;284(1):79–84.
9 Laupacis A, Sekar N, Stiell IG. Clinical prediction rules. A review and suggested modifications of methodological standards. JAMA. 1997;277(6):488–94.
10 Justice AC, Covinsky KE, Berlin JA. Assessing the generalizability of prognostic information. Ann Intern Med. 1999;130(6):515–24.
11 Collins GS, Reitsma JB, Altman DG, Moons KGM. Transparent Reporting of a multivariable prediction model for Individual Prognosis or Diagnosis (TRIPOD): the TRIPOD statement. Ann Intern Med. 2015;162(1):55–63.
12 Thommen D, Weissenberger N, Schuetz P, Mueller B, Reemts C, Holler T, et al. Head-to-head comparison of length of stay, patients’ outcome and satisfaction in Switzerland before and after SwissDRG-Implementation in 2012 in 2012: an observational study in two tertiary university centers. Swiss Med Wkly. 2014;144:w13972.
13 Agency for Healthcare R, Quality. Healthcare Cost and Utilization Project (HCUP), National Inpatient Sample (NIS) 2004–2013, Trends in Inpatient Stays. 2013.
14 van Walraven C, Dhalla IA, Bell C, Etchells E, Stiell IG, Zarnke K, et al. Derivation and validation of an index to predict early death or unplanned readmission after discharge from hospital to the community. CMAJ. 2010;182(6):551–7.
15 Khudyakov P, Gorfine M, Zucker D, Spiegelman D. The impact of covariate measurement error on risk prediction. Stat Med. 2015;34(15):2353–67.
16 Steyerberg EW, Vickers AJ, Cook NR, Gerds T, Gonen M, Obuchowski N, et al. Assessing the performance of prediction models: a framework for traditional and novel measures. Epidemiology. 2010;21(1):128–38.
17 Arkes HR, Dawson NV, Speroff T, Harrell FE, Jr., Alzola C, Phillips R, et al. The covariance decomposition of the probability score and its use in evaluating prognostic estimates. SUPPORT Investigators. Med Decis Making. 1995;15(2):120–31.
18 Hanley JA, McNeil BJ. The meaning and use of the area under a receiver operating characteristic (ROC) curve. Radiology. 1982;143(1):29–36.
19 Pencina MJ, D’Agostino RB. Evaluating Discrimination of Risk Prediction Models: The C Statistic. JAMA. 2015;314(10):1063–4.
20 Halfon P, Eggli Y, van Melle G, Chevalier J, Wasserfallen JB, Burnand B. Measuring potentially avoidable hospital readmissions. J Clin Epidemiol. 2002;55(6):573–87.
21 Allaudeen N, Vidyarthi A, Maselli J, Auerbach A. Redefining readmission risk factors for general medicine patients. J Hosp Med. 2011;6(2):54–60.
22 Phillips RS, Safran C, Cleary PD, Delbanco TL. Predicting emergency readmissions for patients discharged from the medical service of a teaching hospital. J Gen Intern Med. 1987;2(6):400–5.
23 Silverstein MD, Qin H, Mercer SQ, Fong J, Haydar Z. Risk factors for 30-day hospital readmission in patients ≥65 years of age. Proc (Bayl Univ Med Cent). 2008;21(4):363–72.
24 Kansagara D, Englander H, Salanitro A, Kagen D, Theobald C, Freeman M, et al. Risk Prediction Models for Hospital Readmission: A Systematic Review. JAMA. 2011;306(15):1688–98.
25 Aujesky D, Mor MK, Geng M, Stone RA, Fine MJ, Ibrahim SA. Predictors of early hospital readmission after acute pulmonary embolism. Arch Intern Med. 2009;169(3):287–93.
26 Desai MM, Stauffer BD, Feringa HH, Schreiner GC. Statistical models and patient predictors of readmission for acute myocardial infarction: a systematic review. Circ Cardiovasc Qual Outcomes. 2009;2(5):500–7.
27 Hammill BG, Curtis LH, Fonarow GC, Heidenreich PA, Yancy CW, Peterson ED, et al. Incremental value of clinical data beyond claims data in predicting 30-day outcomes after heart failure hospitalization. Circ Cardiovasc Qual Outcomes. 2011;4(1):60–7.
28 Ross JS, Mulvey GK, Stauffer B, Patlolla V, Bernheim SM, Keenan PS, et al. Statistical models and patient predictors of readmission for heart failure: a systematic review. Arch Intern Med. 2008;168(13):1371–86.
Authors contribution: Dr Aubert had full access to all of the data in the study, takes responsibility for the integrity of the data and the accuracy of the data analysis and is the guarantor. Study concept and design: Aubert, Donzé, Hayoz, Mancinetti. Acquisition of data: Aubert, Folly, Mancinetti. Analysis and interpretation of data: Aubert, Donzé. Drafting of the manuscript: Aubert, Donzé. Critical revision of the manuscript for important intellectual content: Folly, Hayoz, Mancinetti. Statistical analysis: Aubert, Donzé.
Disclosure statement:The study was funded by a research fund from the Internal Medicine Department, HFR Fribourg Cantonal Hospital, which had no role in the study design, decision to publish, or preparation of the manuscript.