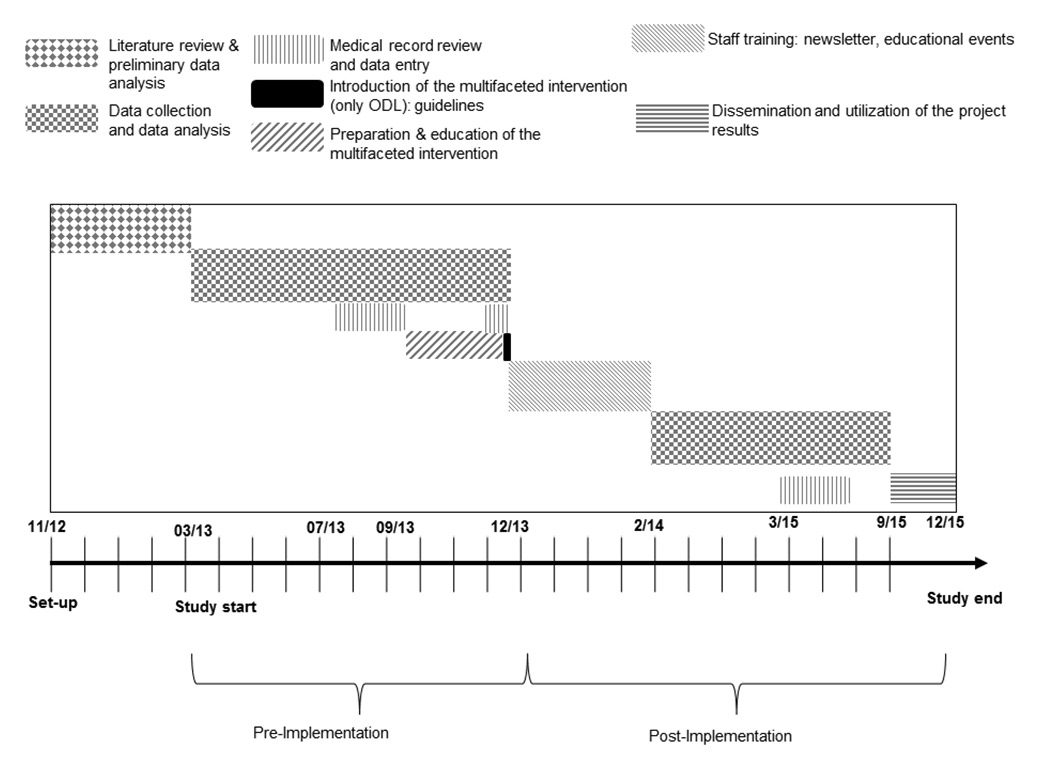
Figure 1
Study design.
ODL = Ospedale Regionale di Locarno
DOI: https://doi.org/10.4414/smw.2016.14320
An educational, multicentre, controlled, before-and-after study
A low serum potassium concentration is the most common electrolyte abnormality encountered in clinical practice. Hypokalaemia is found in over 20% of hospitalised patients and is associated with morbidity and mortality [1–8]. The majority of these patients have mild hypokalaemia, but as many as one quarter have serum potassium concentrations below 3.0 mmol/l [1]. Pharmacotherapy, particularly diuretic therapy, is the main risk factor for the development of hypokalaemia [2, 7, 9–10]. As many as 10 to 40% of patients treated with thiazide diuretics have indeed been found to have this electrolyte disorder [11]. Patients with hypokalaemia often have no symptoms, particularly when the disorder is mild (serum potassium 3.0–3.5 mmol/l). Profound hypokalaemia, however, can cause severe problems, such as paralytic ileus, urinary retention, rhabdomyolysis and paralysis [1]. Overall, children and young adults tolerate hypokalaemia better than the elderly [2]. Moderately hypokalaemic patients (serum potassium levels of 2.5–3.0 mmol/l) demonstrate mostly minor disorders, such as constipation, fatigue, muscle weakness, muscle pain and cramps, which can, however, have a significant impact on the quality of life [1]. As with other electrolyte disorders, rapid onset is an aggravating factor. When analysing in greater detail the consequences of potassium deficit, without being overly exhaustive, it can be seen how – besides the well-known increased risk for cardiac arrhythmias – the management of arterial hypertension can be worsened, both secretion of and sensitivity to insulin diminish, water balance can be affected by increased thirst with nephrogenic diabetes insipidus, and the production of ammonium is stimulated [2].
Nutrition can be an additional risk factor in hospitalised patients, all the more so because a potassium intake deficit can cause persistent hypokalaemia even when counter-regulation mechanisms function normally [12]. Concomitant magnesium deficiency is an aggravating factor [2].
Acute potassium shifts between the intra- and extracellular space (particularly in relation to acid-base balance and with medications such as β2-agonists and insulin [2, 13]), can significantly contribute to a distorted estimation of the patient’s total body potassium deficit. In this regard, it is always useful to consider the timeframes of administration of these medications in clinical practice. Other substances such as caffeine can also affect the ratio between intra- and extracellular potassium [14]. To avoid preanalytic errors, potassium levels should therefore be assessed on an empty stomach.
Last but not least, overcorrection of the potassium deficit, especially in patients with renal failure, can induce hyperkalaemia [15–17], for which adverse events have been reported, some of which are fatal [18, 19]. This should be highly emphasised in consideration of the fact that hyperkalaemia in hospitalised patients is mostly caused by potassium supplementation [20] and that 3.5% of in-hospital adverse events concerning medications are related to the administration of electrolytes [21]. The administration of intravenous potassium, especially at high speed rate, is considered to be particularly risky [22]. In view of the importance of the issue, protocols and guidelines have been published although they are not always supported by evidence [23–26]. Even when protocols are available, adherence is suboptimal, with frequent noncompliance with dosages and with restrictions for intravenous administration [21]. Computerised reminders and prescribing support systems integrated into electronic medical records are some of the tools that have been used to optimise efficacy and appropriateness of prescribing even when experience with electrolytes is modest [3, 27–29].
In-hospital management is therefore complex, not always effective and potentially risky [16, 19]. In consideration of the relevance and multifaceted nature of the issue, which ranges from medication prescribing, and medical and nursing staff and patient education to the efficacy of patient records for both the in-hospital phase and the post-discharge phase, the Quality and Patient Safety service of the network of public hospitals of southern Switzerland (Ente Ospedaliero Cantonale, EOC) made it a quality improvement goal for the years 2013–2014. The key objectives were to increase the proportion of patients with normalised potassium by the end of their hospitalisation, and to reduce the number of cases in which the problem was neglected and there were no orders for serial potassium testing, by means of an education and sensitisation programme. In view of the risk of over-replacement, the safety criterion to be monitored throughout the surveillance period was the incidence of post-hypokalaemia hyperkalaemia.
The issue has been addressed in three phases: (I) a retrospective analysis of patients hospitalised in 2012 that involved five acute care hospitals from the EOC network, with identification of improvement goals, followed by a sample survey with an evaluation of risk factors for the development of hypokalaemia and of management processes; (II) revision of internal guidelines and implementation of educational and sensitisation interventions targeted on medical and nursing staff in one of the five hospitals; (III) follow-up analysis on patients hospitalised in 2014 and second sampling with the aim of reviewing the efficacy of the interventions by comparing the pilot hospital with the other hospitals of the EOC network.
The project was launched in 2013. In the retrospective evaluation phase involving the five acute care hospitals in the EOC network (Ospedale Regionale di Locarno ODL, Ospedale Regionale di Bellinzona e Valli ORBV, Ospedale Regionale di Lugano sede Civico OCL, Ospedale Regionale di Lugano sede Italiano OIL, Ospedale Regionale di Mendrisio OBV), it was decided to analyse the data from the 26 471 inpatient admissions from 2012 while at the same time identifying quality improvement goals and planning for the sample survey to be conducted on the subgroup of hypokalaemic patients.
The pilot hospital for the implementation of educational interventions was the Regional Hospital of Locarno (ODL), one of the five hospitals in the network. In particular, besides the revision of the guidelines on the management of patients with hypokalaemia and the organisation of educational events for medical and nursing staff, communication and sensitisation strategies were implemented within ODL. In order to increase clinicians’ compliance, a pin was designed that all senior physicians, nurse managers and the clinical pharmacist would wear every day as a sign of project buy-in. Moreover, newsletters were sent out by e-mail on a monthly basis starting in May 2014 to all medical staff of the hospital, and mini-posters were put up in the offices of nursing staff.
The second population analysis and sampling of patients admitted in 2014 were conducted in the same way as the first.
Therefore, this was an interventional (educational), preventive (i.e. oriented towards minimising bad clinical practice), multicentre, controlled, before-and-after study, designed to monitor the baseline situation and its evolution following the implementation of internal guidelines and the delivery of educational programmes (fig. 1).
The primary endpoint of the study, to be verified in phase III, was to increase by at least 10% the percentage of patients with hypokalaemia, detected upon admission or during inpatient stay, who were discharged with normal potassium levels. The secondary endpoints were:
Figure 1
Study design.
ODL = Ospedale Regionale di Locarno
1. to reduce to zero the number of cases in which hypokalaemia diagnosed upon admission or during hospitalisation is not rechecked prior to discharge;
2. not to induce an increase in the incidence of cases of hyperkalaemia (safety goal);
3. to reduce to zero the number of cases in which patients with severe hypokalaemia (diagnosed upon admission or during hospitalisation) do not undergo a second blood draw prior to implementing any therapeutic decisions (with the exclusion of preanalytic errors);
4. to either rule out or confirm the presence of hypomagnesaemia and, when necessary, to treat it in all patients in whom hypokalaemia has been diagnosed upon admission or during hospitalisation;
5. to review medical staff adherence to the guidelines on the management of patients with hypokalaemia (developed during phase II) analysing both the adherence to the recommendations for screening hypokalaemic patients for hypomagnesaemia and for treating non acidotic hypokalaemic patients with the suitable medicament (i.e. potassium chloride and not potassium citrate).
We analysed the data of all patients admitted during the period under review with serum potassium concentrations less than 3.5 mmol/l (inclusion criterion; see table 1 for details). This study was designed as a cross-sectional study and data from all patients admitted during the period under review were collected. Therefore no stratified random sample was considered. The parameters measured in the subpopulation are thus not necessarily representative of all population (parameters in ODL vs parameters in all hospitals of the EOC). The data of patients with either normal or high serum potassium throughout their hospital stay were not considered.
The limits for the categorisation of the electrolyte disorders under study are summarised in table 2. Normokalaemia was defined as a serum potassium test result between 3.5 and 5.4 mmol/l.
| Table 1: Underlying characteristics of the study population. | |||||||||||
| Baseline | p-value | Follow-up | p-value | p-value ODL 2012 vs 2014 | |||||||
| EOC* 2012 | ODL 2012 | EOC* 2014 | ODL 2014 | ||||||||
| n | % | n | % | n | % | n | % | ||||
| Number of patients | 20 586 | – | 5885 | – | 20 600 | – | 6126 | – | |||
| – Medical category | – | – | |||||||||
| – Medicine | 9837 | 47.78 | 3283 | 55.79 | – | 9850 | 47.82 | 3392 | 55.37 | – | – |
| – Surgery | 10 749 | 52.22 | 2602 | 44.21 | – | 10 750 | 52.18 | 2734 | 44.63 | – | – |
| – Case mix index (mean/SD) | 0.99 / 1.38 | – | 1.01 / 1.40 | – | – | 0.97 | – | 0.98 | – | – | – |
| – Length of stay in days (mean/SD) | 6.6 / 7.9 | – | 7.9 / 8.5 | – | <0.001 | 6.3 | – | 7.1 | – | – | – |
| Patients whose serum potassium was tested | 15 547 | 75.52 | 5106 | 86.76 | <0.001 | 15 107 | 73.33 | 4927 | 80.43 | <0.001 | <0.001 |
| – Medical category | |||||||||||
| – Medicine | 8680 | 88.24 | 2992 | 91.14 | – | 8728 | 88.61 | 3049 | 89.89 | – | – |
| – Surgery | 6867 | 63.89 | 2114 | 81.25 | – | 6379 | 59.34 | 1878 | 68.69 | – | – |
| – Length of stay in days (mean/SD) | 7.6 / 8.5 | – | 7.9 / 8.5 | – | NS | 7.5 | – | 8.0 | – | – | – |
| Patients with HYPOK upon admission or during hospitalisation | 3613 | 23.24 | 1108 | 21.70 | <0.05 | 3878 | 25.67 | 1163 | 23.60 | <0.001 | <0.05 |
| Gender | |||||||||||
| – Female | 1970 | 54.53 | 623 | 56.23 | NS | 2069 | 53.35 | 681 | 58.56 | <0.01 | NS |
| – Male | 1643 | 45.47 | 485 | 43.77 | NS | 1809 | 46.65 | 482 | 41.44 | <0.01 | NS |
| Age in years (mean/SD) | 67.18 / 18.75 | 1 | 69.20 / 17.38 | – | <0.01 | 66.93 | – | 69.17 | – | – | – |
| – Female | 68.71 | – | 70.69 | – | 67.92 | – | 70.62 | – | – | – | |
| – Male | 65.34 | – | 67.29 | – | – | 65.79 | – | 67.12 | – | – | – |
| Medical category | |||||||||||
| – Medicine | 2119 | 58.65 | 691 | 62.36 | – | 2299 | 59.28 | 746 | 64.14 | – | – |
| – Surgery | 1494 | 41.35 | 417 | 37.64 | – | 1579 | 40.72 | 417 | 35.86 | – | – |
| Severity of hypokalaemia | |||||||||||
| Mild (3≤ K ≤3.4 mmol/l) | 2958 | 81.87 | 875 | 78.97 | NS | 3144 | 81.07 | 929 | 79.88 | NS | NS |
| Moderate (2.5< K ≤3 mmol/l) | 591 | 16.36 | 208 | 18.77 | NS | 655 | 16.89 | 195 | 16.77 | NS | NS |
| Severe (K ≤2.5 mmol/l) | 64 | 1.77 | 25 | 2.26 | NS | 79 | 2.04 | 39 | 3.35 | <0.05 | NS |
| Additional indicators | |||||||||||
| – Length of stay in days (mean/SD) | 11.2 / 11.7 | – | 12.1 / 11.4 | – | <0.05 | 10.01 | – | 11.53 | – | – | – |
| – K value in mmol/l (mean/SD) | 3.21 0.21 | – | 3.19 0.23 | – | <0.05 | 3.20 | – | 3.19 | – | – | – |
| – Case mix index (mean/SD) | 1.47 / 2.31 | – | 1.49 / 2.22 | – | – | 1.34 | – | 1.44 | – | – | – |
| Patients with HYPERK after HYPOK | 50 | 1.38 | 12 | 1.08 | NS | 33 | 0.85 | 21 | 1.81 | <0.05 | NS |
| – Length of stay in days (mean/SD) | 27.04 / 17.91 | 22.25 | 21.96 / 18.76 | 14.85 | – | 35.35 | – | 20.04 | – | – | – |
| – Case mix index (mean/SD) | 4.61 / 1.72 | 4.61 | 3.21 / 2.27 | 3.21 | – | 6.43 | – | 4.71 | – | – | – |
| Patients without HYPOK and without HYPERK | 11 624 | 74.77 | 3892 | 76.22 | – | 10 933 | 72.37 | 3673 | 74.55 | – | – |
| – Length of stay in days (mean/SD) | 6.42 / 6.51 | – | 6.62 / 6.80 | – | – | – | – | – | – | – | – |
| – Case mix index (mean/SD) | 0.91 / 0.91 | – | 0.90 / 0.93 | – | – | – | – | – | – | – | – |
| EOC = Ente Ospedaliero Cantonale; EOC* = EOC without ODL; HYPERK = hyperkalaemia; HYPOK = hypokalaemia; NS = not significant; ODL = Ospedale Regionale di Locarno; SD = standard deviation | |||||||||||
| Table 2:Definitions of the categories of electrolyte disorder under study. | |
| Hypokalaemia (mmol/l) | Severe: K ≤2.5 Moderate: 2.5< K ≤3 Mild: 3< K ≤3.4 |
| Hyperkalaemia (mmol/l) | Severe: K ≥7 Moderate: 6.1≤ K ≤6.9 Mild: 5.5 ≤ K ≤6 |
| Hyponatraemia (mmol/l) | Na <135 |
| Hypomagnesaemia (mmol/l) | Mg <0.65 |
| Alkalosis | pH >7.45 |
| Acidosis | pH <7.35 |
| Glomerular filtration rate (GFR) was estimated using the simplified MDRD (Modification of Diet in Renal Disease)equation for isotope dilution mass spectrometry (IDMS) standardised creatinine values: GFR (ml/min/1.73 m2) = 175 x [crea (μmol/l) x 0.0113] –1.154 x age (years) –0.203 x 0.742 (if female) No corrections were made for African-Caribbean individuals, given their low incidence in the population under study. | |
We performed our analyses using a laboratory, demographic and administrative computerised database including data for the previous 10 years and shared by all the participating hospitals of the EOC network. Data, medical record review and review of discharge summaries were collected by means of the same electronic hospital information system.
With regard to the retrospective and prospective portions of the study, data were analysed from the whole hospitalised population or, for questions requiring medical records, a sample of hypokalaemic patients obtained by simple randomisation (to select individual files random numbers were generated by the “Research Randomizer” tool located online at http://www.randomizer.org ). The sample size to be used in phases I and III was established with the aim of ensuring a 95% confidence interval in the difference between the two ratios under study. We therefore selected a random sample of 588 medical records from the two reference subpopulations (EOC* [EOC without ODL] and ODL) who experienced hypokalaemia.
The power to detect a difference in the primary endpoint (set at 0.80) was calculated on the whole hypokalaemic population. The postulate of a 10% increase (effect size) following the corrective actions described in the primary endpoint was supported by the results of a similar study published previously, which showed that a 17.2% improvement was attained by acting upon the patient management process [8] . The random sample was calculated using a two-sided χ2-test at a 5% significance level, with groups in a N2 = 2 (ODL) and N1 = 1 (EOC*) ratio, later prorated at 50% with 294 patients for both ODL and EOC*.
The data of all patients admitted during the period under review with a serum potassium concentration less than 3.5 mmol/l (inclusion criterion) were analysed. The data of patients with either normal or high serum potassium throughout their hospital stay were not considered.
Finally, since there are four different hospitals within the EOC* control group, it was decided to prorate the EOC* sample according to the percentage of patients receiving potassium testing across the various hospitals.
The medical records of the sample populations were anonymised and audited by eight reviewers using a specially designed check-list (see appendix 1).
Given the need to combine the various databases mentioned above, the origin of the information from five different hospitals and the plan for a follow-up, it was necessary to formulate a few premises in order to ensure data quality.
1. Each case analysed was considered as a single independent hospitalisation for the hospital site where medical records were generated (i.e., the cases transferred from one hospital site to another with the same administrative treatment code were considered as separate cases).
2. In order to facilitate benchmarking, data were analysed by medical category at discharge, thus subdividing them into medicine, geriatrics, surgery, trauma, urology, and gynaecology. Medicine and geriatrics were considered as internal medicine specialties, and were categorised as “medicine” in the global evaluation, whereas general surgery, trauma, urology, and gynaecology were considered as surgical specialties and put together in the final evaluation under the heading “surgery”.
3. An effective “predischarge assessment” was considered to be the measurement of serum potassium within 3 days prior to discharge.
4. Time to serum potassium normalisation referred to the first recovery, even if a patient became hypokalaemic again.
5. For patients who developed hypokalaemia during hospitalisation, severity was assigned on the basis of the first subnormal serum potassium level measured during hospitalisation.
6. “Recovery” referred to the last serum potassium measurement during hospitalisation, so there could be both recovered and unrecovered relapses.
7. Only the first diagnosis of hypokalaemia was included in the total number (in other words, a patient who developed hypokalaemia many times during hospitalisation was added to the calculation only the first time).
8. In order to calculate the time to hypokalaemia normalisation, only the time from diagnosis was taken into account, and not the time from treatment.
General practitioners collaborating with the network have free access to the current and past electronic files of their patients and in 2014 had the possibility to contribute to the survey with follow-up serum potassium measurements (if any) performed after 2012 hospitalisations.
Statistical analyses were performed using STATA®, version 13, SPSS® for Windows, version 20, and G-Power, version 3.1.3. The analysis was based on a clinical dataset extracted from various pre-existing integrated databases that automatically collect data from all the exams performed in the laboratories for all the patients of the EOC Network.
The efficiency of the management of patients with hypokalaemia was analysed by using the aggregate indices of hospital activity volumes drawn from the SwissDRG (Swiss Diagnosis Related Group classification) system that is used to categorise all inpatients admitted to Swiss acute care hospitals [30]. In particular, the indices taken into consideration were the case mix index (CMI) and the comparative performance index (CPI). The CMI is greater than 1 when the average complexity of the case mix analysed is greater than the benchmark. Similarly, the CPI is greater than 1 when the length of stay for the case mix analysed is greater than the expected length of stay based on the benchmark, and vice versa.
The present study compared the mean CMI and CPI values for all patients with and without hypokalaemia, assigned to the medical categories of medicine and surgery. The combination of the two aggregate indices into a matrix chart allowed the chart area to be subdivided into four quadrants showing different levels of efficiency in hospital management. The efficiency analysis took into account only the hospitals with a greater number of discharges than the lower limit of the confidence interval in one hospital in the period under review.
With regard to possible sources of bias, the extraction only concerns the cases opened and closed in 2012 and 2014, which means that the cases overlapping with 2011, 2013 and 2015 (numerically irrelevant) have been dropped. For transfer cases, the lack of the time of transfer from site to site has generated a stochastic error in the final dataset that has, however, been deemed statistically irrelevant.
Data are expressed as mean ± standard deviation (SD), unless otherwise specified. The t-test was used for the comparison of means, and the χ2test was used for differences in proportions.
In all statistical analyses, p ≤0.05 (two-tailed) was considered statistically significant.
| Table 3: Evolution of hypokalaemia and incidence of deaths and falls in patients with and without hypokalaemia. | |||||||||||
| Baseline | p-value | Follow-up | p-value | p-value ODL 2012 vs 2014 | |||||||
| EOC* 2012 | ODL 2012 | EOC* 2014 | ODL 2014 | ||||||||
| n | % | n | % | n | % | n | % | ||||
| Number of patients | 20 586 | – | 5885 | – | – | 20 600 | – | 6126 | – | – | |
| – Deaths | 633 | 3.07 | 199 | 3.38 | NS | 599 | 2.91 | 197 | 3.38 | NS | NS |
| – Falls | 350 | 1.70 | 135 | 2.29 | <0.01 | 350 | 1.70 | 167 | 2.73 | <0.001 | NS |
| Patients whose serum potassium was tested | 15 547 | 75.52 | 5106 | 86.76 | <0.001 | 15 107 | 73.33 | 4927 | 80.43 | <0.001 | <0.001 |
| – Mix by medical category | |||||||||||
| – Medicine | 8680 | 88.24 | 2992 | 91.14 | – | 8728 | 88.61 | 3049 | 89.89 | – | – |
| – Surgery | 6867 | 63.89 | 2114 | 81.25 | – | 6379 | 59.34 | 1878 | 68.69 | – | – |
| Patients with HYPOK upon admission or during hospitalisation | 3613 | 23.24 | 1108 | 21.70 | <0.05 | 3878 | 25.67 | 1163 | 23.60 | <0.05 | <0.05 |
| Severity of hypokalaemia | |||||||||||
| – Mild (3≤ K ≤3.4 mmol/l) | 2958 | 81.87 | 875 | 78.97 | p <0.05 | 3144 | 81.07 | 929 | 79.88 | NS | NS |
| – Moderate (2.5< K ≤3 mmol/l) | 591 | 16.36 | 208 | 18.77 | NS | 655 | 16.89 | 195 | 16.77 | NS | NS |
| – Severe (K ≤2.5 mmol/l) | 64 | 1.77 | 25 | 2.26 | NS | 79 | 2.04 | 39 | 3.35 | <0.05 | NS |
| Outcome upon discharge | |||||||||||
| – Normalised | 2207 | 61.08 | 692 | 62.45 | NS | 2350 | 60.60 | 811 | 69.73 | <0.001 | <0.05 |
| – With severe HYPOK | 2 | 0.06 | 0.00 | – | 8 | 0.21 | 1 | 0.09 | – | – | |
| – With moderate HYPOK | 56 | 1.55 | 25 | 2.26 | – | 76 | 1.96 | 16 | 1.38 | – | – |
| – With mild HYPOK | 573 | 15.86 | 187 | 16.88 | – | 573 | 14.78 | 164 | 14.10 | – | – |
| – With mild HYPERK | 11 | 0.30 | 1 | 0.09 | – | 2 | 0.05 | 2 | 0.17 | – | – |
| – With moderate HYPERK | 3 | 0.08 | 0.00 | – | 1 | 0.03 | 4 | 0.34 | – | – | |
| – With severe HYPERK | 0.00 | 0.00 | – | 1 | 0.03 | 0.00 | – | – | |||
| – Not retested | 761 | 21.06 | 203 | 18.32 | – | 867 | 22.36 | 165 | 14.19 | – | – |
| Evolution upon discharge | |||||||||||
| – Patients who got better | 2295 | 63.52 | 721 | 65.07 | NS | 2427 | 62.58 | 846 | 72.74 | <0.001 | <0.001 |
| – Patients who got worse | 42 | 1.16 | 11 | 0.99 | – | 35 | 0.90 | 15 | 1.29 | – | – |
| Adverse events | |||||||||||
| – Deaths | 185 | 5.12 | 58 | 5.23 | NS | 167 | 4.31 | 65 | 5.59 | NS | NS |
| – Falls | 128 | 3.54 | 54 | 4.87 | NS | 121 | 3.12 | 61 | 5.25 | <0.05 | NS |
| Patients with HYPERK after HYPOK ‡ | 50 | 1.38 | 12 | 1.08 | <0.001 | 33 | 0.85 | 21 | 1.81 | <0.05 | NS |
| – Deaths | 18 | 29.03 | – | – | – | – | – | – | – | – | – |
| – Falls | 6 | 9.68 | – | – | – | – | – | – | – | – | – |
| Patients WITHOUT HYPOK and without HYPERK | 11 624 | 74.77 | 3892 | 76.22 | NS | 10 933 | 72.37 | 3673 | 74.55 | <0.05 | NS |
| – Deaths | 297 | 2.56 | 108 | 2.77 | NS | – | – | – | – | – | – |
| – Falls | 185 | 1.59 | 67 | 1.72 | NS | – | – | – | – | – | – |
| EOC = Ente Ospedaliero Cantonale; EOC* = EOC without ODL; HYPERK = hyperkalaemia; HYPOK = hypokalaemia; NS = not significant; ODL = Ospedale Regionale di Locarno; SD = standard deviation ‡ Given the low number of post-HYPOK HYPERK cases, EOC and ODL were put together for the calculation. | |||||||||||
Tables 3 and 4 summarise the evolution and management of hypokalaemia and the incidence of untoward progressions characterised by deaths, falls and readmissions, tracked in patients with and without hypokalaemia.
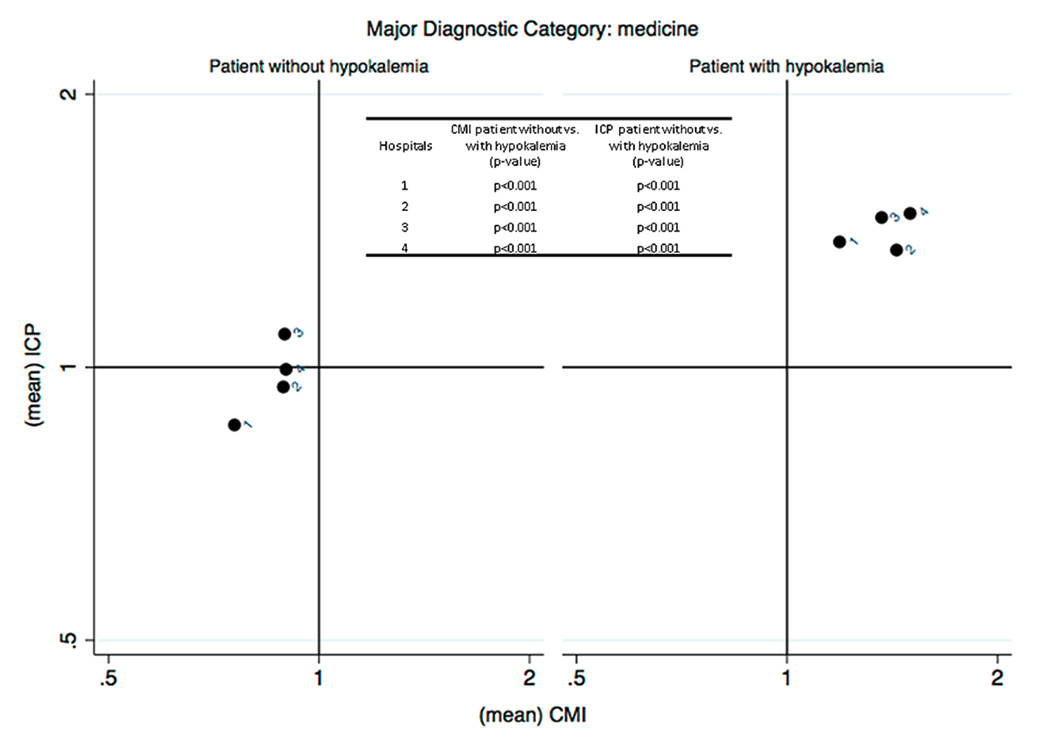
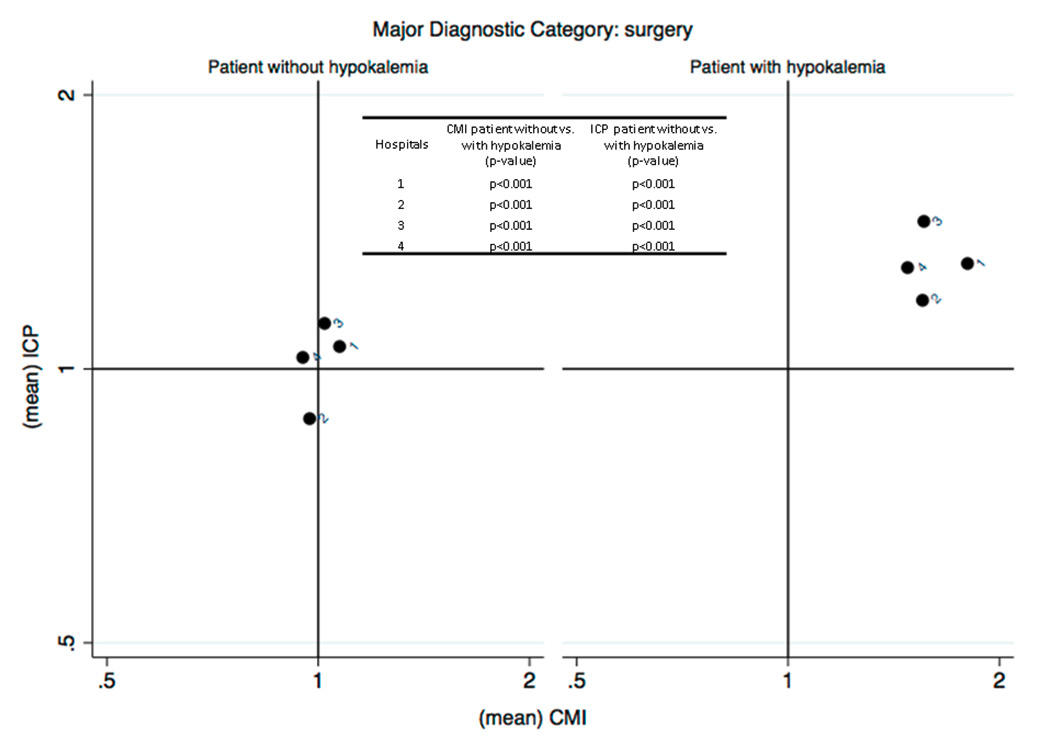
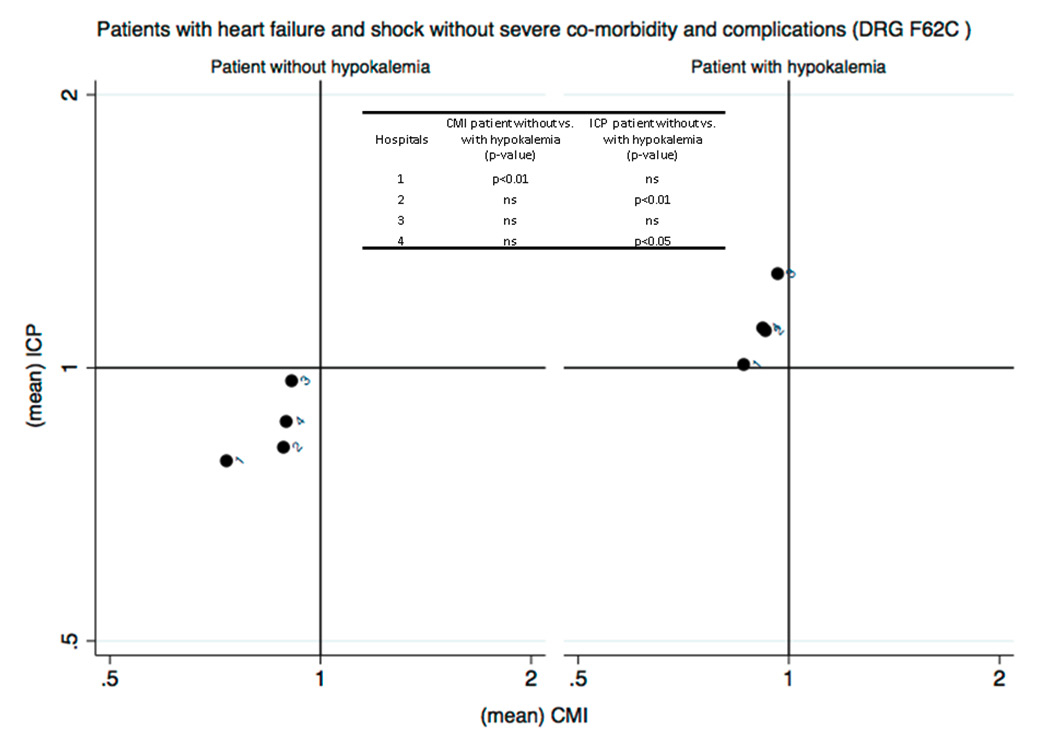
Figure 2 (Panels A, B and C)
Analysis of the efficiency in the management of patients with hypokalaemia (phase I) (Panel A: internal medicine services; Panel B: surgery services; Panel C: analysis restricted to patients with heart failure without severe comorbidities and complications DRG F62C). The case mix index (CMI), on the x-axis, reflects the relative severity of the case mix compared with the Swiss national benchmark. This index is greater than 1 when the mean severity of the case mix analysed is greater than the benchmark. The comparative performance index (ICP), on the y-axis, is exclusively based on the length of hospital stay, thus indirectly reflecting the relative performance for the case mix under study compared with the Swiss national benchmark. This index is greater than 1 when the length of stay for the case mix analysed is greater than the expected length of stay based on the benchmark, and vice versa.
One in five inpatients presented with hypokalaemia (ODL vs EOC*, 21.7 vs 23.2%, p <0.05). In 52.0 vs 49.4% (ODL vs EOC*, ns = not statistically significant), the electrolyte disorder appeared during hospitalisation. In 62.5 vs 61.1% (ODL vs EOC*, ns) serum potassium concentrations normalised prior to discharge, whereas in 18.3 vs 21.1% (ODL vs EOC*, p <0.05) of patients the electrolyte disorder was not monitored. The time to serum potassium normalisation was 3.0 ± 2.7 vs 2.8 ± 2.4 days on average (ODL vs EOC*, ns). Serum magnesium levels were measured in 21.2% of ODL hypokalaemic patients and were found to be abnormal in 20.4% of cases.
Of the patients who presented with hypokalaemia, 1.1 vs 1.4%. (ODL vs EOC*, ns) developed hyperkalaemia during hospitalisation. Hyperkalaemia (in ODL; n = 12) was due to late serial monitoring of serum potassium levels in 37% of cases (later than 72 hours after initiation of replacement therapy), to continuation of replacement therapy following determination of serum potassium normalisation in 25% of cases, and to either inappropriate potassium doses or inappropriate administration route (intravenous vs oral) used for replacement in an additional 25% (see appendix 2 for internal recommendations).
Out of the known risk factors related to hypokalaemia, 51% of patients were hypertensive, 21% were treated with more than two medications, 18% were on thiazides and 22% on loop diuretics (table 5).
In only 53% of patients was the potassium deficit replaced (33% intravenously, 86% with an oral formulation, 19% with both modalities). For oral replacement, potassium chloride was used in 74% and potassium citrate in 26% of the patients (table 6).
The average length of stay was found to be 11.2 ± 11.7 vs 6.6 ± 7.9 days (p <0.001) in the comparison between hypokalaemic patients and normokalaemic patients, with incidences of fall and death of 3.5 vs 1.7% and 5.1 vs 3.1%, respectively (p <0.001 in both cases).
A total of 77.2% (227 out of 294) of ODL patients with hypokalaemia sampled within the project had potassium levels evaluated during a previous hospitalisation. Of these patients, 59.9% were hypokalaemic at the time of testing, with a mean serum potassium value of 3.22 ± 0.25 mmol/l. Potassium determination during the hospital stay preceding the index hospitalisation had occurred 437 ± 550 days earlier on average (results not shown).
The patient’s primary care physician was informed of the hypokalaemia issue in 63.3% of cases (186 out of 294). For the 87 patients whose hypokalaemia had not yet resolved at discharge, the information was given to their primary care physician in 58.6% of cases.
When the primary care physician was informed of the hypokalaemia issue, the information was given by enclosing the laboratory report in 59.1% of cases, both by enclosing the laboratory report and citing the issue in the discharge summary in 32.2% of cases, and only by citing the issue in the discharge summary in 8.6% of cases.
For patients with mild to moderate hypokalaemia at discharge, the primary care physician received only the attachment with laboratory results in 45.1% of cases, whereas complete information was given in 33% of cases by enclosing the laboratory report and by entering the information in the discharge summary.
After discharge, primary care physicians performed a follow-up serum potassium measurement (165 ± 155 days on average after hospitalisation) in 41.2% of cases (121 out of 294). If only the 186 patients for whom ODL had informed their primary care physician about the hypokalaemia issue are taken into account, follow-up potassium measurement occurred in 42.2% of cases. In 90% of cases, the result of follow-up potassium measurement was normal. In 15% of cases, potassium levels were measured over 1 year after hospitalisation.
For the cases when the primary care physician had been informed of the hypokalaemia issue in the discharge summary, follow-up laboratory tests were performed in 42% of cases. This rate was slightly lower at 39% when the primary care physician only received a copy of the laboratory report. Even without the information about hypokalaemia, primary care physicians still performed a potassium test in 53% of cases.
Out of 294 patients, 53.4% had their serum potassium measured during another admission to a hospital within the EOC network in the subsequent 12 months. Of these patients, 53.8% were found to have hypokalaemia again. In-hospital measurements were made 152 ± 134 days on average after the index hospitalisation.
For both subgroups of patients analysed (medical categories of “medicine” and “surgery”), and in all EOC hospitals participating in the study, it appears that hospital management of patients with hypokalaemia is inefficient compared with patients who do not present with this condition (fig. 2). Patients with hypokalaemia fall within the second quadrant of the matrix, in the area corresponding to high complexity/severity (CMI >1) and low efficiency (ICP >1), that is, with a longer average length of stay than the standard length of stay for the severity of the disease causing admission. The analysis was then repeated post hoc, focusing on patients discharged with SwissDRG code F62C “heart failure”, the most common DRG found in hypokalaemic patients. In this case too, the results showed a loss of efficiency in hospital management across all EOC hospitals compared to patients with the same DRG who were not hypokalaemic (fig. 2).
The normalisation of the electrolyte disorder (ODL 2014 vs ODL 2012) was obtained in 69.7 vs 62.4% of patients (p <0.001) (primary endpoint, efficiency); time to normalisation (2.5 ± 2.1 vs 3.0 ± 2.7 days) did not change significantly. The percentage of patients treated increased from 53.1 to 75.7% (p <0.001). The absence of monitoring was reduced from 20.1 to 8.7% (p <0.001) (secondary endpoint, safety). The percentage of secondary hyperkalaemia cases (1.8 vs 1.1%) did not change significantly (secondary endpoint, safety). A second blood draw prior to implementing therapeutic decisions was performed in 97.4 vs 96% of patients with severe hypokalaemia (ns) (secondary endpoint, safety). Patients with hypokalaemia were tested for serum magnesium in 60.5 vs 21.2% of the cases (p <0.001) (secondary endpoint, adherence to the guidelines), and hypomagnesaemia was diagnosed in 23.6%. The prescription of potassium citrate for oral replacement dropped from 12.6 to 2.1% (p <0.001) (secondary endpoint, adherence to the guidelines). Tables 3 and 4 provide details.
| Table 4: Management of patients with hypokalaemia. | |||||||||||
| Baseline | p-value | Follow-up | p-value | p-value ODL 2012 vs 2014 | |||||||
| EOC* 2012 | ODL 2012 | EOC* 2014 | ODL 2014 | ||||||||
| n | % | n | % | n | % | n | % | ||||
| Patients with HYPOK upon admission or during hospitalisation | 3613 | 23.24 | 1108 | 21.70 | <0.05 | 3878 | 25.67 | 1163 | 23.60 | ||
| Additional indicators | |||||||||||
| – Serum potassium tests performed (total) | 13 576 | – | 4168 | – | – | 13 582 | – | 4288 | – | – | – |
| – Serum potassium tests per patient | 3.75 | – | 3.76 | – | – | 3.50 | – | 3.68 | – | – | – |
| – Serum potassium tests per 1000 inpatient days | 316.58 | – | 312.84 | – | NS | 321.45 | – | 313.97 | – | – | – |
| – With severe HYPOK | 457.71 | – | 352.20 | – | – | 458.16 | – | 470.8 | – | – | – |
| – With moderate HYPOK | 361.14 | – | 340.05 | – | – | 375.75 | – | 393.65 | – | – | – |
| – With mild HYPOK | 302.44 | – | 300.4 | – | – | 301.8 | – | 289.67 | – | – | – |
| – Time (hours) from HYPOK onset to 1st serial monitoring test (mean/SD) | 47.51 / 41.66 | – | 46.89 / 37.02 | – | NS | 43.44 / 35.48 | – | 43.73 / 37.76 | – | – | – |
| – With severe HYPOK | 21.00 / 21.49 | – | 32.94 / 46.92 | – | – | 19.28 | – | 15.81 | – | – | – |
| – With moderate HYPOK | 37.16 / 43.46 | – | 32.42 / 26.54 | – | – | 34.44 | – | 27.09 | – | – | – |
| – with mild HYPOK | 50.77 / 40.95 | – | 51.38 / 38.19 | – | – | 46.53 | – | 49.25 | – | – | – |
| – Cases retested at least a second time | 2705 | 74.87 | 843 | 76.08 | – | 2849 | 73.47 | 953 | 81.94 | – | – |
| – with severe HYPOK | 56 | 87.50 | 24 | 96.00 | – | 71 | 89.87 | 38 | 97.44 | – | – |
| – with moderate HYPOK | 526 | 89.00 | 186 | 89.42 | – | 567 | 86.56 | 180 | 92.31 | – | – |
| – with mild HYPOK | 2123 | 71.77 | 633 | 72.34 | – | 2211 | 70.32 | 735 | 79.12 | – | – |
| – Cases with severe hypokalaemia that were not monitored a second time | 8 | 12.50 | 1 | 4.00 | – | 8 | 10.13 | 1 | 2.56 | – | – |
| – Cases without recovery and not rechecked at discharge | 761 | 54.13 | 203 | 48.80 | – | 867 | 56.74 | 165 | 46.88 | – | – |
| – Cases without recovery that were rechecked prior to discharge | 645 | 45.87 | 213 | 51.20 | – | 661 | 43.26 | 187 | 53.13 | – | – |
| – Duration of HYPOK in days: time to normalisation (mean/SD) | 2.80 / 2.38 | – | 2.99 / 2.73 | – | NS | 2.66 / 2.16 | – | 2.52 / 2.07 | – | – | – |
| – with severe HYPOK | 2.69 / 1.98 | – | 3.14 / 2.81 | – | – | 2.57 / 2.06 | – | 1.61 / 1.01 | – | – | – |
| – with moderate HYPOK | 2.64 / 1.99 | – | 2.39 / 1.83 | – | – | 2.57 / 1.99 | – | 1.98 / 1.58 | – | – | – |
| – with mild HYPOK | 2.85 / 2.01 | – | 3.16 / 2.45 | – | – | 2.69 / 2.00 | – | 2.69 / 2.01 | – | – | – |
| – Rebound effect (HYPOK recurrence after normalisation) | 314 | 14.23 | 109 | 15.75 | – | 556 | 23.66 | 197 | 24.29 | – | – |
| – Cases without recurrences | 1893 | 85.77 | 583 | 84.25 | – | 2674 | 68.95 | 834 | 71.71 | – | – |
| – Readmissions | 2249 | 62.25 | 645 | 58.21 | – | 2475 | 63.82 | 655 | 56.32 | – | – |
| – Cases with magnesium determination at least once during hospitalisation | 572 | 15.83 | 235 | 21.21 | <0.001 | 694 | 17.90 | 704 | 60.53 | <0.001 | <0.001 |
| – Cases with HYPOM at least once during hospitalisation | 108 | 2.99 | 48 | 4.33 | <0.001 | 139 | 3.58 | 166 | 14.27 | <0.001 | <0.05 |
| – Incidence of HYPOM on patients checked | 18.88 | – | 20.43 | – | NS | 20.03 | – | 23.58 | – | – | – |
| – Plasmatic magnesium† (mean/SD) | 0.80 / 0.17 | – | 0.78 / 0.18 | – | – | 0.78 | – | 0.73 | – | – | – |
| – Cases with sodium determination at least once during hospitalisation | 3205 | 88.71 | 983 | 88.72 | NS | 3872 | 99.85 | 1162 | 99.91 | NS | <0.001 |
| – Cases with HYPON at least once during hospitalisation | 519 | 14.36 | 338 | 30.51 | <0.001 | 872 | 22.49 | 323 | 27.77 | <0.001 | NS |
| – Plasmatic sodium† (mean/SD) | 139.50 / 4.13 | – | 137.82 / 4.60 | – | – | 138.68 | – | 138.17 | – | – | – |
| – Cases with ACIDOSIS, at least once during hospitalisation | 305 | 8.44 | 67 | 6.05 | <0.05 | 344 | 8.87 | 84 | 7.22 | NS | NS |
| – Bicarbonate* (mean/SD) | 23.49 / 6.64 | – | 23.85 / 5.67 | – | – | 23.01 | – | 22.66 | – | – | – |
| – PCO2*(mean/SD) | 5.75 / 1.61 | – | 5.65 / 1.36 | – | – | 5.48 | – | 5.66 | – | – | – |
| – Cases with ALKALOSIS at least once during hospitalisation | 327 | 9.05 | 120 | 10.83 | – | 314 | 8.10 | 100 | 8.60 | – | – |
| – Bicarbonate*(mean/SD) | 24.88 / 5.36 | – | 25.34 / 5.20 | – | – | 24.46 | – | 25.47 | – | – | – |
| – PCO2 (mean/SD) | 4.88 / 1.04 | – | 4.86 / 1.01 | – | – | 4.78 | – | 4.97 | – | – | – |
| – GFR (mean/SD) | 76.38 / 29.53 | 77.12 / 29.53 | – | 76.04 | – | 78.58 | – | – | |||
| EOC = Ente Ospedaliero Cantonale; EOC* = EOC without ODL; GFR = glomerular filtration rate; HYPERK = hyperkalaemia; HYPOK = hypokalaemia; HYPOM = hypomagnesaemia; HYPON = hyponatraemia; NS = not significant; ODL = Ospedale Regionale di Locarno; SD = standard deviation * in arterial blood analsyis | |||||||||||
| Table 5: Incidence of known risk factors related to hypokalaemia in the audited sample of patients. | |||||||||||
| Baseline | p-value | Follow-up | p-value | p-value ODL 2012 vs 2014 | |||||||
| EOC* 2012 | ODL 2012 | EOC* 2014 | ODL 2014 | ||||||||
| n | % | n | % | n | % | n | % | ||||
| Reference population (patients with HYPOK) | 294 | 294 | 292 | 288 | |||||||
| Diagnoses | |||||||||||
| – Number of patient files analysed: | 294 | 100.00 | 294 | 100.00 | – | 292 | 100.00 | 288 | 100.00 | – | – |
| – Hypertension | 179 | 60.88 | 149 | 50.68 | – | 143 | 48.97 | 144 | 39.58 | – | <0.05 |
| – Kidney failure | 61 | 20.75 | 56 | 19.05 | – | 40 | 13.70 | 52 | 18.06 | – | – |
| – Cardiac arrhythmia | 67 | 22.79 | 39 | 13.27 | – | 66 | 22.60 | 15 | 5.21 | – | <0.001 |
| – Cognitive decline | 28 | 9.52 | 27 | 9.18 | – | 28 | 9.59 | 15 | 5.21 | – | NS |
| – Diarrhoea | 29 | 9.86 | 21 | 7.14 | – | 29 | 9.93 | 23 | 7.99 | – | – |
| – Acute kidney injury | 31 | 10.54 | 18 | 6.12 | – | 16 | 5.48 | 39 | 13.54 | – | <0.01 |
| – Malnutrition | 8 | 2.72 | 33 | 11.22 | – | 8 | 2.74 | 34 | 11.81 | – | – |
| – Vomiting | 27 | 9.18 | 11 | 3.74 | – | 33 | 11.30 | 30 | 10.42 | – | <0.01 |
| – Diabetes | 17 | 5.78 | 9 | 3.06 | – | 17 | 5.82 | 7 | 2.43 | – | – |
| – Stroke | 7 | 2.38 | 18 | 6.12 | – | 3 | 1.03 | 7 | 2.43 | – | <0.05 |
| – Congestive heart failure | 4 | 1.36 | 8 | 2.72 | – | 3 | 1.03 | 17 | 5.90 | – | – |
| – Cirrhosis | 8 | 2.72 | 3 | 1.02 | – | 3 | 1.03 | 8 | 2.78 | – | – |
| – Hyperthyroidism | 8 | 2.72 | 2 | 0.68 | – | 2 | 0.68 | 2 | 0.69 | – | – |
| – Gastrointestinal bleeding | 2 | 0.68 | 6 | 2.04 | – | 5 | 1.71 | 2 | 0.69 | – | – |
| – Rhabdomyolysis | 4 | 1.36 | 3 | 1.02 | – | 0.00 | 0.00 | – | – | ||
| – Nasogastric aspiration | 2 | 0.68 | 3 | 1.02 | – | 0.00 | 2 | 0.69 | – | – | |
| – Dialysis | 3 | 1.02 | 1 | 0.34 | – | 0.00 | 0.00 | – | – | ||
| – Hyperaldosteronism | 2 | 0.68 | 0.00 | – | 0.00 | 0.00 | – | – | |||
| – Genetic kidney disorders with hypokalaemia | 1 | 0.34 | 1 | 0.34 | – | 0.00 | 0.00 | – | – | ||
| – Cushing's syndrome | 1 | 0.34 | 0.00 | – | 1 | 0.34 | 0.00 | – | – | ||
| – Haemolysis | 0.00 | 0.00 | – | 0.00 | 0.00 | – | |||||
| Medication | |||||||||||
| – Number of patient files analysed: | 264 | 100.00 | 294 | 100.00 | – | 292 | 100.00 | 288 | 100.00 | – | – |
| – Patients on no medication | 89 | 33.71 | 75 | 25.51 | – | 93 | 31.85 | 100 | 34.72 | – | – |
| – Patients on one medication | 62 | 23.48 | 88 | 29.93 | – | 62 | 21.23 | 60 | 20.83 | – | – |
| – Patients on two medications | 53 | 20.08 | 68 | 23.13 | – | 62 | 21.23 | 53 | 18.40 | – | – |
| –Patients on more than two medications | 60 | 22.73 | 63 | 21.43 | – | 75 | 25.68 | 75 | 26.04 | – | – |
| – Details of medications | |||||||||||
| – Diuretics | |||||||||||
| – Thiazide diuretics | 44 | 14.97 | 52 | 17.69 | NS | 41 | 14.04 | 47 | 16.32 | NS | – |
| – Loop diuretics | 82 | 27.89 | 66 | 22.45 | NS | 64 | 21.92 | 70 | 24.31 | NS | – |
| – Potassium-sparing diuretics | 20 | 6.80 | 15 | 5.10 | NS | 12 | 4.11 | 13 | 4.51 | NS | – |
| – Beta-blockers | 85 | 28.91 | 89 | 30.27 | NS | 100 | 34.25 | 77 | 26.74 | <0.05 | NS |
| – ACE inhibitors, ARBs, renin inhibitors | 82 | 27.89 | 81 | 27.55 | NS | 87 | 29.79 | 78 | 27.08 | NS | – |
| – NSAIDs | 20 | 6.80 | 29 | 9.86 | NS | 13 | 4.45 | 28 | 9.72 | <0.05 | – |
| – Bactrim® (co-trimoxazole) | 2 | 0.68 | 2 | 0.68 | NS | 1 | 0.34 | 2 | 0.69 | NS | – |
| – Immunosuppressors | – | ||||||||||
| – Tacrolimus (Prograf®) | 1 | 0.34 | 0.00 | – | 0.00 | 0.00 | – | – | |||
| – Ciclosporin (Sandimmun®) | 2 | 0.68 | 0.00 | – | 0.00 | 0.00 | – | – | |||
| – Lithium | 0.00 | 0.00 | – | 0.00 | 1 | 0.35 | – | – | |||
| – Potassium therapy | 10 | 3.40 | 7 | 2.38 | – | 6 | 2.05 | 7 | 2.43 | – | – |
| – Laxatives | 35 | 11.90 | 38 | 12.93 | – | 30 | 10.27 | 33 | 11.46 | – | – |
| – Digoxin therapy | 9 | 3.06 | 1 | 0.34 | – | 9 | 3.08 | 1 | 0.35 | – | – |
| – Antibiotics | – | – | – | – | – | – | – | – | – | – | – |
| – Aminoglycosides | 0.00 | 0.00 | – | 0.00 | 5 | 1.74 | – | – | |||
| – High-dose penicillins | 1 | 0.34 | 1 | 0.34 | – | 0.00 | 5 | 1.74 | – | – | |
| – Insulin | 18 | 6.12 | 10 | 3.40 | – | 21 | 7.19 | 6 | 2.08 | – | – |
| – Resonium® (calcium polystyrene sulphonate) | 0.00 | 0.00 | – | 1 | 0.34 | 0.00 | – | – | |||
| – Theophylline | 0.00 | 2 | 0.68 | – | 0.00 | 0.00 | – | – | |||
| – Beta2 sympathomimetics | 33 | 11.22 | 26 | 8.84 | – | 45 | 15.41 | 32 | 11.11 | – | – |
| – Steroids | 45 | 15.31 | 25 | 8.50 | – | 25 | 8.56 | 34 | 11.81 | – | – |
| – Amphotericin B | 0.00 | 0.00 | – | 0.00 | 1 | 1.35 | – | – | |||
| HYPOK patients with hypertension… | 179 | 60.88 | 149 | 50.68 | – | 143 | 48.97 | 114 | 39.58 | – | <0.01 |
| – Who were on thiazide diuretics | 41 | 22.91 | 45 | 30.20 | – | 32 | 22.38 | 37 | 32.46 | – | – |
| – With severe HYPOK | – | 1 | – | – | 1 | – | 3 | – | – | – | |
| – With moderate HYPOK | 8 | – | 5 | – | – | 7 | – | 7 | – | – | – |
| – With mild HYPOK | 33 | – | 39 | – | – | 24 | – | 27 | – | – | – |
| – Who were on loop diuretics | 68 | 37.99 | 32 | 21.48 | – | 49 | 34.27 | 42 | 36.84 | – | – |
| – With severe HYPOK | 1 | – | 1 | – | – | 1 | – | 3 | – | – | – |
| – With moderate HYPOK | 16 | – | 5 | – | – | 12 | – | 8 | – | – | – |
| – With mild HYPOK | 51 | – | 26 | – | – | 36 | – | 31 | – | – | – |
| – Who were on ACE inhibitors | 82 | 45.81 | 81 | 54.36 | – | 70 | 48.95 | 60 | 52.63 | – | – |
| – With severe HYPOK | 1 | – | 1 | – | – | 1 | – | 1 | – | – | – |
| – With moderate HYPOK | 15 | – | 12 | – | – | 12 | – | 11 | – | – | – |
| – With mild HYPOK | 66 | – | 68 | – | – | 57 | – | 48 | – | – | – |
| – Who were on potassium-sparing diuretics | 11 | 6.15 | 7 | 4.70 | – | 8 | 5.59 | 8 | 7.02 | – | – |
| – With severe HYPOK | – | – | – | 1 | – | – | – | – | |||
| – With moderate HYPOK | 3 | – | – | – | 2 | – | 2 | – | – | – | |
| – With mild HYPOK | 8 | – | 7 | – | – | 5 | – | 6 | – | – | – |
| ACE = angiotensin converting-enzyme; ARB = angiotensin receptor blocker; EOC = Ente Ospedaliero Cantonale; EOC* = EOC without ODL; HYPOK = hypokalaemia; NS = not significant; NSAID = nonsteroidal anti-inflammatory drug; ODL = Ospedale Regionale di Locarno | |||||||||||
| Table 6: Pharmacological management of patients with hypokalaemia in the audited sample of patients. | |||||||||||
| Baseline | p-value | Follow-up | p-value | p-value ODL 2012 vs 2014 | |||||||
| EOC* 2012 | ODL 2012 | EOC* 2014 | ODL 2014 | ||||||||
| n | % | n | % | n | % | n | % | ||||
| Reference population (patients with HYPOK) | 294 | 294 | 292 | 288 | |||||||
| Treated within 24 hr | 166 | 56.46 | 156 | 53.06 | NS | 188 | 64.38 | 218 | 75.69 | <0.01 | <0.001 |
| – With severe HYPOK | 1 | 0.60 | 9 | 5.77 | – | 5 | 2.66 | 8 | 3.67 | – | – |
| – With moderate HYPOK | 45 | 27.11 | 40 | 25.64 | – | 50 | 26.60 | 42 | 19.27 | – | – |
| – With mild HYPOK | 120 | 72.29 | 107 | 68.59 | – | 133 | 70.74 | 168 | 77.06 | – | – |
| Not treated | 128 | 43.54 | 138 | 46.94 | NS | 104 | 35.62 | 70 | 24.31 | <0.01 | <0.001 |
| – With severe HYPOK | 1 | 0.78 | 0.00 | – | 0.00 | 0.00 | – | – | |||
| – With moderate HYPOK | 7 | 5.47 | 7 | 5.07 | – | 3 | 2.88 | 7 | 10.00 | – | – |
| – With mild HYPOK | 120 | 93.75 | 131 | 94.93 | – | 101 | 97.12 | 63 | 90.00 | – | – |
| – Patients not treated and not re-tested | 49 | 16.67 | 59 | 20.07 | – | 50 | 17.12 | 25 | 8.68 | <0.01 | <0.001 |
| – Time (hours) from HYPOK onset to 1st serial monitoring test (mean/SD) | 52.13 / 45.02 | – | 47.02 / 35.72 | – | NS | 49.88 | – | 41.81 | – | – | – |
| – With severe HYPOK | 13.77 / 15.53 | – | 17.54 / 9.65 | – | – | 22.61 | – | 21.69 | – | – | – |
| – With moderate HYPOK | 40.66 / 31.13 | – | 30.28 / 24.28 | – | – | 39.54 | – | 24.38 | – | – | – |
| – Latency in hours from HYPOK diagnosis to substitution (mean/SD) | 6.72 / 11.63 | – | 10.25 / 18.14 | – | <0.05 | 10.27 | – | 23.00 | – | – | – |
| – With severe HYPOK | 1.7 | – | 1.99 / 2.03 | – | – | 0.88 | – | 2.02 | – | – | – |
| – With moderate HYPOK | 4.35 / 5.81 | – | 3.77 / 4.07 | – | – | 3.36 | – | 6.17 | – | – | – |
| – With mild HYPOK | 7.72 / 13.22 | – | 13.30 / 21.02 | – | – | 13.6 | – | 28.05 | – | – | – |
| Type of treatment | |||||||||||
| Treated either IV or PO | 166 | 56.46 | 156 | 53.06 | – | 186 | 63.70 | 221 | 76.74 | <0.001 | <0.001 |
| – With severe HYPOK | 1 | 0.60 | 9 | 5.77 | – | 5 | 2.69 | 8 | 3.62 | – | – |
| –With moderate HYPOK | 45 | 27.11 | 40 | 25.64 | – | 49 | 26.34 | 44 | 19.91 | – | – |
| – With mild HYPOK | 120 | 72.29 | 107 | 68.59 | – | 132 | 70.97 | 169 | 76.47 | – | – |
| – mmol/patient (mean) | 46.57 | – | 56.99 | – | – | – | – | – | – | – | – |
| – With severe HYPOK | 88 | – | 123.78 | – | – | – | – | – | – | – | – |
| – With moderate HYPOK | 59.07 | – | 79.85 | – | – | – | – | – | – | – | – |
| – With mild HYPOK | 41.53 | – | 42.82 | – | – | – | – | – | – | – | – |
| Treated IV | 42 | 14.29 | 51 | 17.35 | NS | 53 | 18.15 | 55 | 19.10 | NS | NS |
| – With severe HYPOK | 1 | 2.38 | 7 | 13.73 | – | 4 | 7.55 | 6 | 10.91 | – | – |
| – With moderate HYPOK | 23 | 54.76 | 22 | 43.14 | – | 24 | 45.28 | 21 | 38.18 | – | – |
| – With mild HYPOK | 18 | 42.86 | 22 | 43.14 | – | 25 | 47.17 | 28 | 50.91 | – | – |
| – mmol/patient (mean) | 36.67 | – | 39.69 | – | – | – | – | – | – | – | – |
| – With severe HYPOK | 40 | – | 45.71/40 | – | – | – | – | – | – | – | – |
| – With moderate HYPOK | 42.61 | – | 43.64 | – | – | – | – | – | – | – | – |
| – With mild HYPOK | 28.89 | – | 33.82 | – | – | – | – | – | – | – | – |
| – Duration in days (mean) | 1.5 | – | 2.37 | – | – | – | – | – | – | – | – |
| – With severe HYPOK | 1 | – | 1.57 | – | – | – | – | – | – | – | – |
| – With moderate HYPOK | 1.43 | – | 2.91 | – | – | – | – | – | – | – | – |
| – With mild HYPOK | 1.61 | – | 2.91 | – | – | – | – | – | – | – | – |
| Treated PO | 146 | 49.66 | 135 | 45.92 | NS | 149 | 51.03 | 187 | 64.93 | <0.001 | <0.001 |
| – With severe HYPOK | 1 | 0.68 | 9 | 6.67 | – | 3 | 2.01 | 7 | 3.74 | – | – |
| – With moderate HYPOK | 33 | 22.60 | 35 | 25.93 | – | 36 | 24.16 | 34 | 18.18 | – | – |
| – With mild HYPOK | 112 | 76.71 | 91 | 67.41 | – | 110 | 73.83 | 146 | 78.07 | – | – |
| – mmol/patient (mean) | 47.74 | – | 59.97 | – | – | – | – | – | – | – | – |
| – With severe HYPOK | 88 | – | 123.78 | – | – | – | – | – | – | – | – |
| – With moderate HYPOK | 63.57 | – | 83.83 | – | – | – | – | – | – | – | – |
| – With mild HYPOK | 42.71 | – | 44.48 | – | – | – | – | – | – | – | – |
| – KCI vials to drink (20 mmol potassium chloride) | 2 | 0.68 | 28 | 9.52 | p <0.05 | 0.00 | 61 | 21.18 | - | p <0.001 | |
| – With severe HYPOK | 0.00 | 8 | 28.57 | – | 0.00 | 5 | 8.20 | – | – | ||
| – With moderate HYPOK | 2 | 100.00 | 12 | 42.86 | – | 0.00 | 12 | 19.67 | – | – | |
| – With mild HYPOK | 0.00 | 8 | 28.57 | – | 0.00 | 44 | 72.13 | – | – | ||
| – mmol /patient (mean) | 20 | – | 66.43 | – | – | – | – | – | – | – | – |
| – With severe HYPOK | – | – | 80 | – | – | – | – | – | – | – | – |
| – With moderate HYPOK | 20 | – | 63.33 | – | – | – | – | – | – | – | – |
| – KCI Retard Zyma (8 mmol potassium chloride) | 116 | 39.46 | 76 | 25.85 | <0.05 | 122 | 41.78 | 129 | 44.79 | – | – |
| – With severe HYPOK | 1 | 0.86 | 3 | 3.95 | - | 2 | 1.64 | 2 | 1.55 | – | – |
| – With moderate HYPOK | 27 | 23.28 | 11 | 14.47 | – | 30 | 24.59 | 21 | 16.28 | – | – |
| – With mild HYPOK | 88 | 75.86 | 62 | 81.58 | – | 90 | 73.77 | 106 | 82.17 | – | – |
| – mmol/patient (mean) | 34.14 | – | 28.37 | – | – | – | – | – | – | – | – |
| – With severe HYPOK | 48 | – | 41.33 | – | – | – | – | – | – | – | – |
| – With moderate HYPOK | 41.78 | – | 35.55 | – | – | – | – | – | – | – | |
| – With mild HYPOK | 31.64 | – | 25.94 | – | – | – | – | – | – | – | – |
| – Kalium Hausmann (30 mmol potassium citrate) | 32 | 10.88 | 37 | 12.59 | NS | 31 | 10.62 | 6 | 2.08 | – | – |
| – With severe HYPOK | 0.00 | 1 | 2.70 | – | 1 | 3.23 | 1 | 16.67 | – | – | |
| – With moderate HYPOK | 7 | 21.88 | 12 | 32.43 | – | 9 | 29.03 | 3 | 50.00 | – | – |
| – With mild HYPOK | 25 | 78.13 | 24 | 64.86 | – | 21 | 67.74 | 2 | 33.33 | – | – |
| – mmol/patient (mean) | 68.44 | – | 77.03 | – | – | – | – | – | – | – | – |
| – With severe HYPOK | – | – | 30 | – | – | – | – | – | – | – | |
| – With moderate HYPOK | 72.86 | – | 87.5 | – | – | – | – | – | – | ||
| – With mild HYPOK | 67.20 | – | 73.75 | – | – | – | – | – | – | – | |
| Treated both IV and PO | 22 | 7.48 | 30 | 10.20 | NS | 16 | 5.48 | 21 | 7.29 | – | – |
| – With severe HYPOK | 1 | 4.55 | 7 | 23.33 | – | 2 | 12.50 | 5 | 23.81 | – | – |
| – With moderate HYPOK | 11 | 50.00 | 17 | 56.67 | – | 11 | 68.75 | 11 | 52.38 | – | – |
| – With mild HYPOK | 10 | 45.45 | 6 | 20.00 | – | 3 | 18.75 | 5 | 23.81 | – | – |
| – mmol/patient (mean) | 74.45 | – | 106.33 | – | – | – | – | – | – | – | – |
| – With severe HYPOK | 88 | – | 136.28 | – | – | – | – | – | – | – | – |
| – With moderate HYPOK | 79.45 | – | 102.12 | – | – | – | – | – | – | – | – |
| – With mild HYPOK | 67.60 | – | 83.33 | – | – | – | – | – | – | – | – |
| EOC = Ente Ospedaliero Cantonale; EOC* = EOC without ODL; HYPOK = hypokalaemia; IV = intravenous; NS = not significant; ODL = Ospedale Regionale di Locarno; PO = oral | |||||||||||
As reported in the literature, our baseline audit performed in 2012 confirmed that one in five inpatients present with hypokalaemia. In up to half of the cases, and often in relation to diuretic therapy, the electrolyte disorder begins during hospitalisation. In about 60% of patients serum potassium levels normalise prior to discharge, whereas the electrolyte disturbance is neither managed nor monitored in one out of five patients. Time to normalisation is short (about 3 days), and is faster when intravenous administration is the chosen route. Serum magnesium was checked in only about 20% of hypokalaemic patients, and was found to be abnormal in about 20% of cases. This suggests that hypomagnesaemia associated with hypokalaemia could have gone undiagnosed in four out of five patients.
The small differences between hospitals (independently guided by professionals trained in different universities) in the baseline audit, and between the survey results and the literature, suggest that the limits are not primarily attributable to medical culture or to patient management practices, but rather to systemic dysfunctions that have a tendency to appear similarly in different hospitals. In particular, these dysfunctions include a lack of awareness of the abnormal value, and disregard for the problem within the context of complex patient management and of multiple comorbidities.
About 80% of patients with hypokalaemia in the ODL sample population selected for the audit had already been tested for potassium during a previous hospitalisation, and 60% of these patients already had hypokalaemia at that time, thus suggesting that the electrolyte disorder tends to be chronic on the one hand, and that it is a nonspecific indicator of a chronic condition and of the need for hospitalisation on the other.
A small percentage (about 1%) of patients who presented with hypokalaemia developed hyperkalaemia during hospitalisation. Hyperkalaemia was ascribed to late serial monitoring of serum potassium levels in one-third of cases (later than 72 hours after initiation of replacement therapy), to continuation of replacement therapy following serum potassium normalisation in one-fourth, and to either inappropriate potassium doses or an inappropriate administration route used for replacement (intravenous vs oral) in another one-fourth. Despite the alarming rate of hyperkalaemia that developed within a framework of inappropriate management, luckily enough no patient had hyperkalaemia with significant clinical consequences, and this held true even if serum potassium concentrations exceeded 6 mmol/l, as in 30% of cases or even 7 mmol/l (in one case). These observations confirm once again how inappropriate management tends to occur even in settings where baseline knowledge is available. A few, luckily isolated, cases are particularly alarming, namely when replacement therapy was carried on without any changes even though a serial laboratory value was available indicating normal or elevated serum potassium concentrations.
On the other hand, besides a tendency to become chronic, poorly reported hypokalaemia is also a problem for appropriateness and continuity of care. We have observed that follow-up potassium testing was ordered by primary care physicians in only two-fifths of patients. When analysing the causes, we confirmed that the primary care physician had been informed of the electrolyte abnormality either in the written discharge summary or by enclosing a copy of the abnormal laboratory test results in only three-fifths of cases. However, we have not observed any difference in the rate of follow-up testing in relation to the quality of the information received or to the total lack of information. To further confirm the tendency of this condition to become chronic, as well as the importance of follow-up potassium testing, we found out that 50% of patients readmitted to an EOC hospital after the sampled event were still or newly hypokalaemic. It can, therefore, be concluded that the problem tends to become chronic on the one hand, and to be disregarded both during patient assessment and in the final discharge summary on the other. Surprisingly enough, the quality of information did not seem to significantly affect the patient management strategy after these sampled admissions.
The average length of stay was almost double for hypokalaemic than for normokalaemic patients, i.e. 11 vs 6 days, with double incidences of falls and mortality. In this regard, it is worth remembering how hypokalaemia is a nonspecific severity and comorbidity marker, as well as a risk factor for both severity and comorbidity.
The analysis of the relationship between severity, as reflected in the case mix index (CMI), and length of stay, as reflected in the comparative performance index (CPI), confirmed that the presence of hypokalaemia considerably shifts the balance towards inefficiency, that is towards a longer length of stay than the expected length of stay based on SwissDRG severity (severity calculated using the Swiss Diagnosis Related Group classification).
The efficacy of the educational activities and of the revised internal guidelines (see appendix 2) has been proven by the results of the follow-up analysis on the patients hospitalised in 2014 and on the auditing of the second sample. The primary endpoint, to increase by at least 10% the percentage of hypokalaemic patients with normalisation of the electrolyte disorder, was however not reached despite a statistically and clinically significant improvement (+7.3%). The relative risk of non-normalisation for the hospitals in the benchmarking group was 1.14 (95% confidence interval 1.09–1.19). The three safety secondary endpoints, instead, documented an improvement even if the first and the third ones were attained only partially: (i) reducing to zero the percentage of hypokalaemic patients without serum potassium monitoring during hospital stay (significantly lowered from 20 to 8%), (ii) not increasing the incidence of hyperkalaemia in treated hypokalaemic patients, and (iii) performing a second blood draw in every patient with severe hypokalaemia prior to implementing therapeutic decisions (97.4% was attained). With regard to the two secondary endpoints aimed at testing the adherence to guidelines, an improvement was also proven: (i) screening hypokalaemic patients for hypomagnesaemia (significantly increased from 20 to 60%) and (ii) using potassium chloride instead of potassium citrate for oral replacement in nonacidotic patients (significantly lowered from 13 to 2%).
It can therefore be concluded that hypokalaemia is one of those intrahospital problem-prone issues for which dysfunctional management becomes immediately evident after initiating a systematic analysis, and that hypokalaemic patients are a subpopulation for whom a favourable ratio between severity (calculated using diagnosis at discharge) and length of stay cannot be maintained.
Simple educational programmes based on guidelines and staff training can significantly improve efficiency in the management of hypokalaemic patients. However, in order to continuously address diagnostic-therapeutic dysfunctions and to be more incisive in their correction, it would be of interest to introduce – besides ongoing staff education – an effective monitoring system that could benefit from both computerised alert systems (for both hypo- and hyperkalaemia) and dynamic prescribing tools with embedded basic patient information (including risk factors for hypo- and hyperkalaemia) that appears on screen when prescribing potassium replacement. Both opportunities have already been explored at least partially in previous studies: however further trials would be useful for evaluating their impact, redefining their contents, and promoting awareness of the issues associated with the management of hypokalaemia.
Last but not least, hypokalaemia could be used as an indicator to indirectly account for the actual costs for the management of patients with multiple comorbidities and to allocate resources accordingly.
Appendix 1: Patient record audit check-list http://www.smw.ch/fileadmin/smw/pdf/smw-14320-Appendix-01.pdf
Appendix 2: Internal recommendations for the management of hypokalaemia http://www.smw.ch/fileadmin/smw/pdf/smw-14320-Appendix-02.pdf
1 Gennari FJ. Hypokalemia. N Engl J Med. 1998;339(7):451–8.
2 Weiner ID, Wingo CS. Hypokalemia; consequences, causes, and correction. J Am Soc Nephrol. 1997;8(7):1179–88.
3 Paltiel O, Salakhov E, Ronen I, Berg D, Israeli A. Management of severe hypokalemia in hospitalized patients: a study of quality of care based on computerized databases. Arch Intern Med. 2001;161(8):1089–95.
4 Lippi G, Favaloro EJ, Montagnana M, Guidi GC. Prevalence of hypokalaemia: the experience of a large academic hospital. Intern Med J. 2010;40(4):315–6.
5 Greenlee M, Wingo CS, McDonough AA, Youn JH, Kone BC. Narrative review: evolving concepts in potassium homeostasis and hypokalemia. Ann Intern Med. 2009;150(9):619–25.
6 Lawson DH, Henry DA, Lowe JM, Gray JM, Morgan HG. Severe hypokalemia in hospitalized patients. Arch Intern Med. 1979;139(9):978–80.
7 Paice BJ, Paterson KR, Onyanga-Omara F, Donnelly T, Gray JMB, Lawson DH. Record linkage study of hypokalemia in hospitalized patients. Postgrad Med J 1986;62:187–91.
8 Katerinis I, Fumeaux Z. Hypokaliémie: diagnostic et prise en charge. Rev Med Suisse. 2007;3(101);579–82. French.
9 Bloomfield RL, Wilson DJ, Buckalew VM Jr. The incidence of diuretic-induced hypokalemia in two distinct clinic settings. J Clin Hypertens. 1986;2(4):331–8.
10 Wehling M. Morbus diureticus in the elderly: epidemic overuse of a widely applied group of drugs. J Am Med Dir Assoc. 2013;14(6):437–42.
11 Tannen RL. Potassium Disorders. In: JP Kokko. RL Tannen. Differential Diagnosis and Management of Fluid. Electrolyte, and Acid-Base Disorders. WB Saunders, Philadelphia, 197–198, 1986.
12 Squires RD, Huth EJ. Experimental potassium depletion in normal human subjects. I. Relation of ionic intakes to the renal conservation of potassium. J Clin Invest. 1959;38;1134–48.
13 Palmer BF. Regulation of potassium homeostasis. Clin J Am Soc Nephrol. 2014 May 1; [Epub ahead of print].
14 Ernest D1, Chia M, Corallo CE. Profound hypokalaemia due to Nurofen Plus and Red Bull misuse. Crit Care Resusc. 2010;12(2):109–10.
15 Lehnhardt A, Kemper MJ. Pathogenesis, diagnosis and management of hyperkalemia. Pediatr Nephrol. 2011;26(3):377–84.
16 Crop MJ, Hoorn EJ, Lindemans J, Zietse R. Hypokalaemia and subsequent hyperkalaemia in hospitalized patients. Nephrol Dial Transplant. 2007;22(12):3471–7.
17 Wong KC, Schafer PG, Schultz JR. Hypokalemia and anesthetic implications. Anesth Analg. 1993;77(6):1238–60.
18 Burton RG, Post T. Clinical Physiology of Acid-Base and Electrolyte Disorders. 5th ed. New York, NY: McGraw-Hill; 2001.
19 Tuot D. Too Much, Too Fast. AHRQ WebM&M. http://webmm.ahrq.gov/printviewCase.aspx?caseID=333.
20 Gennari FJ. Disorders of potassium homeostasis. Hypokalemia and hyperkalemia. Crit Care Clin. 2002;18:273–88.
21 Hemstreet BA, Stolpman N, Badesch DB, May SK, McCollum M. Potassium and phosphorus repletion in hospitalized patients: implications for clinical practice and the potential use of healthcare information technology to improve prescribing and patient safety. Curr Med Res Opin. 2006;22:2449–55.
22 “Highalert” medications and patient safety. Int J Qual Health Care. 2001;13:339–40.
23 Cohn JN, Kowey PR, Whelton PK, Prisant LM. New guidelines for potassium replacement in clinical practice: a contemporary review by the National Council on Potassium in Clinical Practice. Arch Intern Med. 2000;160(16):2429–36.
24 Acker CG, Johnson JP, Palevsky PM, Greenberg A. Hyperkalemia in hospitalized patients: causes, adequacy of treatment, and results of an attempt to improve physician compliance with published therapy guidelines. Arch Intern Med. 1998;158:917–24.
25 Harrington L. Potassium protocols: in search of evidence. Clin Nurse Spec. 2005;19:137–41.
26 Kim GH, Han JS. Therapeutic approach to hypokalemia. Nephron. 2002;92(suppl 1):28–32.
27 Paltiel O, Gordon L, Berg D, Israeli A. Effect of a computerized alert on the management of hypokalemia in hospitalized patients. Arch Intern Med. 2003;163(2):200–4.
28 Schiff GD, Klass D, Peterson J, Shah G, Bates DW. Linking laboratory and pharmacy: opportunities for reducing errors and improving care. Arch Intern Med. 2003;163:893–900.
29 Kaushal R, Shojania KG, Bates DW. Effects of computerized physician order entry and clinical decision support systems on medication safety: a systematic review. Arch Intern Med. 2003;163:1409–16.
30 Vitullo F, Carinci F, Lepore V, Tognoni G. Aziende sanitarie e modelli di uso dei DRG. Il Pensiero Scientifico Editore, Roma, 1998.
Authors’ contributions: Each Author has contributed substantially to research, preparation and drafting of the paper, and approved its submission to the Swiss Medical Weekly.
Disclosure statement: The authors declare they have no competing interests.
This work was funded by a grant from Ente Ospedaliero Cantonale (EOC), Ticino, Switzerland. The sponsors of the study had no role in study design, data collection, data analysis, data interpretation, nor in writing the report.