DOI: https://doi.org/10.4414/smw.2015.14223
“The global plan to ‘STOP TB’ 2006–2015” by the World Health Organization (WHO) aims to eliminate tuberculosis (TB) by 2050 [1]. In 2013, 9 million new tuberculosis cases were reported, of which 1.5 million people died from TB. TB is a major cause of death worldwide, and the leading cause of death in individuals infected with the human immunodeficiency virus (HIV) in resource-limited areas [2]. Well-conducted 6-month TB treatment is effective: cure rates of >95% can be achieved in pulmonary TB under directly observed therapy [2–4]. In contrast, in resource-limited countries with a high TB incidence, the success rate can be as low as 40–60% [5].
Several factors complicate TB treatment. Case series [6, 7] and noncontrolled clinical studies [8–12] indicate that HIV infection may increase the risk of poor absorption of antituberculosis drugs, especially rifampicin. There are significant drug-drug interactions with antiretroviral therapy. Opportunistic infections and other comorbidities are of importance as well. Chronic diarrhoea, for instance, might influence efficacy of antituberculosis treatment. Hence, therapeutic drug monitoring could be an important tool to guide TB treatment. While the reference ranges reported by Peloquin are often used [13], no clear evidence links low antituberculosis drug serum concentrations to treatment failure. Few clinical studies have compared antituberculosis drug concentrations and clinical outcome [14, 15]. Furthermore, the results of studies are difficult to interpret as they differ in treatment duration, drug formulation, dosing regimen, time of sample collection and population [15–19].
The University Hospital of Zurich, Switzerland, is a large referral hospital caring for complex TB cases, on average 20 TB patients a year, and offering therapeutic drug monitoring of antituberculosis drugs since 2010. Our aim was to study retrospectively the characteristics and outcomes of patients with TB in whom therapeutic drug monitoring of first-line antituberculosis drugs was performed, and to determine whether maximum serum concentrations below published reference ranges influenced TB treatment outcome.
All adult inpatients and outpatients treated for TB were eligible if at least one antituberculosis drug serum concentration measurement was performed between August 2010 and April 2012. Patients were included if TB treatment was initiated on the basis of proven diagnosis or high suspicion of TB. Patients with a mycobacterial infection other than TB were excluded. The follow-up period lasted until the end of March 2014. In cases where treatment was not terminated at our institution, patients or their family physicians were contacted by phone and were asked about treatment outcome.
TB was proven if a sputum smear for acid-fast bacilli and culture or polymerase chain-reaction (PCR) testing of any specimen was positive forMycobacterium tuberculosis complex. TB was highly suspected if culture, PCR or sputum smear were negative but the clinical pattern was highly suggestive of TB [5], particularly in terms of the patient’s origin, possible exposure to TB, immunosuppression, fever, night sweats, weight loss of >10% within 6 months and radiological findings. Patients were treated for pulmonary, extrapulmonary or disseminated TB according to national and international recommendations [2, 3]. For pulmonary TB, patients received 2 months of isoniazid, rifampicin or rifabutin, pyrazinamide and ethambutol, followed by 4 months of isoniazid and rifampicin or rifabutin, with a longer duration of up to 12 months for TB meningitis or bone involvement. Changes of antituberculosis drug dosage were at the treating physicians’ discretion. Prolonged length of treatment was due to disease persistence.
Proposed sampling timepoints for therapeutic drug monitoring were 2, 4, and 6 hours after drug ingestion, without a firm protocol. Physicians were encouraged to adhere to these sampling times. Light-protected blood samples were transferred to the internal laboratory within 60 minutes of blood draw, and the serum was separated by centrifugation and frozen immediately until analysis (–20 °C).
Serum concentrations of the drugs were analysed by validated high-performance liquid chromatography tandem mass spectrometry methods. Intra- and inter-day imprecision was <10%, and intra- and inter-day inaccuracy was 90–110%. Matrix effects could be excluded during relevant times.
Clinical information was compiled from hospital medical records. Antituberculosis drug- and therapeutic drug monitoring-specific data included dosage at treatment onset, dose adjustments, antituberculosis drug resistance, sputum check-up data, ingestion time (fasting or not), adverse drug-reactions, treatment duration, treatment outcome, and reasons for therapeutic drug monitoring.
The study protocol was approved by the local ethics committee.
The highest measured value within a sampling period, independent of blood sampling time and frequency, was defined as the estimated maximum peak serum concentration (eCmax).Correlation of antituberculosis drug dose (mg) versus eCmax was investigated by use of linear regression analysis (Sigma Plot version 12.0). For outcome comparisons, eCmax was classified as either “within reference range”, “low eCmax”, or “very low eCmax”, based on published levels [13, 15]. Low eCmax-levels were defined as follows: isoniazid 2–3 mg/l, rifampicin 4–8 mg/l, rifabutin 0.2–0.3 mg/l and ethambutol 1–2 mg/l. Very low eCmax levels were defined as isoniazid <2 mg/l, rifampicin <4 mg/l, rifabutin <0.2 mg/l and ethambutol <0.1 mg/l. As a result of a lack of pyrazinamide differentiation for low and very low levels, only “low eCmax” was defined as below the lower limit of the reference range of <20 mg/L. In cases of multiple eCmaxvalues in a patient with several sampling periods, the attribution to one of the groups was based on two-thirds of the values being within the above predefined ranges. Treatment outcome was defined according to WHO guidelines (cured, treatment completed, treatment failure, death) based on clinical presentation, imaging and microbiological findings [2].
| Table 1: Baseline characteristics of the 17 enrolled patients with proven or highly suspected tuberculosis. | ||
| Characteristics, n (% or range) | n | |
| Median age (yrs) at time of TB diagnosis | 39 (21–71) | |
| Male gender | 10 (59) | |
| Region of origin | Switzerland | 4 |
| Other European countries | 3 | |
| Sub-Saharan Africa | 6 | |
| Asia | 1 | |
| Central/ South America | 3 | |
| History of previous TB treatment | 12 (71) | |
| Median BMIa, at the time of TB diagnosis | 22.4 (13.0–32.7) | |
| Tobacco smoker | 5 (29) | |
| Self-reported alcohol consumptionb | Nondrinkers / moderate drinkers | 12 (71) |
| Heavy drinkers | 2 (12) | |
| Previous harmful alcohol use | 1 (6) | |
| Unknown | 2 (12) | |
| Comorbidities | HIV-infected individuals | 7 (41) |
| HIV-infected individuals on ART | 6 (36) | |
| Diabetes | 2 (12) | |
| Othersc | 13 (76) | |
| Diagnosis | Proven TB | 14 (82) |
| Highly suspected TB | 3 (18) | |
| ART = antiretroviral therapy; HIV = human immunodeficiency virus; TB = tuberculosis The percentages were rounded and may not sum 100%. a Body mass index (weight [kg] / square of height [m2]), b moderate drinkers defined as women not more than one drink a day, men not more than two drinks a day; heavy drinkers defined as more than seven drinks per week or three per occasion or more than 14 drinks per week or four per occasion c stem cell transplantation and chemotherapy due to multiple myeloma, cerebral toxoplasmosis, renal failure, Pneumocystis jiroveci-pneumonia, pulmonary aspergillosis, chronic hepatitis C | ||
| Table 2: Individual eCmax a of isoniazid (INH), rifampicin (RMP), rifabutin (RFB), pyrazinamide (PZA), and ethambutol (EMB) and outcome of tuberculosis (TB). | ||||||||||
| Patient | TB diagnosis | Comorbidity | TB manifestation | INH eCmax | RMP eCmax | RFB eCmax | PZA eCmax | EMB eCmax | Days of treatment | Outcome |
| 1 | Proven | No | Disseminated | ↓↓ | ↓ | NA | ↓ | = | 450 | Cured |
| 2 | Proven | HIV | Bone | ↓ | NA | * | NA | ↓ | 899 | Cured |
| 3 | Proven | HIVb | Disseminated | * | NA | * | = | NA | 168 | Cured |
| 4 | Proven | HIVc | Disseminated | = | = | NA | ↑ | ↓ | 23 | Died from TB |
| 5 | Proven | No | Lymph node | NA | ↓ | NA | = | NA | 182 | Cured |
| 6 | Proven | HIV | Pulmonary | ↓↓ | ↓↓ | NA | = | NA | 350 | Cured |
| 7 | Proven | SCTd | Disseminated | ↓↓ | ↓↓ | NA | ↓ | NA | 145 | Cured |
| 8 | Proven | No | Bone | ↓↓ | ↓↓ | NA | NA | NA | 372 | Cured |
| 9 | Proven | HIV | Disseminated | ↓↓ | NA | ↓↓ | = | * | 270 | Cured |
| 10 | Proven | No | Abscess | NA | ↓↓ | NA | NA | NA | 363 | Cured |
| 11 | Proven | HIV | Disseminated | ↓↓ | NA | * | ↑ | = | 183 | Cured |
| 12 | Proven | Pancreas Cae | Pulmonary | ↓↓ | ↓↓ | NA | = | = | 206 | Cured |
| 13 | Proven | HIVf | Pulmonary | ↓↓ | NA | * | = | NA | 189 | Cured |
| 14 | Proven | No | Bone | ↓↓ | ↓ | NA | ↑ | NA | 719 | Cured |
| 15 | Highly suspected | No | Bone | ↓↓ | ↓ | NA | = | NA | 369 | Cured |
| 16 | Highly suspected | No | Lymph node | ↓ | = | NA | NA | NA | 263 | Cured |
| 17 | Highly suspected | No | Disseminated | NA | NA | NA | NA | = | 237 | Cured |
| a estimated Cmax is the defined highest measured concentration independent of sampling collection time Other comorbidities: b Pneumocystis jiroveci pneumonia. c suspected tuberculous meningitis. d pulmonary aspergillosis and cerebral toxoplasmosis. e pancreas carcinoma. f stem cell transplantation (SCT) due to multiple myeloma. More than or equal to 66% of the measurements were: = within reference range, ↓ low concentrations (INH 2–3 mg/l, RMP 4–8 mg/l, RFB 0.2–0.3 mg/l, PZA 10–20 mg/l, EMB 1–2 mg/l), ↓↓ very low concentrations (INH <2 mg/l, RMB <4 mg/l, RFB <0.2 mg/l, PZA <10 mg/l, EMB <1 mg/l), * no significant trend to a defined range, NA not available i.e. drug was not part of the treatment regimen or measurement not done | ||||||||||
A total of 17 patients were included. Baseline characteristics are summarised in table 1. Three patients presented with pulmonary TB, and 14 patients with disseminated or extra-pulmonary TB. TB was proven in 14 patients, and highly suspected in three patients (table 2).
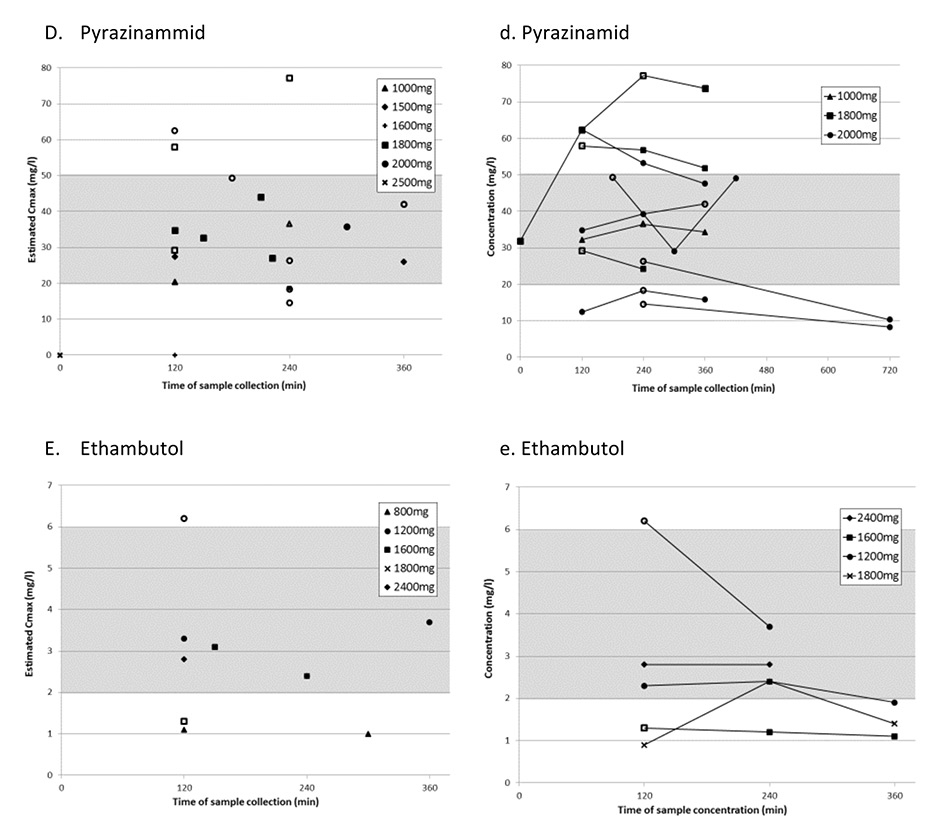
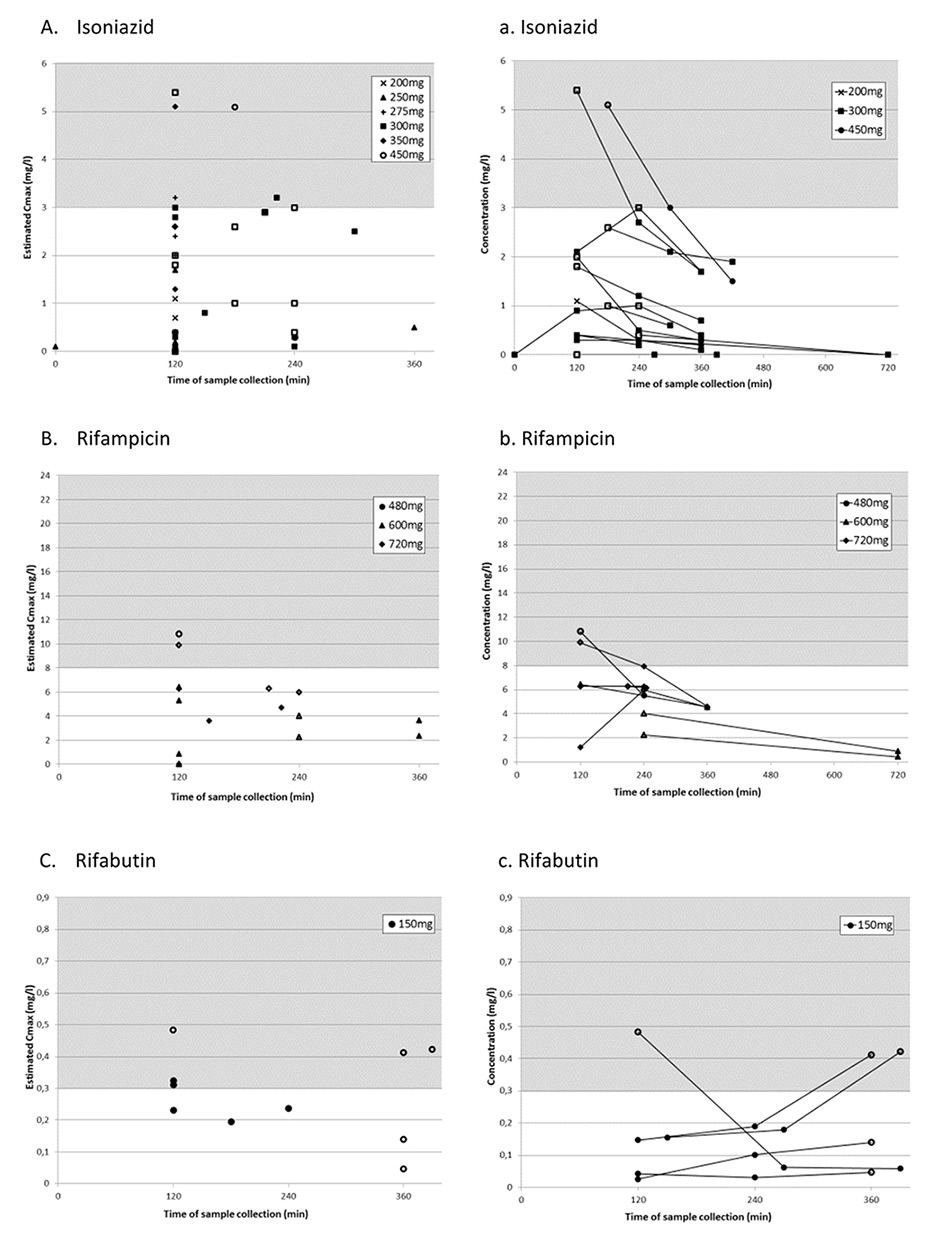
Figure 1
Panels A-E represent the highest measured concentration (estimated Cmax) from each sampling period for each antituberculosis drug with its corresponding dosages.
Panels a-e represent sampling periods with multiple consecutive measurements.
For all panels: Grey area shows published reference ranges [13]. White symbols represent antituberculosis drug levels determined during multiple sampling periods, black symbols represent levels determined in periods with only one sample taken.
The TB treatment regimen consisted of first-line single-component antituberculosis drugs or fixed-dose combinations. In Switzerland, licensed antituberculosis drugs include four fixed-dose combinations (consisting of two to four drugs) and seven single component antituberculosis drugs. The initial dosages for all antituberculosis drugs were prescribed as recommended in the product information; in cases using single component antituberculosis drugs the approximate weight-adapted dosage was chosen (table 3).
Eight patients had directly observed therapy, four patients took their drugs without supervision and no information regarding drug observed therapy was available for the remaining patients. Three of all patients took antituberculosis drugs with or after meals to prevent nausea and eight patients took their antituberculosis drugs while fasting. In six patients timing in regard to meals was not documented. Most patients (15/17) received comedication during the study period. These were mainly HIV protease inhibitors (5/17 patients) and Pneumocystis jirovecii/ Toxoplasma gondiiprophylaxis. Patients on antiretroviral therapy with a protease inhibitor received 150 mg rifabutin three times a week instead of daily rifampicin. Nine patients were intermittently treated with steroids owing to cerebral or myelin involvement, or immune reconstitution inflammatory syndrome. In 10 of 17 cases second-line TB drugs, including fluoroquinolones, macrolides and aminoglycosides, were coadministered. Seven of the 17 patients were treated according the TB guidelines with initially four followed by two antituberculosis drugs [3]. Three patients received in addition to the usual TB-therapy fluoroquinolones, macrolides and aminoglycosides between 2 to 90 days until drug sensitivity results were available. In two patients a first-line antituberculosis drug was substituted by a fluoroquinolone because of toxicities. In the remaining five patients second-line antituberculosis drugs were added either because of delayed treatment response or lack of drug sensitivity tests. Only in two cases fluoroquinolones were administered for the whole treatment period.
Sixteen of 17 (94%) patients completed therapy and were cured, based on WHO guidelines definition. Median treatment duration among all 17 patients was 317 days (range 23–899 days, table 2). TB treatment of more than 12 months was observed in patients with bone involvement, spondylitis or disseminated TB. The median time for sputum conversion by microscopy and culture in patients with pulmonary TB was 17 days, which was documented in all but one patient. In one patient with a lack of sputum conversion and progressive radiological findings after the first 2 months of recommended TB treatment (isoniazid 300 mg, rifampicin 600 mg, pyrazinamide 1 500 mg and ethambutol 1 200 mg), this regimen was extended for another 3 months and expanded to the combination of five drugs, including moxifloxacin. In this case of delayed treatment response, a single blood sample at 6 h after drug ingestion was collected for isoniazid, rifampicin and pyrazinamide. The measurement showed isoniazid and rifampicin concentrations below and only the pyrazinamide value within the reference range. Even though isoniazid and rifampicin doses were not increased, sputum conversion was confirmed after 5 months of TB treatment.
We examined the concentrations of five antituberculosis drugs in 175 serum samples of 17 patients. In 12 (71%) patients, blood samples for therapeutic drug monitoring were collected repeatedly during TB treatment. In 14 (82%) patients, the first sampling was performed 6 days to 2 months after treatment start; in three patients the first therapeutic drug monitoring was performed after 6 months.
Physicians ordered therapeutic drug monitoring in the following situations: no or delayed clinical improvement despite accurate antituberculosis drug administration in four (24%) patients, clinical worsening in three (18%) patients, absence of urinary isoniazid detection in two (12%) patients, and suspected antituberculosis drug toxicity in five (29%) patients (elevated liver function parameters, polyneuropathy). Therapeutic drug monitoring was performed after antituberculosis drug dose adjustment in 7 (41%) patients. In four patients the dose was adjusted without follow-up measurements. The most frequently reported reasons for dose adjustments were low eCmax levels,weight increase during the treatment period, change to fixed-dose combinations, and drug-drug interactions.
One fourth of the measurements were not collected at the suggested sampling times. They were performed at any time between 0 h (trough level) and 12 h after dosing. However, most measurements were collected at 2 h (35%) and 4 h (23.5%). Fifty-seven (33%) of 175 determinations were measured at one time only and defined as eCmax. Of these, 49% were collected 2 h after drug intake.
In all but one patient (94%), at least one eCmaxvalue was below the reference range. Furthermore, five of 17 patients (29%) had single measurements with antituberculosis drug concentrations below the detectable range. Estimated Cmax was below the reference range in 78% of isoniazid, 90% of rifampicin and 50% of rifabutin measurements (table 3 and fig. 1A–C). In contrast, 30% of pyrazinamide and ethambutol eCmax values were below the reference range. Estimated Cmax was mainly at 2 h with all antituberculosis drugs except pyrazinamide, for which 30% of eCmax values were at 2 h and 4 h after drug intake, respectively (table 3).
Eight of 12 patients with follow-up measurements repeatedly showed low levels of at least one drug. Dose was augmented in seven of these 12 patients. Isoniazid dose was increased up to 450 mg daily in four patients. In follow-up measurements of isoniazid eCmax, three patients showed levels within the reference range. Dose-adaption of ethambutol in one patient resulted in serum concentrations within the range. No increase of the serum concentrations of pyrazinamide was documented after dose adjustment. No significant correlation between dosage and eCmax was found for any antituberculosis drug (R2 <0.09).
In one case of disseminated TB treatment was stopped after 6 months owing to possible drug-induced liver injury and persistent liver enzyme elevation, despite treatment cessation. In three other cases therapy was temporarily interrupted as a result of transitionally elevated liver enzymes, transient polyneuropathy, or neuropathy of the optic nerve. After restarting treatment with antituberculosis drugs no further symptoms were documented.
All patients were cured except one who died from disseminated TB, suspected TB meningitis and untreated HIV infection (3 CD4 cells/mcl and HIV-1-RNA 1 Mio copies/mL) within 23 days after starting TB treatment, after he had presented very late. There were no reports of relapse or reinfection among the other patients after completion of therapy up to the conclusion of the study period in March 2014. One patient was lost to follow-up because he had left the country.
| Table 3: Comparison and categorisation of estimated Cmax with published reference ranges for first-line antituberculosis drugs (ATD). | |||||||||
| Daily dose (mg/kg of body weight range) | Reference range of absolute Cmaxa (usual dose)b | Median eCmaxa mg/l, (range) | eCmaxa categories | Time point at which eCmaxa was determined %e | |||||
| Within reference rangeb | Lowc | Very lowd | C2h | C4h | C6h | ||||
| INH | 200–450 mg (3.13–9.38) | 3–6 mg/l (300 mg/d) | 1.2 (<0.1–5.4) | 21.6% | 21.6% | 57% | 60.5% | 15.8% | 2.6% |
| RMP | 480–720 mg (7.5–10.67) | 8–24 mg/l (600 mg/d) | 3.8 (<0.02–10.82) | 10% | 35% | 55% | 50% | 15% | 10% |
| RFB | 600 mg (2.03–11.67) | 0.3–0.9 mg/l (300 mg/d) | 0.274 (0.047–0.483) | 50% | 30% | 20% | 40% | 10% | 30% |
| PZA | 1000–1500 mg (18.75–39.84) | 20–50 mg/l (25 mg/kg/d) | 30.7 (<5.0–77.2) | 70% | 30% | – | 30.4% | 30.4% | 8.7% |
| EMB | 800–2400 mg (18–25) | 2–6 mg/l (25 mg/kg/d) | 2.6 (1.0–6.2) | 70% | 30% | 0% | 50% | 20% | 10% |
| EMB = ethambutol INH = isoniazid; PZA = pyrazinamide; RFB = rifabutin; RMP = rifampicin a Estimated Cmax defined as highest measured serum concentration independent of sampling time. b Reference ranges (Peloquin, C.A, Therapeutic drug monitoring in the treatment of tuberculosis. Drugs. 2002;62(15):2169–83 [13]. c Defined as INH 2–3 mg/l, RMP 4–8 mg/l, RFB 0.2–0.3 mg/l, PZA <20 mg/l, EMB 1–2 mg/l. d Defined as INH <2 mg/l, RMP <4 mg/l, RFB <0.2 mg/l, EMB <1 mg/l. e Single and multiple sampling. | |||||||||
In this retrospective analysis of 17 patients, all but one patient were cured from TB even though 64% of all eCmaxvalues of first-line TB drugs were found to be below the widely used reference ranges [13]. Isoniazid and rifampicin eCmax were below the reference ranges in a high percentage of cases (>80%), whereas pyrazinamide and ethambutol eCmax were within the reference range in most of the samples (>70%).
Our results are in line with those of several other studies reporting a high prevalence of low antituberculosis drug serum concentrations in TB patients with or without HIV coinfection and daily drug administration [10, 16, 17, 20–23]. All investigators measured drug concentrations 2 hours after drug intake, and some at 6 hours. A high percentage of low serum concentrations were found for isoniazid and rifampicin especially. However, most studies were purely descriptive, and the correlation with the treatment outcome was not investigated, or was inconclusive. So far, only two prospective studies have systematically investigated the association of low antituberculosis drug levels and treatment outcome. Chideya et al. investigated 225 patients for treatment outcome and antituberculosis drug pharmacokinetics (i.e., area under the concentration-time curve [AUC] 0-6h and peak concentrations [Cmax]) in Botswana [15]. Although 85% of all rifampicin levels (Cmax) and 37% of the isoniazid levels were below the reference ranges, only a pyrazinamide Cmax below the reference range was associated with treatment failure. In a prospective study by Burhan et al. C2h levels were determined in 181 patients and correlated with treatment outcome at week 4 and 8 [23]. Similarly low C2h levels were observed in a high proportion of patients, but only low pyrazinamide levels were associated with poor treatment outcome.
The similar prevalence of low antituberculosis drug levels in these studies and the lack of correlation with the outcome, or TB recurrence, suggest that the reference ranges defined for isoniazid and rifampicin might not represent the plasma concentrations reached with usual doses in TB patients but rather represent pharmacokinetic data of healthy volunteers from which they were derived. Furthermore, at least some of these ranges probably do not represent the therapeutic range in combined TB treatment. This would explain the favourable outcome in our patients who had a high rate of low and very low isoniazid and rifampicin levels.
In-vitro data show a clear concentration-dependent effect on Mycobacterium tuberculosis for all first-line antituberculosis drugs [24]. Rifampicin and isoniazid have the highest bactericidal activity in vitro, those of ethambutol and pyrazinamide are considerably lower [25]. In susceptible Mycobacterium tuberculosis,rifampicin and isoniazid minimal inhibitory concentrations are much lower than the usual antituberculosis drug serum concentration achieved, while the minimal inhibitory concentration values for ethambutol and pyrazinamide are closer to the drug levels [26]. These observations might explain the association of low pyrazinamide levels with treatment failure and the favourable outcome despite low isoniazid and rifampicin levels.
Indeed, only studies that correlated outcome with a once weekly or twice weekly regimen of isoniazid and rifampicin found a significant association between low plasma concentrations and poor outcome [27–29]. This indicates that effective plasma concentrations are not reached by low dosing regimens. On the other hand, higher than standard rifampicin doses were correlated with a faster sputum conversion, which implies the possibility of a shorter TB treatment duration due to the concentration-dependent antimycobacterial effect [30]. Mehta et al. showed low concentrations of rifampicin in a subgroup of patients with documented slow response to the standard treatment regimen [29]. Dose adjustments for rifampicin from the conventionally used 600 mg up to 900 mg resulted in Cmax within reference ranges with good treatment outcomes in all patients. This result emphasises the dose-dependent effect of rifampicin.
The 2 h postdose concentration was reported to be the most informative pharmacokinetic sampling time if consecutive measurements are not possible to determine true peak concentrations [13]. Because of a delay of drug absorption in some patients, a second sampling is recommended 4–6 h after drug intake. In our patients, about one-third of samples were taken at 2 h. Several patients had only one measurement, and some had multiple samples taken, mostly 2–4 and 4–6 h postingestion, enabling a more exact estimation of peak antituberculosis drug concentration (fig. 1a–e).
We found that the time to reach peak concentrations was variable in the multiple samples and patients. When C2h value was low in patients after single determinations, it was difficult to differentiate between real low concentrations and missed peak concentrations. Peak concentrations for rifabutin were most often reached after 6 h (fig. 1c), which was later than expected from other pharmacokinetic studies, where the peak level was usually reached at 3–4 h [31]. This delay of absorption in our patients may be due to drug intake with food. In two of our patients target range would have been missed in the case of a single determination at 2 h. This underlines the importance of an additional determination at 4 h for rifabutin and pyrazinamide, if the drug is taken fasting as recommended. Delayed absorption was rarely seen with the remaining antituberculosis drugs. In patients with multiple sampling of rifampicin and isoniazid, C2h represented the peak concentration in most cases. According to literature, rifampicin peak serum concentration is typically reached 2 h postdose; therefore, C2h values for rifampicin below the reference range reflect an effective low Cmax[18, 32, 33]. However, isoniazid peak concentrations were frequently already reached after 0.5-1.5 h [34–36], and C2h values underestimate true peak concentrations, especially in fast acetylators with a short isoniazid half-life of less than 2 h [36]. In our study, eCmaxof isoniazid was measured after 2 h in most cases (60%) (table 2 and fig. 1a), and the majority of these values were below the reference range. The 2 h sample time could explain the high proportion of very low isoniazid C2h values in our patients, as well as in the cited therapeutic drug monitoring studies. A significantly lower rate of isoniazid concentrations (37%) below the reference range were reported in the study of Chideya et al. [15], where the maximum serum concentration was determined by measurements at 1 h, in addition to 2 and 6 h. This implies that additional sampling of isoniazid after 1 h increases the probability of measuring true Cmax. Based on these findings we now recommend sampling after 1 h, 2 h and 4 h. If rifabutin is taken with food sampling after 6 h instead of 4 h is advisable.
Our retrospective analysis has several limitations. The sample size was small and the study was conducted among a heterogeneous group of patients with different sites of infection and treatment regimens. Duration of treatment was significantly longer for patients with TB involvement of the bone or disseminated TB. Blood sampling was done in the absence of a firm standard protocol. Finally, for patients who underwent therapeutic drug monitoring with subsequent dose adjustments, repeated serum measurements were not always performed. Favourable outcome might have been influenced by several factors such as prolongation of treatment, dose increase during treatment and addition of second line antituberulosis drug. Nevertheless, the strength of this study is the well described real life setting correlating the antituberculosis drug concentrations with a long-term clinical follow-up.
In summary, our study indicates a need to validate whether the reference ranges published by Peloquin, and widely used ever since, represent reliable therapeutic target concentrations that correlate with the TB treatment outcome in the clinical setting. Our data suggest that the therapeutic ranges for isoniazid and rifampicin might be below the suggested ranges of Peloquin et al., especially when combination treatment is used. A large prospective clinical trial in TB patients is needed to properly address the question of the optimal timing of drug level measurements for first-line antituberculosis drug in order to identify the true peak concentration and in order to correlate peak concentrations with TB treatment outcome. This will lay ground to reliably treat difficult TB cases guided by therapeutic drug monitoring.
Acknowledgments:We thank the patients, as well as the different medical teams of the University Hospital of Zurich caring for them and the persons in the laboratory.
1 The Global Plan To Stop TB 2011-2015. Geneva, Switzerland: World Health Organization. 2011.
2 Global tuberculosis control 2011. Geneva, Switzerland: World Health Organization. 2011.
3 Lungenliga. Handbuch Tuberkulose. Switzerland, Bundesamt für Gesundheit BAG. 2011. German.
4 Horne DJ, Hubbard R, Narita M, Exarchos A, Park DR, Goss CH. Factors associated with mortality in patients with tuberculosis. BMC Infect Dis. 2010;10:258.
5 Organization WH. World Health Organization, Treatment Of Tuberculosis Guidelines. World Health Organization, Geneva, Switzerland 2009, Fourth Edition.
6 Berning SE, Huitt GA, Iseman MD, Peloquin CA. Malabsorption of antituberculosis medications by a patient with AIDS. N Engl J Med. 1992;327(25):1817–8.
7 Patel KB, Belmonte R, Crowe HM. Drug malabsorption and resistant tuberculosis in HIV-infected patients. N Engl J Med. 1995;332(5):336–7.
8 Peloquin CA, MacPhee AA, Berning SE. Malabsorption of antimycobacterial medications. N Engl J Med. 1993;329(15):1122–3.
9 Gurumurthy P, Ramachandran G, Hemanth Kumar AK, Rajasekaran S, Padmapriyadarsini C, Swaminathan S, et al. Malabsorption of rifampin and isoniazid in HIV-infected patients with and without tuberculosis. Clin Infect Dis. 2004;38(2):280–3.
10 Tappero JW, Bradford WZ, Agerton TB, Hopewell P, Reingold AL, Lockman S, et al. Serum concentrations of antimycobacterial drugs in patients with pulmonary tuberculosis in Botswana. Clin Infect Dis. 2005;41(4):461–9.
11 Gurumurthy P, Ramachandran G, Hemanth Kumar AK, Rajasekaran S, Padmapriyadarsini C, Swaminathan S, et al. Decreased bioavailability of rifampin and other antituberculosis drugs in patients with advanced human immunodeficiency virus disease. Antimicrob Agents Chemother. 2004;48(11):4473–5.
12 Sahai J, Gallicano K, Swick L, Tailor S, Garber G, Seguin I, et al. Reduced plasma concentrations of antituberculosis drugs in patients with HIV infection. Annal Intl Med. 1997;127(4):289–93.
13 Peloquin CA. Therapeutic drug monitoring in the treatment of tuberculosis. Drugs. 2002;62(15):2169–83.
14 Narita M, Hisada M, Thimmappa B, Stambaugh J, Ibrahim E, Hollender E, et al. Tuberculosis recurrence: multivariate analysis of serum levels of tuberculosis drugs, human immunodeficiency virus status, and other risk factors. Clin Infect Dis. 2001;32(3):515–7.
15 Chideya S, Winston CA, Peloquin CA, Bradford WZ, Hopewell PC, Wells CD, et al. Isoniazid, rifampin, ethambutol, and pyrazinamide pharmacokinetics and treatment outcomes among a predominantly HIV-infected cohort of adults with tuberculosis from Botswana. Clin Infect Dis. 2009;48(12):1685–94.
16 Van Tongeren L, Nolan S, Cook VJ, FitzGerald JM, Johnston JC. Therapeutic drug monitoring in the treatment of tuberculosis: a retrospective analysis. Int J Tuberc Lung Dis. 2013;17(2):221–4.
17 Babalik A, Babalik A, Mannix S, Francis D, Menzies D. Therapeutic drug monitoring in the treatment of active tuberculosis. Can Respir J. 2011;18(4):225–9.
18 Heysell SK, Moore JL, Keller SJ, Houpt ER. Therapeutic drug monitoring for slow response to tuberculosis treatment in a state control program, Virginia, USA. Emerg Infect Dis. 2010;16(10):1546–53.
19 Holland DP, Hamilton CD, Weintrob AC, Engemann JJ, Fortenberry ER, Peloquin CA, et al. Therapeutic drug monitoring of antimycobacterial drugs in patients with both tuberculosis and advanced human immunodeficiency virus infection. Pharmacotherapy. 2009;29(5):503–10.
20 Um SW, Lee SW, Kwon SY, Yoon HI, Park KU, Song J, et al. Low serum concentrations of anti-tuberculosis drugs and determinants of their serum levels. Int J Tuberc Lung Dis. 2007;11(9):972–8.
21 Perlman DC, Segal Y, Rosenkranz S, Rainey PM, Remmel RP, Salomon N, et al. The clinical pharmacokinetics of rifampin and ethambutol in HIV-infected persons with tuberculosis. Clin Infect Dis. 2005;41(11):1638–47.
22 Kimerling ME, Phillips P, Patterson P, Hall M, Robinson CA, Dunlap NE. Low serum antimycobacterial drug levels in non-HIV-infected tuberculosis patients. Chest. 1998;113(5):1178–83.
23 Burhan E, Ruesen C, Ruslami R, Ginanjar A, Mangunnegoro H, Ascobat P, et al. Isoniazid, rifampin, and pyrazinamide plasma concentrations in relation to treatment response in Indonesian pulmonary tuberculosis patients. Antimicrob Agents Chemother. 2013;57(8):3614–9.
24 Pasipanodya J, Gumbo T. An oracle: antituberculosis pharmacokinetics-pharmacodynamics, clinical correlation, and clinical trial simulations to predict the future. Antimicrob Agents Chemother. 2011;55(1):24–34.
25 Dickinson JM, Aber VR, Mitchison DA. Bactericidal activity of streptomycin, isoniazid, rifampin, ethambutol, and pyrazinamide alone and in combination against Mycobacterium Tuberculosis. Am Rev Respir Dis. 1977;116(4):627–35.
26 Bottger EC. The ins and outs of Mycobacterium tuberculosis drug susceptibility testing. Clin Microbiol Infect. 2011;17(8):1128–34.
27 Weiner M, Burman W, Vernon A, Benator D, Peloquin CA, Khan A, et al. Low isoniazid concentrations and outcome of tuberculosis treatment with once-weekly isoniazid and rifapentine. Am J Respir Crit Care Med. 2003;167(10):1341–7.
28 Weiner M, Benator D, Burman W, Peloquin CA, Khan A, Vernon A, et al. Association between acquired rifamycin resistance and the pharmacokinetics of rifabutin and isoniazid among patients with HIV and tuberculosis. Clin Infect Dis. 2005;40(10):1481–91.
29 Mehta JB, Shantaveerapa H, Byrd RP, Jr., Morton SE, Fountain F, Roy TM. Utility of rifampin blood levels in the treatment and follow-up of active pulmonary tuberculosis in patients who were slow to respond to routine directly observed therapy. Chest. 2001;120(5):1520–4.
30 Steingart KR, Jotblad S, Robsky K, Deck D, Hopewell PC, Huang D, et al. Higher-dose rifampin for the treatment of pulmonary tuberculosis: a systematic review. Int J Tuberc Lung Dis. 2011;15(3):305–16.
31 Gallicano K, Khaliq Y, Carignan G, Tseng A, Walmsley S, Cameron DW. A pharmacokinetic study of intermittent rifabutin dosing with a combination of ritonavir and saquinavir in patients infected with human immunodeficiency virus. Clin Pharmacol Ther. 2001;70(2):149–58.
32 Goutelle S, Bourguignon L, Maire PH, Van Guilder M, Conte JE, Jr., Jelliffe RW. Population modeling and Monte Carlo simulation study of the pharmacokinetics and antituberculosis pharmacodynamics of rifampin in lungs. Antimicrob Agents Chemother. 2009;53(7):2974–81.
33 van Ingen J, Aarnoutse RE, Donald PR, Diacon AH, Dawson R, Plemper van Balen G, et al. Why Do We Use 600 mg of Rifampicin in Tuberculosis Treatment? . Clin Infect Dis. 2011;52(9):e194–9.
34 Peloquin CA, Jaresko GS, Yong CL, Keung AC, Bulpitt AE, Jelliffe RW. Population pharmacokinetic modeling of isoniazid, rifampin, and pyrazinamide. Antimicrob Agents Chemother. 1997;41(12):2670–9.
35 McIlleron H, Wash P, Burger A, Norman J, Folb PI, Smith P. Determinants of rifampin, isoniazid, pyrazinamide, and ethambutol pharmacokinetics in a cohort of tuberculosis patients. Antimicrob Agents Chemother. 2006;50(4):1170–7.
36 Kinzig-Schippers M, Tomalik-Scharte D, Jetter A, Scheidel B, Jakob V, Rodamer M, et al. Should we use N-acetyltransferase type 2 genotyping to personalize isoniazid doses? Antimicrob Agents Chemother. 2005;49(5):1733–8.
Authors’ contribution: MM and NC contributed equally.
Disclosure statement: No conflicts of interests were declared by any authors. Jan Fehr is a member of the advisory board of Merck Sharp & Dome and Janssen and received unrestricted and travel grants from Gilead, Merck Sharp & Dome, Janssen, Bristol-Myers Squibb, Roche, ViiV, Abbvie, and Boehringer Ingelheim. Natascia Corti is a member of the advisory board of Novartis and received travel and accommodation grants from Novartis. Rainer Weber received travel grants from Abbott, Boehringer Ingelheim, Bristol-Myers Squibb, Gilead Sciences, GlaxoSmithKline, Merck Sharp & Dome, Pfizer, Roche, TRB Chemedica and Tibotec. Monica Meloni none. Daniel Müller none. Ursula Gutteck none. Amrei von Braun received travel grants from Janssen. Lars Henning received travel grants from Bristol-Myers Squibb.