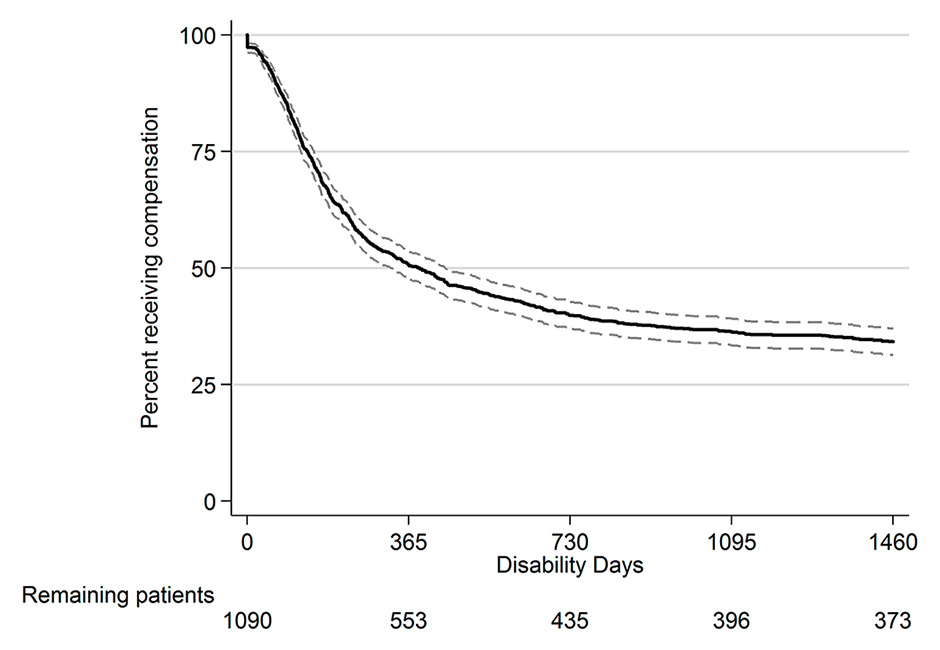
Figure 1
Kaplan-Meier survival function with 95% confidence interval.
DOI: https://doi.org/10.4414/smw.2015.14235
The cost of accidents, together with sickness and disability benefits, accounts for an important part of the increase in health-related costs in industrialised countries [1]. Since orthopaedic trauma sometimes leads to long-lasting sick leave as well as a decrease in quality of life owing to persistent pain and disabilities [2], the largest part of the rehabilitation costs is due to a minority of patients with long-term work absence [3]. Understanding the factors associated with certification of fitness for work after orthopaedic trauma should help in identifying patients bearing high risk of long-term work absence.
Work absence after orthopaedic trauma has a multifactorial origin, modulated not only by biomedical factors, but also by demographic, economic, psychological or work-related factors [4–6]. Psychological variables, such as subjective perception of pain or self-assessment of physical status, have been found to predict disease chronicity, which in turn is associated with return to work (RTW), after both orthopaedic trauma and back pain [7, 8]. Much of the research on the role of psychological factors on RTW was performed on back pain patients [9] while less work has been done on patients with orthopaedic trauma [4, 6].
Recently, we investigated the role of subjective perception variables on RTW following hospitalisation for rehabilitation after orthopaedic trauma [10]. An increased likelihood to be at work two years after rehabilitation was found in patients who reported better perceived general health at the beginning of the rehabilitation programme, an improvement of general health during the rehabilitation programme, a less intense pain score at the beginning of the programme and a decrease in pain during the programme. RTW was also associated with impact of event variables.
RTW is an important outcome of rehabilitation after orthopaedic trauma. In our previous studies, RTW was assessed by means of questionnaires sent to the patients a few months or years after the rehabilitation stay. However, the work status at a given time-point does not necessarily reflect the person’s fitness for work. The work can be part-time or intermittent, with work status possibly changing over time [11]. It also depends on the labour market, e.g., people may be fit for work but do not find any employment. Some also need a job adapted to their new physical status, different from what they were doing before the injury. For all these reasons, the assessment of RTW, based on questionnaires, does not necessarily measure what we are interested in, i.e., the person’s objective fitness for work. Questionnaires would mainly reflect the worker’s perspective, which is not necessarily related to the care and health insurance providers’ appraisal [12].
In the present study, we used the time spent on paid wage compensation after inpatient rehabilitation as the disability outcome. The advantage of this strategy is to measure the exact time up to fitness for work (TFW) based on objective health criteria. Main criteria used to evaluate fitness for work are the determination of worker’s capacity and risk in relation to his or her workplace, as well as ethical, economic and legal criteria [13]. This time, determined by doctors and/or insurers, is when the person is “medically” declared fit for work, whatever the economic context. Moreover, instead of simply having a snapshot at a given time-point, we get the exact number of days of work disability from the insurance perspective; this does not mean that the person has returned to work. It is possible that compensation might be paid for partial work disability, in parallel with other annuities (e.g., unemployment benefit) or part-time work. It is clear that, while either questionnaires or TFW may be used to assess RTW, neither method is superior over the other [12]. These two approaches agree on some aspects but give complementary information on others.
The objective of the present study was to test, by means of survival analyses, a number of psychological variables measured at hospitalisation as potential early prognostic factors of TFW during the 4 years following inpatient rehabilitation after orthopaedic trauma. A strength of this investigation is the unusually long follow-up. Out of 39 recently reviewed studies of early prognostic factors of sick leave after low back pain [9] or orthopaedic trauma [4], only one had a longer follow-up (84 months) than our present investigation. All other studies had 2 years or less of follow-up.
Health and accident insurances are compulsory in Switzerland. Whereas the health insurance is financed by personal contributions, every worker is insured against both occupational and non-occupational accidents and their consequences by his/her employer, financed by advance deductions from salaries. All construction and manual workers (i.e., blue collar workers) are insured by the Swiss National Accident Insurance Fund (Suva), which is the main accident insurer in the country. The accident and occupational disease insurance are in charge of daily benefits until possibility of return to work or until the start of a disability pension. Disability insurance has set up specific structures to analyse the state of health and residual occupational capacity of the impaired workers. State of health is determined by a general practitioner and, in the event of doubt, by an acknowledged expert. Vocational evaluation and rehabilitation are mainly carried out by specialised clinics [14].
The accident insurer must pay for medical treatment as long as a significant improvement in the state of health can be anticipated, without limit in terms of time or cost. The insured persons have a legal right to integration measures, but they are obliged to cooperate and do everything possible to return to occupational activity, avoiding the need for payment of a pension. If this is impossible, the disability insurance will help the worker in finding work, or look into the possibility of reclassification and permit the insured person to obtain new occupational qualifications. With the intercession of the insurance institutions at an early stage in the form of vocational rehabilitation measures, the chances of work resumption and long-term reintegration are considerably increased, but if these measures fail, the disability insurance will have to pay out disability pensions. Thus, reintegration measures are in the interests of the accident victim but also in the financial interests of the insurance company itself [15].
The present study has been performed on a subsample of patients participating in the OUTCOME study, described elsewhere [10, 16]. The OUTCOME study recruited patients hospitalised for rehabilitation after orthopaedic trauma over 2 years in two Swiss rehabilitation clinics. The main-study aim was an assessment of rehabilitation outcomes including return to work in relation to patient variables measured during the rehabilitation stay.
We performed the present investigation on those OUTCOME study participants who were recruited in 2004 and 2005 and suffered orthopaedic trauma of the neck, back, and upper or lower limbs. A total of 1 090 eligible patients entered the study. Recruitment clinics were the Clinique Romande de Réadaptation (CRR) in Sion, in the French-speaking part of Switzerland, and the Rehaklinik Bellikon (RKB) in Bellikon, in the German-speaking part of Switzerland. These are the only two clinics run by the Suva. Patients with severe traumatic brain injury (Glasgow coma scale ≤8), spinal cord injury, amputation, multiple trauma, para/tetraplegia, insufficient judgement capacity, under legal custody, or older than 62 years were excluded from the study. Patients were sent to the rehabilitation clinics if they suffered from persistent pain or functional limitations after work, leisure or traffic accidents and were unable to resume the same job after usual care (study sample: median 9.5 months post-accident; interquartile range 12.9 months).
Study participants signed an informed consent form before enrolment. The protocol was approved by the ethics committees of the local medical associations.
Time on paid wage compensation before fitness for work evaluation was our outcome variable (TFW, time to fitness for work). It is the number of days for which compensation was paid by the Suva for work disability during the 4 years after discharge from the rehabilitation clinic. The workers’ capacity to work without risk to their own and others’ health and safety [17] is assessed by the treating physicians and/or the insurer’s medical officer. Compensation payments in the form of daily allowances and permanent disability pensions were taken into account. Daily allowances are paid until the employee has either returned to work (or is considered fit for work), or is declared permanently disabled. Once the patient is deemed permanently disabled, the compensation payments switch to permanent disability pensions, which are defined in an analogous way. Times with partial work incapacities are counted pro rata (i.e., 10 days at 50% work capacity are counted as 5 days). Part-time employees obtain less compensation, but the number of days with compensation is defined in the same way.
Predictors and confounding variables were assessed within 3 days of admission to the clinics and 2 days before discharge. Self-evaluation questionnaires were used to assess psychological and subjective variables.
As potential predictors, we tested (1) perceived general health measured with EQ-5D [18] (visual analogue scale, VAS, scale range 0–100); (2) general health improvement during hospitalisation (VAS, discharge minus admission); (3) pain severity on the Brief Pain Inventory (BPI) [19] (VAS, range 0–100); (4) pain decrease during hospitalisation (VAS, admission minus discharge); (5) anxiety score on the Hospital Anxiety and Depression Scale (HADS [20]) (range 0–21); (6) depression score on HADS (range 0–21); (7) physical summary score of the Short Form of the Health Status measure, SF-36 [21] (range 0–100); (8) mental summary score on the SF-36 questionnaire (range 0–100); (9) avoidance score on the extended, 22-item, Impact of Event Scale (IES-R [22, 23]) (range 0–40); (10) intrusion score on the IES-R (range 0–40); (11) hyperarousal score on the IES-R (range 0–30); (12) perceived severity of injury (binary variable: very light to moderate vs severe to very severe); (13) perceived expected injury (binary: soon recovered or getting better vs no recovery or worsening); (14) patient feels distressed by pain (binary: >3 vs ≤3 points on 7-point Likert scale; 1 meaning no distress, 7 maximum distress); (15) fear that injury causes pain (binary: >3 vs ≤3 points on 7-point Likert scale; 1 no fear, 7 maximum fear); (16) fear that pain gets worse with physical activity (binary: >3 vs ≤3 points on 7-point Likert scale; 1 no fear, 7 maximum fear); (17) fear that physical activity causes body damage (binary: >3 vs ≤3 points on 7-point Likert scale; 1 no fear, 7 maximum fear). All factors were measured at entry. For global health and pain changes, the differences between admission and discharge were considered.
The analyses were adjusted for the following potential confounders: gender, age at admission (treated as a continuous variable), clinic, native language (local language of the clinic location, i.e., French or German vs other), marital status (living in stable partnership vs alone), educational level (≤ 9 years vs >9 years), possession of a work contract at admission (yes vs no), trauma localisation: upper limb, lower limb, neck, low back (three binary dummy variables, with lower limb as the reference category). These confounders were chosen to be coherent with the previous study performed on the same patient population [10]. Having the same adjusting variables allows a better comparison to be made, between RTW and TFW.
In one clinic (CRR), the abbreviated injury scale score (AIS) [24] was also available. This anatomically based score describes the severity of an injury on a scale ranging from 1 (minor injury) to 6 (fatal injury). Participants in this study, however, had a maximal AIS score of 4 (severe injury).
Cox proportional hazard regressions were used to estimate the associations between predictive variables and the outcome. Patients who were still on paid wage compensation 4 years after rehabilitation or who received a permanent disability pension were considered as censored for TFW.
The functional form of the predictors was checked using the martingale residuals obtained from fitting the null model (i.e., with no covariates). These residuals were plotted against each covariate and a smoothed curve was superimposed, which confirmed that linear terms are appropriate.
The assumption of proportional hazards was checked for each covariate by plotting the Schoenfeld residuals against TFW and fitting a smoothed curve. This hypothesis was found to be acceptable for all predictors [25].
To detect potential multicollinearity between the predictors and the confounders, we computed the variance inflation factor (VIF) for each independent variable. Since none of them was larger than 10 [26], we considered that no major problem of collinearity arose.
To build a statistical model for work disability, all predictors were first screened individually, adjusted by the confounding variables. All predictors with p ≤0.10 in the previous models were then entered together in a further model (full model), with adjustment for the confounders. A backward selection procedure followed, in which predictors were dropped one by one, each time dropping the predictor which resulted in the lowest Akaike information criterion (AIC). This procedure was stopped when the dropping of a further predictor would have increased the AIC. The previously dropped variables were then added one by one to ensure that they did not have an important impact on the AIC and their presence did not affect the effects of the remaining predictors.
Continuous predictors were z-score transformed by subtracting the mean and dividing by two standard deviations (SDs) [27] to produce effects related to comparable increments in variables with different scales. A z-score shows the deviation from the mean, expressed in SD units. Dividing by two SDs allows the coefficients of continuous variables to be interpreted in the same way as with binary variables.
To account for possible different practice between the two clinics, patients were considered as being clustered within clinic; a clustered sandwich estimator was used to estimate the variance-covariance matrix of each model. This procedure affects the SD of the regression coefficients, and thus the confidence intervals, but not the coefficients themselves.
We repeated the same model building procedure in the subsample of patients where AIS was available further adjusting for this score, in order to validate the predictive model.
Confidence intervals instead of p-values were used to make statistical inference from the final model [28, 29]. All calculations were performed with Stata, version 13.1 (StataCorp, College Station, TX, USA).
A total of 1 090 patients were enrolled in this study. Mean age was 42.9 years (SD 11.3). Eighty-two percent were men and 64% spoke the local language (French at CRR, German at RKB) as their native language. Injury locations were: 28.4% upper limb, 34.2% lower limb, 15.2% neck and 22.1% low back. Only 63.8% of the patients had a work contract at admission. However, it is possible that patients without any contract may have been working when the accident occurred, depending on the kind of contract, for example, short term or one that might have been revoked between the accident and the hospitalisation, one specific feature of the Swiss insurance system. The fact that the patients were insured by Suva means that a huge majority of them were working when the accident occurred. Summary statistics for all confounding variables are given in table 1 and those for the predictor variables in table 2.
Figure 1
Kaplan-Meier survival function with 95% confidence interval.
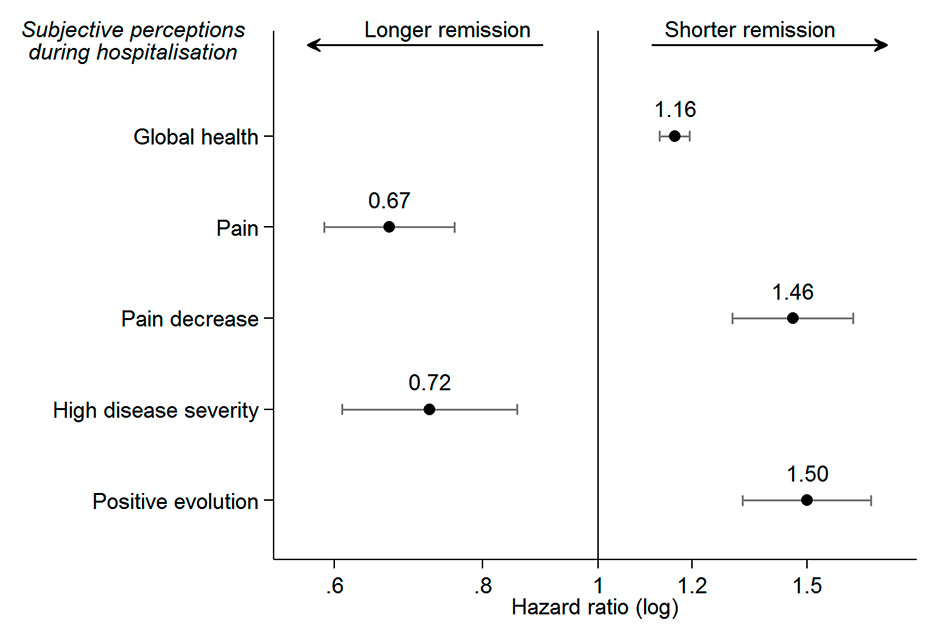
Figure 2
Hazard ratios (HRs) for the final model (n = 807). For health, pain and pain evolution, the HR refers to increments of two standard deviations. An HR above 1 shows an increased probability to be considered fit for work.
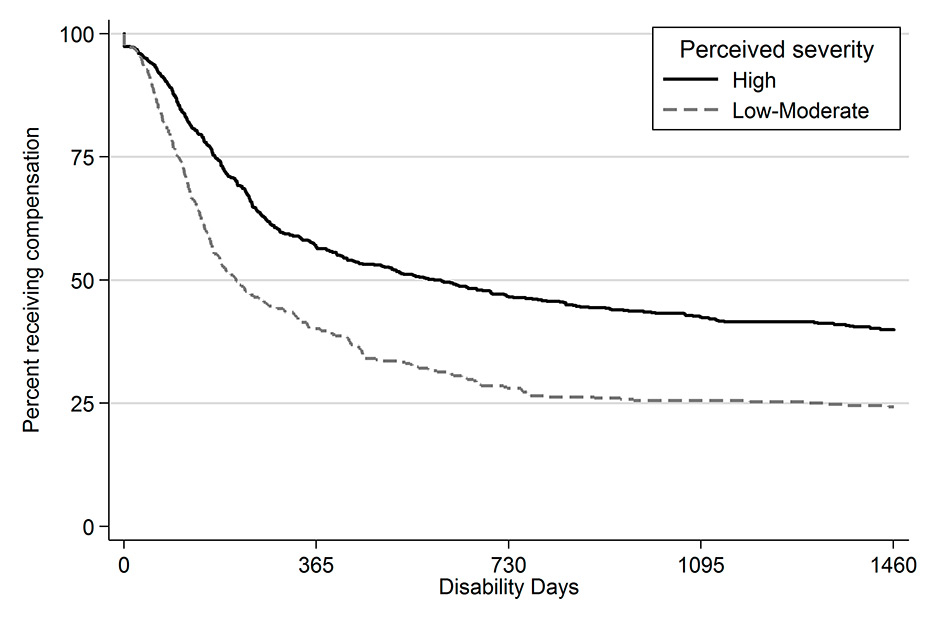
Figure 3
Survival functions according to the perceived severity of the trauma.
Median time on wage compensation over 4 years for the 1 090 enrolled patients was 389.0 days (Kaplan-Meier estimation; 95% CI 327.5–447). Figure 1 shows the Kaplan-Meier survival function for TFW. We saw a sharp decrease during the first year, with about half of the patients being declared fit for work, and then a flattening of the curve to an extended plateau, mainly after 2 years of compensation. This means that people who were still unable to work 2 years after their rehabilitation stay are very likely to remain disabled, obtaining a permanent disability pension.
Several patients had some missing values for the predictor or confounding variables (tables 1 and 2). Thus, the TFW final model was built on data from 807 patients (Kaplan-Meier estimation of median TFW 389.5 days, 95% CI 322.5–455.5).
After screening the predictors one by one with adjustment for the confounders, all predictors except two were used to build the full model. The two excluded predictors were perceived health change during hospitalisation and the mental summary score of the SF-36 questionnaire (table 3). The model reduction procedure led to the final model containing five predictor variables.
Independently from the values of the confounding variables, our results are compatible with the existence of an effect of perceived general health, pain, pain evolution during hospitalisation, perceived severity of the injury and expected disease evolution (fig. 2 and table 3). According to our final model the probability of being declared fit for work is higher in patients with better perceived general health at hospitalisation (HR 1.16, 95% CI 1.13–1.19, for each two-SD increase in the health scale), for those whose pain decreased during hospitalisation (HR 1.46, 95% CI 1.30–1.64, for each two-SD decrease) and for those expecting a positive evolution (HR 1.50, 95% CI 1.32–1.70 compared with the negative evolution group). Stronger pain at hospitalisation (HR 0.67, 95% CI 0.59–0.76 for each two-SD increase) as well as a high perceived disease severity (HR 0.72, 95% CI 0.61–0.85 compared with the low severity group) resulted in a lower probability of being fit for work.
To illustrate the effect of one of these covariates on TFW we present in figure 3 survival functions according to the perceived severity. It clearly appears that patients who perceived a high severity exhibit a much longer TFW than those whose trauma severity is perceived as moderate or low.
We repeated the same model selection procedure with the subsample for whom AIS score was available. We first screened all potential predictors one by one, adjusting for the confounders and for AIS (see appendix, supplementary table S1). All variables with p ≤0.10 were included in the full model and the backward selection procedure led to a final model that contains four independent predictors: pain at admission, pain evolution during hospitalisation, perceived severity and expected disease evolution (supplementary table S1 and supplementary fig. S1). These predictors were the same as those obtained with the full data. Because of the smaller sample size (n = 364), the confidence intervals were wider, but all predictors remained significantly associated with TFW except global health. Moreover, hazard ratios were very close to those obtained with the full data.
As already mentioned, global health was the only predictor to be removed when compared with the model with full data; there were in this sample, however, only patients from one rehabilitation clinic whereas previously we used a clustered sandwich estimator to take into account the possibility that the two clinics were not independent. Using a standard maximum likelihood approach, global health was no longer significantly associated with TFW (HR 1.16, 95% CI 0.95–1.42) and we would thus have obtained exactly the same predictors.
| Table 1:Summary statistics for the confounding variables (n = 1 090). | |||
| Variable | Category | Frequency | % |
| Clinic | RKB | 542 | 49.7 |
| CRR | 548 | 50.3 | |
| Gender | Men | 890 | 81.7 |
| Women | 200 | 18.3 | |
| Native language | Local | 697 | 63.9 |
| Other | 393 | 36.1 | |
| Marital status | Single | 417 | 38.3 |
| Married/couple | 592 | 54.3 | |
| Missing values | 81 | 7.4 | |
| Education | ≤9 years | 513 | 47.1 |
| >9 years | 502 | 46.1 | |
| Missing values | 75 | 6.9 | |
| Work contract at admission | Yes | 695 | 63.8 |
| No or not known | 325 | 29.8 | |
| Missing values | 70 | 6.4 | |
| Main traumatic localisation | Upper limb | 310 | 28.4 |
| Lower limb | 373 | 34.2 | |
| Neck | 166 | 15.2 | |
| Low back | 241 | 22.1 | |
| Mean | SD | ||
| Age | NA | 42.9 | 11.3 |
| CRR = Clinique Romande de Réadaptation ; NA = not applicable ; RKB = Rehaklinik Bellikon ; SD = standard deviation | |||
| Table 2: Summary statistics for the predictive variables. | ||||
| Variable | n* | Mean | SD | |
| General health at admission | 1 080 | 48.1 | 21.8 | |
| General health change during stay | 930 | 5.6 | 25.1 | |
| Pain at admission | 1 059 | 56.2 | 24.6 | |
| Pain decrease during stay | 892 | 5.7 | 23.2 | |
| HADS anxiety | 1 075 | 9.2 | 4.5 | |
| HADS depression | 1 076 | 7.4 | 4.5 | |
| SF-36 physical summary score | 1 033 | 33.5 | 6.9 | |
| SF-36 mental summary score | 1 033 | 37.5 | 8.9 | |
| IES-R avoidance | 1 060 | 12.0 | 10.4 | |
| IES-R intrusion | 1 059 | 13.1 | 11.3 | |
| IES-R hyperarousal | 1 053 | 11.1 | 8.6 | |
| Variable | Category | n* | Frequency | % |
| Perceived severity of injury | Very light to moderate | 1 090 | 396 | 36.3 |
| Severe to very severe | 694 | 63.7 | ||
| Expected outcome | Soon recovered or getting better | 1 090 | 749 | 68.7 |
| Deterioration or no improvement | 341 | 31.3 | ||
| Distressed by pain | Little or no distress | 1 062 | 603 | 56.8 |
| Strong distress | 459 | 43.2 | ||
| Fear that injury causes pain | Light fear or no fear | 1 061 | 674 | 63.5 |
| Strong fear | 387 | 36.5 | ||
| Fear that pain get worse with physical activity | Light fear or no fear | 1 065 | 571 | 53.6 |
| Strong fear | 494 | 46.4 | ||
| Fear that physical activity causes body damage | Light fear or no fear | 1 059 | 737 | 69.6 |
| Strong fear | 322 | 30.4 | ||
| HADS = Hospital Anxiety and Depression Scale; IES-R = extended Impact of Event Scale; SF-36 = Short Form of the Health Status measure; SD = standard deviation * Not all predictors could be assessed for all patients owing to missing values | ||||
| Table 3: Cox models for time to fitness for work. A backward selection procedure was followed to end up with the final model. | ||||||
| Variable | Predictors one by one, adjusted for confounders | Full model, predictors adjusted for confounders and for each other (n = 749**) | Final model, predictors adjusted for confounders and for each other (n = 807**) | |||
| Hazard ratio* | 95% CI | Hazard ratio* | 95% CI | Hazard ratio* | 95% CI | |
| Predictors | ||||||
| General health at admission | 1.49 | 1.38–1.59 | 1.23 | 0.96–1.58 | 1.16 | 1.13–1.19 |
| General health change during stay | 1.07 | 0.93–1.24 | ||||
| Pain at admission | 0.70 | 0.60–0.82 | 0.65 | 0.60–0.70 | 0.67 | 0.59–0.76 |
| Pain decrease during stay | 1.35 | 1.25–1.45 | 1.45 | 1.32–1.61 | 1.46 | 1.30–1.64 |
| HADS anxiety | 0.74 | 0.58–0.95 | 1.17 | 1.13–1.21 | ||
| HADS depression | 0.66 | 0.52–0.83 | 0.79 | 0.60–1.04 | ||
| SF-36 physical summary score | 1.38 | 1.32–1.44 | 0.96 | 0.89–1.05 | ||
| SF-36 mental summary score | 1.22 | 0.90–1.64 | ||||
| IES-R avoidance | 0.81 | 0.74–0.89 | 1.09 | 1.00–1.19 | ||
| IES-R intrusion | 0.75 | 0.65–0.86 | 0.83 | 0.57–1.22 | ||
| IES-R hyperarousal | 0.77 | 0.59–1.02 | 1.02 | 0.57–1.85 | ||
| High perceived severity of injury | 0.64 | 0.62–0.66 | 0.73 | 0.57–0.95 | 0.72 | 0.61–0.85 |
| Positive evolution expected | 1.58 | 1.56–1.60 | 1.51 | 1.19–1.91 | 1.50 | 1.32–1.70 |
| Strongly distressed by pain | 0.77 | 0.62–0.95 | 0.94 | 0.77–1.15 | ||
| Strong fear injury causes pain | 0.83 | 0.80–0.87 | 1.03 | 0.90–1.19 | ||
| Strong fear pain get worse with physical activity | 0.82 | 0.66–1.03 | 1.20 | 0.88–1.64 | ||
| Strong fear physical activity causes body damage | 0.76 | 0.69–0.84 | 0.95 | 0.86–1.04 | ||
| Confounders | ||||||
| RKB clinic | N/A | 0.79 | 0.76–0.83 | 0.76 | 0.75–0.76 | |
| Female gender | N/A | 1.35 | 1.25–1.46 | 1.29 | 1.14–1.47 | |
| Age | N/A | 0.98 | 0.96–0.99 | 0.98 | 0.97–0.99 | |
| Foreign native language | N/A | 0.92 | 0.73–1.15 | 0.87 | 0.73–1.04 | |
| Living alone | N/A | 1.16 | 1.12–1.20 | 1.16 | 1.07–1.26 | |
| High education | N/A | 1.27 | 1.11–1.46 | 1.26 | 1.09–1.46 | |
| Work contract | N/A | 1.08 | 0.87–1.33 | 1.07 | 0.88–1.30 | |
| Upper limb | N/A | 0.89 | 0.80–0.99 | 0.94 | 0.80–1.11 | |
| Neck | N/A | 1.76 | 1.59–1.94 | 1.84 | 1.41–2.39 | |
| Low back | N/A | 1.48 | 1.47–1.50 | 1.56 | 1.46–1.66 | |
| CI = confidence interval; HADS = Hospital Anxiety and Depression Scale; IES-R = extended Impact of Event Scale; N/A = not applicable; RKB = Rehaklinik Bellikon; SF-36 = Short Form of the Health Status measure * Coefficients for continuous predictors refer to increments of two standard deviations ** The difference between sample sizes is due to missing values. | ||||||
Conditional on the validity of our models, the present results provide some evidence that TFW during a 4-year period after rehabilitation may be predicted by prerehabilitation perceptions of general health, pain and injury severity, as well as pain change over the rehabilitation programme and the expected evolution of the trauma. Pain and perceived injury severity were also found to be predictive of the probability of returning to work 2 years after rehabilitation in a study that included the same patient population as the present work [10]. However, the outcome measured was different in the previous study, i.e., a binary variable (work or not) assessed 2 years after hospital discharge. In this case, no information was available on real work status during the period after discharge: a patient who is out of work at a given time may have been working during a certain time previously [11]. Furthermore, in the previous study the work status outcome was assessed through a questionnaire sent to the participants, which resulted in a loss of data as a result of nonresponse. Moreover, some answers might be subject to recall bias since they depend on the participants’ memory and willingness. In the present study, the outcome was the number of days for which compensation for work disability was paid over a period of 4 years. This variable was assessed from administrative data of the insurer and there was virtually no loss to follow-up.
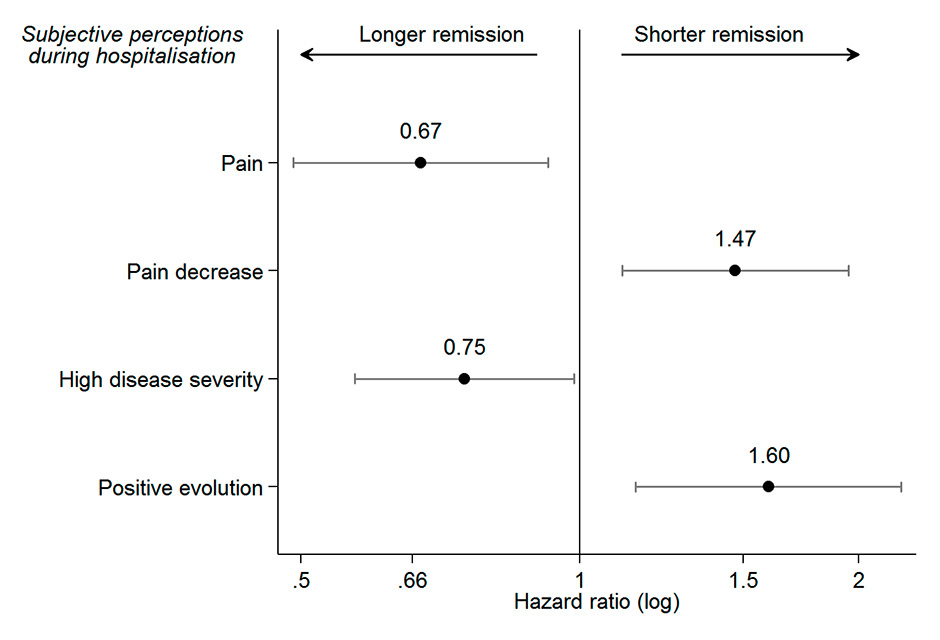
Supplementary Figure S1
Hazard ratios for the final model adjusted for Abbreviated Injury Scale score (n = 364). For pain and pain evolution, the hazard ratio refers to increments of two standard deviations. A hazard ratio above 1 shows an increased probability to be considered fit for work.
Furthermore, these data allow us to understand better the kinetics of TFW. The slope of the survival curve decreases progressively, eventually reaching a final plateau 2 years after rehabilitation (see fig. 1). This means that about one third of the patients are likely to experience long or even permanent disability. Interestingly, patients who perceived a lower severity of their injuries were more rapidly fit for work (half of them did not get compensation after 194 days, see fig. 3) than those with a high perceived severity (half of them were getting compensation for at least 602 days).
The investigation of psychological variables as predictors of work disability has been rather neglected in orthopaedic trauma, according to the systematic review by Clay and colleagues [4]. Among the 15 publications retained in this review, only six had evaluated psychological factors, but none of them examined the factors we assessed in the present study. Sociodemographic factors, and those related to injury as well as treatment or worker occupation, have attracted more attention. However, a previous literature review could not give any clear conclusions on the putative prediction of RTW by the patients’ perceptions/expectations [6].
The role of pain and psychological variables on work disability has also been investigated in conditions other than orthopaedic trauma. In accordance with the present study, changes in pain and recovery expectations were found to predict the duration of wage compensation benefits in an investigation of workers with soft tissue injuries [30]. Patients with a decrease in pain during the first 4 weeks after baseline or with an optimistic recovery expectation remained on compensation benefits for less time [30]. Our results also agree with those presented in a systematic review of psychosocial predictors of RTW in nonchronic, nonspecific cases of low back pain [9]. In accordance with our results, recovery expectations, but not anxiety and depression, were identified by this review as a prognostic factor. However, they found evidence for pain-related fear avoidance beliefs or behaviours as predictors for RTW, while our model did not retain pain-related fear related variables. Pain itself was not included in their review, but it has been found to be associated with long-term sick leave in other studies on low back pain patients [31–33].
Once again, questionnaires on RTW and wage-replacement are two different methods with complementary perspectives. These results suggest some concordance between both methods. A study measuring RTW with questionnaires on the same worker population [10] found very similar results to ours: health, pain and severity were also associated with RTW; however some psychological factors not isolated in the present study were also identified. These results are compatible with the hypothesis that questionnaires can capture the worker’s experiences, but compensation data may better grasp the insurance perspective [12]. At the end of the 4-year follow-up, there should be a strong association between fitness for work and return to work since there are not many alternative sources of income, apart from wage compensation and work salary.
Our present study also shows that these subjective perceptions are associated with TFW independently from the severity of the trauma. Interestingly, the subjective severity of the trauma remains a significant predictor of the TFW after the introduction of the similar, but objectively determinedvariable (i.e., AIS). This latter result emphasises that, although perceived severity of the trauma may not represent the real situation, it may represent an interesting and important variable in order to predict the outcome. This result is remarkable since TFW should theoretically not be associated with subjective perceptions of severity, but only with objective severity. This means that severity is a crossing point between two perspectives, that of the patient and that of the evaluator who decides to end the compensation.
The present observed association between TFW and subjective perceptions of the patients confirms the need of evidence-based guidelines to assess fitness for work [13]. Nevertheless, the evaluation will always remain a compromise between the potentially divergent interests and perspectives of the worker and the employer. This raises several ethical aspects, and only clear criteria will guarantee equity to all patients. A recent study highlighted the limitations of purely rationalist approaches to judgements of fitness for work. Moral and sociocultural factors are invoked to contest decisions by patients and also by doctors, who are patient advocates and protectors of the insurance system at the same time [34]. These potential conflicts with patients, together with the difficult assessment of capacity to work, may be a source of problems for doctors. Good communication between healthcare providers, patients and employers is obviously needed to ensure satisfactory decisions [35].
The main strength of this work, compared with other published investigations, is the length of follow-up. The studies listed in the two systematic reviews cited above had median follow-up times of 6 months (95% CI 2.8–12.0; low back pain) and 12 months (95% CI 5.5–15.5; orthopaedic trauma) [4, 9]. In addition, the work disability duration was measured in a continuous way, much more precisely than other outcomes usually measured, such as time to RTW or being (or not) at work at a given time-point. Particularly, time to RTW, which depends on the patient’s interpretation, has been shown to underestimate work disability duration [36]. On the other hand, wage compensation benefits depend on the duration of sick leave that in turn can partly depend on work demands on the patients [37].
A limitation of this study is due to selection bias. In a previous work we found that marital status, educational level, native language and biopsychosocial complexity predicted the probability of responding to the entry questionnaire of the OUTCOME study and, therefore, participation in the study [16]. The TFW, obtained from insurance data after discharge, may avoid the larger nonresponse rate bias that occurs when the RTW questionnaires are sent by regular mail, even if we saw that questionnaires and TFW do not assess exactly the same perspective. Our clinics treat an important proportion of blue collar workers, with a relatively low educational level, belonging to immigrant populations, whose local language skills are often weak. Thus, the proportion of this kind of sociologically vulnerable patients is underrepresented in our study. We have tried to reduce selection bias by adjusting our analyses for the relevant variables except for biopsychosocial complexity which was available only for one clinic.
This study would be further improved with a more detailed follow-up of the patients after the rehabilitation stay, to know, for example, more about the treatment (e.g., physiotherapy) received between the end of the hospitalisation and the fitness for work assessment. Other potentially important information that was not measured includes the patients’ motivation in returning to work, or those who are reclassified in a new occupational function.
Nevertheless, different approaches led to comparable rates of RTW 2 years after rehabilitation, one study based on questionnaires [10] and another using a predictive model [2], thus our conclusions should be generalisable to wider populations.
The TFW is an interesting outcome that presents at least three advantages compared to RTW assessed by questionnaire: a) it suffers less from selection bias, b) it is measured continuously and precisely and c) it depends less on the economic conjuncture. Although fitness for work assessment should be based on objective criteria, this study showed that TFW is predicted by perceived variables like global health, pain, pain decrease during hospitalisation and injury severity as well as an expected positive evolution. These results underline the importance of the early assessment of these perceptions and taking them into account during the rehabilitation process.
| Supplementary table S1: Cox models for time to fitness for work in the subpopulation where Abbreviated Injury Scale scores were available. A backward selection procedure was followed to end up with the final model. | ||||||||
| Variable | Predictors one by one, adjusted for confounders without AIS | Predictors one by one, adjusted for confounders and AIS | Full model, predictors adjusted for confounders, AIS and for each other (n = 319**) | Final model, predictors adjusted for confounders, AIS and for each other (n = 364**) | ||||
| Hazard ratio* | 95% CI | Hazard ratio* | 95% CI | Hazard ratio* | 95% CI | Hazard ratio* | 95% CI | |
| Predictors | ||||||||
| General health at admission | 1.43 | 1.13–1.82 | 1.44 | 1.13–1.84 | 1.36 | 0.96–1.93 | ||
| General health change during stay | 1.14 | 0.90–1.46 | 1.15 | 0.90–1.46 | ||||
| Pain at admission | 0.78 | 0.61–1.01 | 0.77 | 0.59–0.99 | 0.67 | 0.46–0.97 | 0.67 | 0.49-0.92 |
| Pain decrease during stay | 1.30 | 1.01–1.67 | 1.35 | 1.04–1.75 | 1.43 | 1.05–1.92 | 1.47 | 1.11-1.95 |
| HADS anxiety | 0.86 | 0.67–1.11 | 0.85 | 0.66–1.10 | ||||
| HADS depression | 0.77 | 0.59–0.99 | 0.78 | 0.60–1.00 | 1.15 | 0.80–1.63 | ||
| SF-36 physical summary score | 1.43 | 1.09–1.88 | 1.41 | 1.07–1.87 | 0.94 | 0.64–1.39 | ||
| SF-36 mental summary score | 1.00 | 0.76–1.32 | 1.00 | 0.76–1.31 | ||||
| IES-R avoidance | 0.85 | 0.66–1.09 | 0.88 | 0.68–1.13 | ||||
| IES-R intrusion | 0.81 | 0.63–1.05 | 0.84 | 0.66–1.08 | ||||
| IES-R hyper-arousal | 0.90 | 0.70–1.16 | 0.93 | 0.72–1.19 | ||||
| High perceived severity of injury | 0.64 | 0.51–0.80 | 0.69 | 0.55–0.88 | 0.78 | 0.57–1.06 | 0.75 | 0.57–0.96 |
| Positive evolution expected | 1.58 | 1.21–2.06 | 1.49 | 1.14–1.95 | 1.62 | 1.13–2.32 | 1.60 | 1.15–2.22 |
| Strongly distressed by pain | 0.86 | 0.68–1.09 | 0.87 | 0.69–1.09 | ||||
| Strong fear injury causes pain | 0.82 | 0.65–1.03 | 0.82 | 0.65–1.04 | 1.00 | 0.73–1.38 | ||
| Strong fear pain get worse with physical activity | 0.92 | 0.73–1.17 | 0.90 | 0.71–1.14 | ||||
| Strong fear physical activity causes body damage | 0.79 | 0.61–1.02 | 0.81 | 0.63–1.05 | ||||
| Confounders | ||||||||
| AIS | N/A | N/A | 0.73 | 0.60–0.89 | 0.71 | 0.59–0.86 | ||
| Female gender | N/A | N/A | 1.32 | 0.91–1.93 | 1.34 | 0.95–1.89 | ||
| Age | N/A | N/A | 0.98 | 0.97–0.99 | 0.98 | 0.97–0.99 | ||
| Foreign native language | N/A | N/A | 0.80 | 0.58–1.11 | 0.81 | 0.60–1.08 | ||
| Living alone | N/A | N/A | 1.16 | 0.86–1.56 | 1.12 | 0.85–1.48 | ||
| High education | N/A | N/A | 1.31 | 0.96–1.79 | 1.34 | 1.01–1.78 | ||
| Work contract | N/A | N/A | 0.94 | 0.70–1.26 | 0.95 | 0.73–1.24 | ||
| Upper limb | N/A | N/A | 0.92 | 0.64–1.30 | 0.91 | 0.67–1.24 | ||
| Neck | N/A | N/A | 2.42 | 1.21–4.83 | 2.43 | 1.31–4.51 | ||
| Low back | N/A | N/A | 1.38 | 0.96–1.99 | 1.40 | 1.01–1.94 | ||
| AIS: Abbreviated Injury Scale; CI = confidence interval; HADS = Hospital Anxiety and Depression Scale; IES-R = extended Impact of Event Scale; N/A = not applicable; SF-36 = Short Form of the Health Status measure * Coefficients for continuous predictors refer to increments of two standard deviations ** The difference between sample sizes is due to missing values. | ||||||||
Acknowledgements:Both clinics belong to Suva, the Swiss national accident insurance. We are grateful to Viviane Dufour and Dr. Pierluigi Ballabeni for supporting data acquisition and formatting. We also thank Dr. Chantal Plomb-Holmes for the careful reading of the manuscript.
This work was supported by Suva (grant number 100 333).
1 Gobelet C, Franchignoni F. Vocational rehabilitation. In: Vocational rehabilitation. edn. Edited by Gobelet C, Franchignoni F. Paris: Springer. 2006:3–16.
2 Luthi F, Deriaz O, Vuistiner P, Burrus C, Hilfiker R. Predicting non return to work after orthopaedic trauma: the Wallis Occupational Rehabilitation RisK (WORRK) model. PloS one. 2014;9(4):e94268.
3 Hazard RG, Haugh LD, Reid S, Preble JB, MacDonald L. Early prediction of chronic disability after occupational low back injury. Spine. 1996;21:945–51.
4 Clay FJ, Newstead SV, McClure RJ. A systematic review of early prognostic factors for return to work following acute orthopaedic trauma. Injury. 2010;41:787–803.
5 Selander J, Marnetoft SU, Bergroth A, Ekholm J. Return to work following vocational rehabilitation for neck, back and shoulder problems: risk factors reviewed. Disability and rehabilitation. 2002;24:704–12.
6 Fadyl J, McPherson K. Return to work after injury: a review of evidence regarding expecations and injury perceptions, and their inlfuence on outcome. J Occup Rehabil. 2008;18:362–74.
7 Cheng JC, Li-Tsang CW. A comparison of self-peceived physical and psycho-social worker profiles of people with direct work injury, chronic low back pain, and cumulative trauma. Work. 2005;25:315–23.
8 Crombez G, Vlaeyen JW, Heuts PH, Lysens R. Behavioural rehabilitation of chronic low back pain: comparison of an operant treatment, an operant cognitive treatment and an operant-respondent treatment. Br J Clin Psychol. 1995;34(Pt 1):95–118.
9 Iles RA, Davidson M, Taylor NF. Psychological predictors of failure to return to work in non-chronic non-specific low back pain: a systematic review. Occup Environ Med. 2008;65:507–17.
10 Iakova M, Ballabeni P, Erhart P, Seichert N, Luthi F, Deriaz O. Self perceptions as predictors for return to work 2 years after rehabilitation in orthopedic trauma inpatients. J Occup Rehabil. 2012;22(4):532–40.
11 Ballabeni P, Burrus C, Luthi F, Gobelet C, Dériaz O. The effect of recalled previous work environment on return to work after a rehabilitation program including vocational aspects for trauna patients. J Occup Rehabil. 2011;21:43–53.
12 Young AE, Wasiak R, Gross DP. Recurrence of work-related low back pain and disability: association between self-report and workers' compensation data. Spine. 2013;38(26):2279–86.
13 Serra C, Rodriguez MC, Delclos GL, Plana M, López LIG, Benavides FG. Criteria and methods used for the assessment of fitness for work: a systematic review. Occupational and environmental medicine. 2007;64(5):304–12.
14 Fournier-Buchs M-F, Gobelet C. Vocational rehabilitation: the Swiss model. In: Vocational rehabilitation. edn. Edited by Gobelet C, Franchignoni F. Paris: Springer. 2006;395–403.
15 Morger W. The point of view of the insurance company. In: Vocational rehabilitation. edn. Edited by Gobelet C, Franchignoni F. Paris: Springer. 2006;17–30.
16 Burrus C, Ballabeni P, Dériaz O, Gobelet C, Luthi F. Predictors of nonresponse in a questionnaire-based outcome study of vocational rehabilitation patients. Arch Phys Med Rehabil. 2009;90:1499–505.
17 Palmer KT, Cox RA, Brown I. Fitness for work: the medical aspects: Oxford university press. 2007.
18 Group TE. EuroQol-a new facility for the measurement of health-related quality of life. Health policy. 1990;16(3):199–208.
19 Cleeland C, Ryan K. Pain assessment: global use of the Brief Pain Inventory. Annals of the Academy of Medicine, Singapore. 1994;23(2):129–38.
20 Zigmond AS, Snaith RP. The hospital anxiety and depression scale. Acta Psychiatr Scand. 1983;67:361–70.
21 Ware JE, Snow KK, Kosinski M, Gandek B. SF-36 health survey: manual and interpretation. Lincoln, RI: QualityMetric Incorporated. 2000.
22 Horowitz M, Wilner N, Alvarez W. Impact of Event Scale: a measure of subjective stress. Psychosom Med. 1979;41(209–18).
23 Weiss D, Marmar C. The Impact of Event Scale-revised In: Assessing psychological trauma and PTSD: a hanbook for practitioners. edn. Edited by Keane JPTWM. New York, NY: Guilford Press. 1997;399–411.
24 Committee on Injury Scaling. The Abbreviated Injury Scale (AIS-98). In. Des Plaines, IL, USA: Association for the Advancement of Automotive Medicine. 1998.
25 Collett D. Modelling Survival Data in Medical Research, 2nd edition. 2003.
26 Kutner MH, Nachtsheim C, Neter J. Applied linear regression models: McGraw-Hill/Irwin. 2004.
27 Gelman A. Scaling regression inputs by dividing by two standard deviations. Statistics in medicine. 2008;27(15):2865–73.
28 Poole C. Low p-values or narrow confidence intervals: which are more durable? Epidemiology. 2001;12:291–4.
29 Sterne JAC, Davey Smith G. Sifting the evidence – what's wrong with significance tests? BMJ. 2001;322:226–31.
30 Hogg-Johnson S, Cole DC. Early prognostic factors for duration on temporary total benefits in the first year among workers with compensated occupational soft tissue injuries. Occup Environ Med. 2003;60:244–53.
31 Crook J, Moldofsky H. The clinical course of musculoskeletal pain in empirically derived groupings of injured workers. Pain. 1996;67:427–33.
32 Crook J, Milner R, Schultz IZ, Stringer B. Determinants of occupational disability following a low back injury: a critical review of the literature. J Occup Rehabil. 2002;12:277–95.
33 Schultz IZ, Crook J, Meloche GR. Psychological factors predictive of occupational low back disability: towards development of a return-to-work model. Pain. 2004;107:77–85.
34 Wainwright E, Wainwright D, Keogh E, Eccleston C. The social negotiation of fitness for work: Tensions in doctor–patient relationships over medical certification of chronic pain. Health. 2015;19(1):17–33.
35 Foley M, Thorley K, Von Hout M-C. Sickness certification difficulties in Ireland-a GP focus group study. Occupational medicine. 2013;63(5):369–72.
36 Krause N, Dasinger LK, Deegan LJ, Brand RJ, Rudolph L. Alternative approaches for measuring duration of work disability after low back injury based on administrative workers’ compensation data. Am J Ind Med. 1999;35:604–18.
37 Reiso H, Nygard JF, Grage S, Gulbrandsen P: Work ability assessed by patients and ther GPs in new episodes of sickness certification. Family Practice. 2000;17:139–44.
Disclosure statement: No financial support and no other potential conflict of interest relevant to this article was reported.