Data mining The Cancer Genome Atlas in the era of precision cancer medicine
DOI: https://doi.org/10.4414/smw.2015.14183
Phil F.
Cheng, Reinhard
Dummer, Mitchell P
Levesque
Summary
The Cancer Genome Atlas (TCGA) has given researchers and clinicians unprecedented access to many different cancers through multiple platforms that include exome sequencing, comparative genomic hybridisation (CGH) arrays, DNA methylation arrays, RNA sequencing, reverse protein phase arrays (RPPA), and clinical features. Most data are available to the public in their raw and processed forms; however, analysis and interpretation of these data require specialised training and software. To address this problem, online tools such as cBioportal, canEvolve, GDAC firehose, PROGgeneV2, and UCSC Cancer browser have been developed by various groups to explore and perform analyses on the datasets that are easily understandable by basic researchers and clinicians. In this mini-review, we give an overview of the datasets available from TCGA and the public tools available for integrative analysis of survival with the genomic and transcriptomic datasets, and introduce a tool being developed by our group to analyse the datasets within TCGA.
Introduction
The Cancer Genome Atlas (TCGA) [1] has generated genomic, transcriptomic, epigenomic and clinical data for several cancer types, which are publically available for every clinician and researcher to explore and analyse. To date, there are 10 000 cases of 33 tumour types available, with 20 cancer types having more than 200 cases (table 1). The data are centralised at the TCGA data portal and can be downloaded for academic use. Many groups have used TCGA data to characterise the genomic and molecular landscape of multiple cancer types, and have used the data to perform novel analysis. For instance, integrative analysis of exome sequencing, RNAseq and miRNAseq across 12 cancer types revealed 11 major subtypes and redefined three cancer types into one molecular subgroup [2]. Another group used the exome sequencing and RNAseq data for six cancer types and discovered that neoantigen expression could predict patient survival [3].
The data types listed on the TCGA data portal for each cancer are somatic mutation, copy number, gene expression, miRNA expression, DNA methylation, reverse protein phase array (RPPA) and clinical information. Each data type has the raw and processed data available for public download, except for the raw sequencing files from the exome sequencing, RNA sequencing (RNAseq), microRNA sequencing (miRNAseq) and copy number, which require authorisation from the Cancer Genomics Hub (CGHub). The analysis pipelines for each data type are available in a text file included with the data. By providing a standard method for raw data processing and annotation, it allows reproducibility in downstream analysis by other research groups.
|
Table 1: Cancer types with data available via The Cancer Genome Atlas. |
|
|
Cases |
| Acute myeloid leukaemia (LAML) |
200 |
| Bladder urothelial carcinoma (BLCA) |
412 |
| Brain lower grade glioma (LGG) |
516 |
| Breast invasive carcinoma (BRCA) |
1 098 |
| Cervical squamous cell carcinoma and endocervical adenocarcinoma (CESC) |
308 |
| Colon adenocarcinoma (COAD) |
461 |
| Glioblastoma multiforme (GBM) |
528 |
| Head and neck squamous cell carcinoma (HNSC) |
528 |
| Kidney renal clear cell carcinoma (KIRC) |
536 |
| Kidney renal papillary cell carcinoma (KIRP) |
291 |
| Liver hepatocellular carcinoma (LIHC) |
377 |
| Lung adenocarcinoma (LUAD) |
521 |
| Lung squamous cell carcinoma (LUSC) |
504 |
| Ovarian serous cystadenocarcinoma (OV) |
586 |
| Prostate adenocarcinoma (PRAD) |
498 |
| Sarcoma (SARC) |
261 |
| Skin cutaneous melanoma (SKCM) |
470 |
| Stomach adenocarcinoma (STAD) |
443 |
| Thyroid carcinoma (THCA) |
507 |
| Uterine corpus endometrial carcinoma (UCEC) |
548 |
Data types within TCGA
Here we briefly describe each data type, the method used to obtain the data and the information it provides.
Somatic mutations are determined by use of exome sequencing. Exome sequencing detects single nucleotide variants, which are categorised as nonsynonymous or synonymous. Nonsynonymous single nucleotide variants cause single amino-acid substitutions, which may lead to altered protein function or truncated proteins.
Copy number alterations are determined with the Affymetrix SNP6.0 array. This array detects gains and losses of the genome, typically at a resolution of 100‒200 kilobases.
Gene expression and microRNA expression are determined with RNAseq and miRNAseq, respectively. The abundance of transcripts, isoforms, novel transcripts, gene fusions, and noncoding RNAs can be extracted from the sequencing data.
DNA methylation is determined with the Infinium Human Methylation 450 Bead Array. This array provides single nucleotide resolution of CpGs across the vast majority of CpG islands and promoters of the genome.
Protein expression is determined with RPPA. RPPA is an array-based method of detecting proteins at nanogram levels. Validated antibodies are used to assess protein level as well as phosphor-protein levels. This allows for detection of activated proteins which could not be inferred from RNA expression.
Clinical data is listed for each patient with standard metrics such as age, gender, time to death or last known contact date. For each cancer there are specific stratification parameters, for instance Gleeson score for prostate cancer and Breslow index for melanoma. Overall survival as well as progression-free survival can be calculated and stratified according to cancer-specific staging.
Overall, each data type is very comprehensive in covering the genome, and current analysis techniques usually correlate each data type separately with the clinical survival data. In the future, integrative analysis in a multi-omics fashion would be ideal in order to understand the biology of the cancer and its effect on patient survival.
Public webtools for analysing TCGA data
With the large amount of data available, specialised web-based tools have been developed to aid clinicians and researchers to analyse and interpret all the data types in a meaningful way. Websites such as cBioportal [5], GDAC firehose (http://gdac.broadinstitute.org), canEvolve [6], PROGgeneV2 [7], and the UCSC cancer browser [8] all provide their own analysis and visualisation tools for TCGA datasets (table 2).
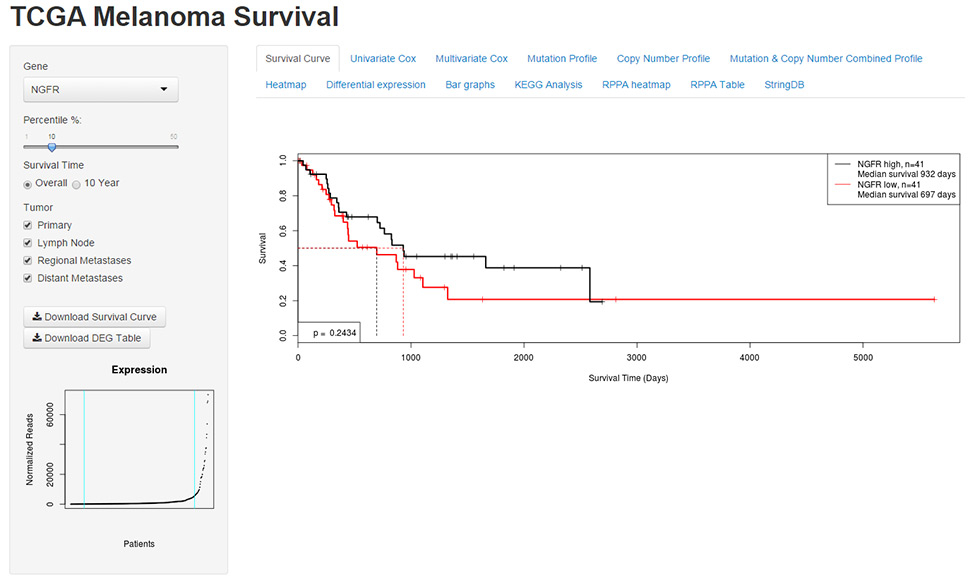
Figure 1
Snapshot of UZH Cancer Browser. Left panel shows selectable parameters for gene, patient percentile, survival time and tumor type. Normalised expression of NGFR accross all patients can be seen in the scatterplot in the bootom left corner. In the main panel of the webtool, tabs for the analysis modules can be selected for visualisation. In this snapshot the survival curve module is selected and the Kaplan-Meier plot is shown.
The cBioportal website hosts over 20 000 tumour samples from 89 cancer studies, which include all the TCGA data. The website allows the user to select a dataset and enter a list of genes or a pre-generated gene list. The cBioportal offers unique analyses like OncoPrint diagrams, MEMo (Mutual Exclusivity Modules) analysis, customisable correlation plots, Kaplan-Meier plots, network analysis and integrative genomics viewer integration. Oncoprint diagrams are a simple way to present genomic alterations like somatic mutations and copy number alterations across a set of samples. These diagrams allow the user to detect visually co-occurrence or mutual exclusivity of genomic alternations within a cohort. MEMo analysis identifies mutations in genes sharing a pathway and exhibiting a pattern of mutually exclusive mutations across a cohort [9]. The cBioportal provides analysis of the RNAseq and RPPA data types by setting z-score thresholds for significant genes and proteins, respectively. Network analysis integration with Cytoscape allows the user to view gene networks and their interactions for selected genes. Integrative genomics viewer integration allows for users to visualise easily copy number alterations, mutations and gene expression across all the chromosomes at a genome level. Finally, all data analysed can be downloaded in table format for further analysis.
GDAC firehose preprocesses annotated data from TCGA and provides correlations and differential gene analysis across all data types. GDAC firehose periodically updates with new TCGA cases and performs automated pipelines on all the data every 4 months. Unique analysis pipelines from GDAC firehose include GISTIC2 analysis of copy number data [10], MutSig2 analysis of mutation data [11], and PARADIGM analysis of copy number and RNAseq data [12]. GDAC firehose also provides correlation of the clinical data with miRNA, mRNA, RPPA, copy number and DNA methylation datasets. They also perform clustering analysis for each data type and define molecular subtypes, which are then correlated to the clinical, mutation and copy number data.
The canEvolve site hosts over 10 000 tumour samples from 90 cancer studies, which include 15 TCGA datasets. This web portal allows the user to select a database and perform multiple downstream analyses, which include differential gene expression, miRNA expression, copy number analysis, regulatory network analysis using ARACNE [13], co-expression network analysis using WGCNA [14], gene set enrichment analysis using the MSigDB 3.0 gene sets [15], integrative gene expression and miRNA expression analysis using GemiNI [16], integrative gene expression and copy number analysis using DR-Integrator [17], integrative genomic and gene expression analysis, integrative genomic and protein expression analysis and survival analysis. In addition, canEvolve allows gene queries across multiple datasets, where the user can select a pre-defined gene list from KEGG or Biocarta pathway or supply their own gene list and interrogate the pattern of gene expression in a given dataset.
PROGgeneV2 is the second iteration of PROGgene. It is a web tool that contains over 19 000 samples from 134 cohorts in 21 cancer types. PROGgeneV2 mainly provides survival analyses based on expression of one gene or the ratio between two genes, which is unique to this tool. Survival plots can also be created using gene signatures from GO, KEGG, Biocarta and Reactome databases, and from published studies. Covariate data, such as stage of the cancer, can also be adjusted for the survival plots. Another unique feature for PROGgeneV2 is the option for users to upload their own data to the website. As omics datasets become more widely applied by end-users with less informatics training, this feature will become increasingly more important in order to understand how individual patient data compares with much larger cohorts.
The UCSC cancer browser also provides visualisation and analysis tools for the TCGA datasets. Unique to this tool is the interactive analysis of multiple datatypes for a cancer dataset. The user can select a dataset to visualise from a menu, such as gene expression or DNA methylation, and then stratify according to clinical parameters or another dataset. For instance, the user can select for the mutated genes dataset in a cancer and stratify according to the clustering of miRNA and DNA methylation signatures. This allows the user to define specific subgroups within the cancer and subsequently to perform survival analyses on these subgroups. The user can also specify which genes or gene signatures to visualise within a dataset. Users can upload their own annotations to the clinical heatmap for specific clustering. The UCSC cancer browser will be updated in the future, with the new Xena platform for visualisation and integration with Galaxy [18, 19].
|
Table 2: Webtools for TCGA analysis. |
|
Webtool
|
Kaplan Meier plots
|
Mutation analysis
|
Correlation analysis
|
Differential expression analysis
|
Pathway analysis
|
Pan-cancer analysis
|
Number of samples
|
URL
|
| cBioportal |
x |
x |
x |
|
x |
x |
>20 000 |
http://www.cbioportal.org/ |
| GDAC firehose |
|
x |
x |
|
x |
|
>10 000 |
http://gdac.broadinstitute.org/ |
| canEvolve |
x |
x |
x |
x |
x |
x |
>10 000 |
http://www.canevolve.org |
| PROgeneV2 |
x |
|
|
|
|
|
>19 000 |
http://watson.compbio.iupui.edu/chirayu/proggene/database/?url=proggene |
| UCSC Cancer browser |
x |
x |
|
|
|
x |
>10 000 |
https://genome.ucsc.edu/ |
| UZH Cancer Browser |
x |
x |
|
x |
x |
|
>1 000 |
http://www.cancer.uzh.ch/research/Three/webtool.html |
UZH webtool for TCGA analysis
Our laboratory is also developing a tool for visualising and analysing the TCGA data with a focus on survival analyses based on expression-based patient stratification: (http://www.cancer.uzh.ch/research/Three/webtool.html/). As this tool is still in development, features are still be updated and new features will be added. Here, we briefly describe the current build of the tool (June 2015). To use the webtool, the user enters a gene in the textbox in the left sidebar and can observe the distribution of expression of that gene across the entire cancer class in the dot plot in the lower portion of the left sidebar. The user can select the percentile of patients to compare in the slider below the textbox and select which tumour entities are included in the analysis by checking the boxes below the slider. In the main panel of the web tool there are tabs for survival, univariate and multivariate Cox regression, mutation profile, copy number profile, combined mutation and copy number profile, differential gene expression presented as a heat map and table of genes, bar graphs comparing clinical features with gene expression, differential protein expression presented as a heat map and table, and, finally, pathway analysis by KEGG pathway and StringDB. For example, the transcript of the NGFR gene, which encodes the CD271 protein that has been associated with melanoma progression [20, 21], has an exponential distribution with a very long tail, resembling a power-law distribution (fig. 1). Thus, comparison of the top and bottom patient quartiles is more meaningful for subsequent analyses than when just a standard 50% threshold is used, because the other 50% of the patients do not provide additional information and dilute the effect of the high-NGFR expressing tumours.
Overall, this web tool attempts to combine visualisation and differential gene analyses for the user to interpret the TCGA data based on single gene selection.
Conclusions
All these web tools provide their specific methods of analysis and each has its advantages for visualisation and interpretation of the TCGA data. Since all these tools used the processed data generated from the TCGA, all analyses should be reproducible by using the same analysis pipelines. The cBioportal and UCSC cancer browser focus on visualisation of the TCGA data with some support for survival and correlation analysis. GDAC firehose and canEvolve focus on analysis of the TCGA data performing many correlation analysis and integrative analysis of the data types within one cancer. PROGgeneV2 is a survival analysis centric tool only focusing on gene expression and survival. Our web tool focuses on gene expression and survival and performs subsequent analyses on mutation and copy profile, differential gene and protein expression and pathway analysis.
In summary, the TCGA is an immensely powerful resource for cancer genome data mining. Many tools have been developed to allow basic researchers and clinicians without bioinformatics training to visualise, analyse and interpret the data. But concerted efforts between bioinformaticians, biologists and clinicians are still needed to understand fully this vast amount of data and to translate it into testable hypotheses and novel diagnostic and therapeutic options for the clinic.
References
1 Weinstein JN, Collisson EA, Mills GB, Shaw KR, Ozenberger BA, Ellrott K, et al., Network CGAR: The Cancer Genome Atlas Pan-Cancer analysis project. Nat Genet. 2013;45:1113–20.
2 Hoadley KA, Yau C, Wolf DM, Cherniack AD, Tamborero D, Ng S, et al. Multiplatform analysis of 12 cancer types reveals molecular classification within and across tissues of origin. Cell. 2014;158:929–44.
3 Brown SD, Warren RL, Gibb EA, Martin SD, Spinelli JJ, Nelson BH, Holt RA. Neo-antigens predicted by tumor genome meta-analysis correlate with increased patient survival. Genome Res. 2014;24:743–50.
4 Li B, Dewey CN: RSEM: accurate transcript quantification from RNA-Seq data with or without a reference genome. BMC Bioinformatics. 2011;12:323.
5 Cerami E, Gao J, Dogrusoz U, Gross BE, Sumer SO, Aksoy BA, et al. The cBio cancer genomics portal: an open platform for exploring multidimensional cancer genomics data. Cancer Discov. 2012;2:401–4.
6 Samur MK, Yan Z, Wang X, Cao Q, Munshi NC, Li C, Shah PK. canEvolve: a web portal for integrative oncogenomics. PLoS One 2013, 8:e56228.
7 Goswami CP, Nakshatri H. PROGgeneV2: enhancements on the existing database. BMC Cancer. 2014;14:970.
8 Zhu J, Sanborn JZ, Benz S, Szeto C, Hsu F, Kuhn RM, et al. The UCSC Cancer Genomics Browser. Nat Methods. 2009;6:239–40.
9 Ciriello G, Cerami E, Sander C, Schultz N. Mutual exclusivity analysis identifies oncogenic network modules. Genome Res. 2012;22:398–406.
10 Mermel CH, Schumacher SE, Hill B, Meyerson ML, Beroukhim R, Getz G: GISTIC2.0 facilitates sensitive and confident localization of the targets of focal somatic copy-number alteration in human cancers. Genome Biol. 2011;12:R41.
11 Lawrence MS, Stojanov P, Polak P, Kryukov GV, Cibulskis K, Sivachenko A, et al. Mutational heterogeneity in cancer and the search for new cancer-associated genes. Nature. 2013;499:214–8.
12 Vaske CJ, Benz SC, Sanborn JZ, Earl D, Szeto C, Zhu J, et al. Inference of patient-specific pathway activities from multi-dimensional cancer genomics data using PARADIGM. Bioinformatics. 2010;26:i237–245.
13 Margolin AA, Nemenman I, Basso K, Wiggins C, Stolovitzky G, Dalla Favera R, Califano A: ARACNE: an algorithm for the reconstruction of gene regulatory networks in a mammalian cellular context. BMC Bioinformatics. 2006;7(Suppl 1):S7.
14 Langfelder P, Horvath S. WGCNA: an R package for weighted correlation network analysis. BMC Bioinformatics. 2008;9:559.
15 Subramanian A, Tamayo P, Mootha VK, Mukherjee S, Ebert BL, Gillette MA, et al. Gene set enrichment analysis: a knowledge-based approach for interpreting genome-wide expression profiles. Proc Natl Acad Sci U S A. 2005;102:15545–50.
16 Yan Z, Shah PK, Amin SB, Samur MK, Huang N, Wang X, et al. Integrative analysis of gene and miRNA expression profiles with transcription factor-miRNA feed-forward loops identifies regulators in human cancers. Nucleic Acids Res. 2012;40:e135.
17 Salari K, Tibshirani R, Pollack JR. DR-Integrator: a new analytic tool for integrating DNA copy number and gene expression data. Bioinformatics. 2010;26:414–6.
18 Giardine B, Riemer C, Hardison RC, Burhans R, Elnitski L, Shah P, et al. Galaxy: a platform for interactive large-scale genome analysis. Genome Res. 2005;15:1451–5.
19 Goldman M, Craft B, Swatloski T, Cline M, Morozova O, Diekhans M, et al. The UCSC Cancer Genomics Browser: update 2015. Nucleic Acids Res. 2015;43:D812–817.
20 Boiko AD, Razorenova OV, van de Rijn M, Swetter SM, Johnson DL, Ly DP, et al. Human melanoma-initiating cells express neural crest nerve growth factor receptor CD271. Nature. 2010;466:133–7.
21 Civenni G, Walter A, Kobert N, Mihic-Probst D, Zipser M, Belloni B, et al. Human CD271-positive melanoma stem cells associated with metastasis establish tumor heterogeneity and long-term growth. Cancer Res. 2011;71:3098–09.