Trends and characteristics of attendance at the emergency department of a Swiss university hospital: 2002–2012
DOI: https://doi.org/10.4414/smw.2015.14141
Maya
Shaha, Selina
Gmuer, Andreas W.
Schoenenberger, Fabienne Sarah
Gerber, Aristomenis K.
Exadaktylos
Summary
BACKGROUND: The numbers of people attending emergency departments (EDs) at hospitals are increasing. We aimed to analyse trends in ED attendance at a Swiss university hospital between 2002 and 2012, focussing on age-related differences and hospital admission criteria.
METHODS: We used hospital administrative data for all patients aged ≥16 years who attended the ED (n = 298,306) at this university hospital between 1 January 2002, and 31 December 2012. We descriptively analysed the numbers of ED visits according to the admission year and stratified by age (≥65 vs <65 years).
RESULTS: People attending the ED were on average 46.6 years old (standard deviation 20 years, maximum range 16‒99 years). The annual number of ED attendances grew by n = 6,639 (27.6%) from 24,080 in 2002 to 30,719 in 2012. In the subgroup of patients aged ≥65 the relative increase was 42.3%, which is significantly higher (Pearson’s χ2 = 350.046, df = 10; p = 0.000) than the relative increase of 23.4% among patients <65 years. The subgroup of patients ≥65 years attended the ED more often because of diseases (n = 56,307; 85%) than accidents (n = 9,844; 14.9%). This subgroup (patients ≥65 years) was also more often admitted to hospital (Pearson’s χ2 = 23,377.190; df = 1; p = 0.000) than patients <65 years.
CONCLUSIONS: ED attendance of patients ≥65 years increased in absolute and relative terms. The study findings suggest that staff of this ED may want to assess the needs of patients ≥65 years and, if necessary, adjust the services (e.g., adapted triage scales, adapted geriatric screenings, and adapted hospital admission criteria).
Introduction
Emergency departments (EDs) are essential components of healthcare systems. They often constitute an individual’s first point of contact with a care provider [1]. Persons who have to attend EDs usually have a sudden health problem that requires medical attention. Approximately 20% of the population of the United States visits emergency services annually. The main reasons for ED attendance include respiratory tract problems, hypertension or open wounds. About half of the emergency department attendances lead to hospitalisation. Cardiovascular problems such as chest pain, heart failure or dysrhythmia often lead to hospitalisations [1]. Women visit the ED more often than men [2]. Being over 65 years old with a trauma contributes to a longer stay in the ED than being younger or being elderly without a trauma [3]. Elderly persons are also more likely to be hospitalised than their younger counterparts [4]. Observations in EDs in the United States indicate that between 12% and 24% of all visits are by people aged 65 years and over [5, 6]. In Switzerland, similar developments were observed at an ED of a regional hospital [7]. The ED use by patients of 85 years or more has increased by 26% between 2005 and 2010 in a university hospital in the French-speaking part of Switzerland. Persons over 85 years often stayed longer at the ED than their younger counterparts. ED visits by persons over 85 years were more likely to end in hospitalisation [8]. Age and age-related factors, combined with social restrictions such as living alone, contribute to longer ED stays by elderly people [9]. These problems also demand more attention by medical and nursing professionals. Fewer staff are available for other patients, and there is a risk of ED overflow. Overflow is to be avoided at all costs, as this has a negative influence on patient outcomes [10, 11].
Changes in the ED are regularly monitored by national surveys in the United States [1]. These data are carefully analysed as part of the US Institute of Medicine initiative to improve the ED situation across the United States [12–14]. Despite this monitoring, few changes have happened in EDs [15]. Nevertheless, these data can be used to predict the development of ED consultations, and thus to improve the response to future challenges [16, 17]. However, similar data are not readily available in Switzerland. At present, national surveys of ED consultations are not conducted and trends are difficult to identify. Few studies have been published that provide an overview of ED consultations at specific institutions [7, 8]. In order to identify the need to adjust to future challenges, ED consultations at a university hospital in the German-speaking part of Switzerland were analysed for the period from 2002 to 2012.
In this retrospective trend analysis study we aimed to evaluate (a) the trends in patient characteristics (age, gender), (b) the trend in the number of absolute ED attendances, and (c) the trends of admission criteria to the ED.
Material and methods
Study design
A retrospective study was conducted of hospital administrative data from all patients presenting to the ED of a university hospital in Switzerland between 2002 and 2012. The study was approved by the relevant cantonal ethics committee.
Study setting and population
Hospital administrative data of ED attendances between 1 January 2002 and 31 December 2012 were employed for this analysis. All data were anonymous.
The university hospital comprises approximately 1,000 beds, and has about 40,000 inpatients annually. About 290,000 outpatients are seen per annum. The mean length of stay in hospital is 6.4 days. There are approximately 30,000 patient attendances annually to the ED of this university hospital. Patients attending this ED are usually 16 years or over. Children under 16 years are commonly treated at the children’s ED of this hospital. The ED treats patients with any kind of health problem, from small cuts to fatal accidents or diseases such as respiratory tract problems or cardiovascular diseases, 24 hours a day, seven days a week. This ED consisted of two sections at the time of the study. After accidents, patients were predominantly admitted to the surgical section, whereas patients suffering from diseases were predominantly treated in the medical section. The label “accidents” was attributed to all patients having experienced some sort of trauma, be it a cut from a knife or a severe multiorgan trauma as a result from an accident. By contrast, the label “diseases” in this context included all kinds of manifestations such as cancer, respiratory tract or cardiovascular health problems. These two labels refer to the insurance body (SUVA – Swiss Accident Insurance Fund for injuries induced by accidents or the Swiss Health Insurance for health problems due to diseases) applicable to each person’s attendance. The surgical and medical sections were located on the same floor and connected via a small corridor. The surgical section had 12 beds, including two shock/trauma facilities, and the medical department had 14 beds. A total of 108 health professionals (38 physicians occupying 25.4 positions, and 70 nurses occupying 50.5 positions) were working at this ED, divided into two teams that worked in the two sections. The physicians worked either in the surgical or in the medical section, whereas the nurses were able to work in both sections, with monthly rotation [18].
Key variables
Hospital administrative data were transferred into a database to combine the years 2002 up to 2012. These data contain patient age, gender, nationality, time of ED attendance and discharge, type of ED admission (outpatient or hospitalisation), type of health problem (accident or disease as indicated by the insurance body), type of treatment (surgery or medicine). The hospital administrative data does not include specific diagnoses or indicators of severity of the cases. Such data are collected in other databases and was not integrated into our database.
Data analysis
To investigate the hypotheses for this study, descriptive and inferential statistics were applied on the data compiled from the hospital administrative database. Frequencies and distributions were calculated. Histograms were used to illustrate frequencies and distributions. To determine differences between variables, the Pearson χ2 test was calculated for nominal data. Trends were calculated based on existing data with exponential regression. The statistical software package SPSS Version 19® and Microsoft Excel 10® were used.
Results
Frequencies of attendances
A total of 301,657 attendances were extracted from the hospital administrative database. Of these, only 10 patients were eliminated in compliance with the demands of the ethics committee. These 10 patients had specifically asked not to take part in any study at the university hospital. Of this database, a total of 3,331 observations were removed as they concerned patients younger than 16 years. Another 10 observations were removed as the patient's gender was not identified. Consent was waived.
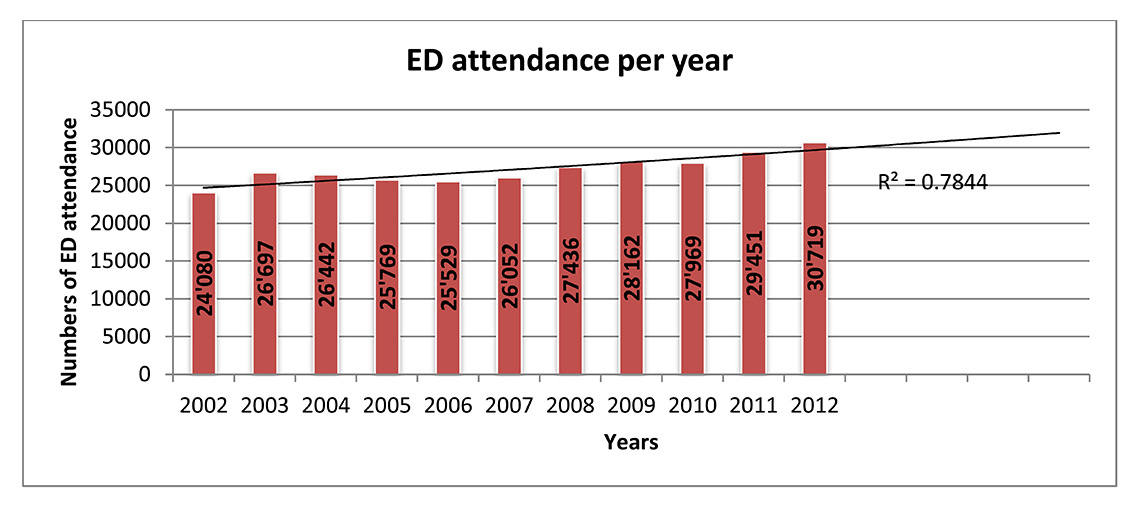
Figure 1
Changes in emergency department (ED) attendance between 2002 and 2012.
The numbers of ED attendance from 2002 to 2012 of all patients are provided. Each bar represents one year, as indicated by the x-axis. The numbers within each bar represent the numbers of patients attending the ED within that particular year. The line represents the trend of an exponential regression with the calculated coefficient R2=0.7844 of the overall ED attendance based on the existing data. It is probable that ED attendance will continue to grow.
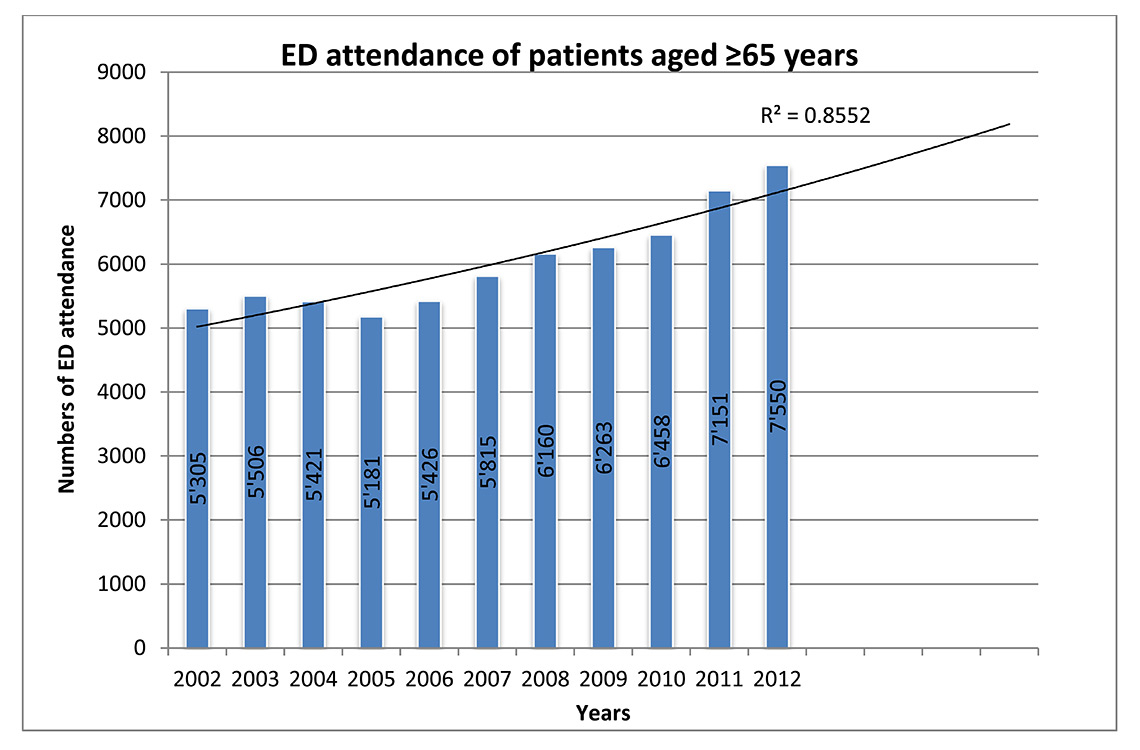
Figure 2
Trend of emergency department (ED) visits by patients aged 65 years and over.
The development of the ED attendance of patients ≥65 years between 2002 and 2012 is provided. The line represents the trend of an exponential regression with the calculated coefficient R2= 0.8552 of the ED attendance of this patient group based on the existing data. It is probable that the patients ≥65 years will continue to grow.
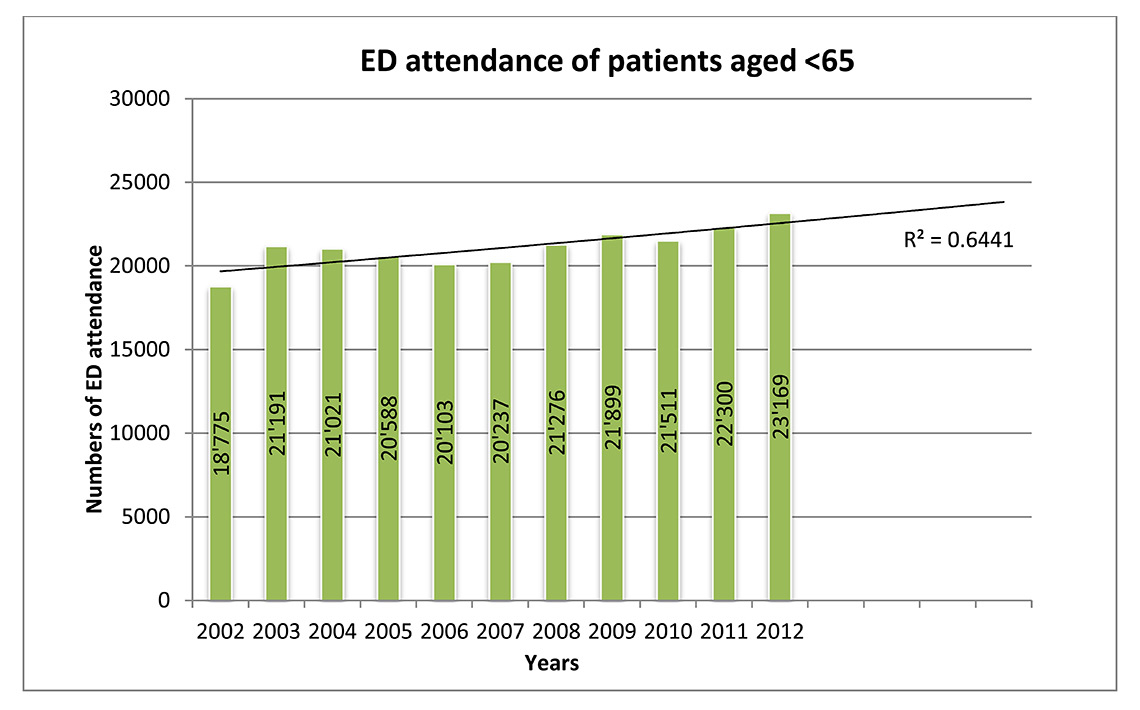
Figure 3
Trend of emergency department (ED) visits of patients aged less than 65 years.
The development of the ED attendance of patients <65 years is provided. The line represents the trend of an exponential regression with the calculated coefficient R2= 0.6411of ED attendance of this patient group based on the existing data. The group of patients <65 years will continue to grow, but less so than the patients ≥65 years.
Between 2002 and 2012, a total of 298,306 visits to the ED of this university hospital were identified. A significant majority of the ED visits were by men (n = 172,172; 57.7%; Pearson χ2 = 26,529; df = 10; p = 0.003). Patients attending this ED were on average 46.6 years old (standard deviation [SD] 20 years, range 16‒99 years). Men were on average 46.4 years old (SD 19.5 years, range 16‒99 years), whereas women were on average 46.8 years old (SD 20.7 years, range 16‒99 years).
The annual number of ED attendances increased from 24,080 (in 2002) to 30,719 (in 2012) (fig. 1). A total increase of over 27.6% was observed between 2002 and 2012. A regression coefficient of R2= 0.7844 was calculated based on existing data, which indicated a trend towards growing ED attendance. The number of male attendants to the ED ranged from n = 13,843 (57.4%) in 2002 to n = 17,552 (57.1%) in 2012. Attendance by female patients ranged from n = 10,256 (42.6%) in 2002 to n = 13,167 (42.9%) in 2012. In the age group <65 years, a significant majority (Pearson χ2 = 24,812; df = 10; p = 0.006) of men (n = 135,917; 58.6%) attended the ED between 2002 and 2012. Similarly, a significant majority (Pearson χ2 = 49.079; df = 10; p = 0.000) of men aged 65 years and over (n = 36,255; 54.7%) attended the ED. In the age group <65 years, the attendance of men in absolute numbers ranged between n = 11,011 (58.6%) in 2002 to n = 13,336 (57.7%) in 2012. In the same age group, the absolute numbers of attendance of women varied between n = 7,764 (41.4%) in 2002 and n = 9,806 (42.3%) in 2012. In the age group ≥65 years, the absolute numbers of men’s ED attendance ranged between n = 2,813 (53.0%) in 2002 to n = 4,189 (55.5%) in 2012. The absolute number of ED attendance of women in this age group varied from n = 2,492 (47.0%) in 2002 to n = 3,361 (44.5%) in 2012.
The majority of persons attending this ED between 2002 and 2012 were Swiss (n = 225,865, 75.7%), with an average age of 48.9 years (SD 20.7 years, range 16‒99 years). A total of n = 72,441 (24.3%) persons were not Swiss. Their average age was 39.1 years (SD 15.4 years, range 16‒99 years). Among the Swiss persons, there were 129,244 men (57.2%) and among the persons who were not Swiss, there were 42,928 men (59.3%).
Attendances by patients aged 65 years or more
In 2002, n = 5,305 of all visits were by patients aged 65 years and over. In 2012, the attendances by patients ≥65 years increased to n = 7,550. Overall, the visits by patients ≥65 years or over grew by n = 2245 (42.32%) in absolute numbers between 2002 and 2012.
Between 2002 and 2012, ED attendance of patients aged 65 years and over surged in 2003 to n = 26,697 (annual growth as compared with the preceding year: 10.87%) (fig. 2). Between 2004 and 2005, the ED attendance of patients ≥65 years decreased (table 1). From 2006 to 2012 ED attendance of patients ≥65 years increased steadily (table 1).
The group of patients ≥65 years grew significantly more (Pearson’s χ2 = 350,046; df = 10; p = 0.000) between 2002 and 2012 than the group of patients <65 years. Between 2002 and 2012, the annual growth compared of patients ≥65 years attending the ED ranged from –4.43% in 2005 to 10.73% in 2011 (table 1). On average, the annual growth of the ED attendance of patients aged 65 years and over amounts to 3.59% (table 1). Therefore, a steadily increasing trend of ED attendance of patients aged 65 years and over can be identified (aims [a] and [b]).
Attendances by patients younger than 65 years
The attendance of patients <65 years increased between 2002 (n = 18,775) and 2012 (n = 23,169) (fig. 3). The overall growth of ED attendance among patients younger than 65 years was n = 4,394 (23.4%). Therefore, the group of patients <65 years did not grow as markedly as the group of patients ≥65 years. There is a trend of increasing numbers of ED attendance of patients <65 years, but this trend is exceeded by ED attendances of patients ≥65 years (aims [a] and [b]).
Between 2002 and 2012, the ED attendance of patients younger than 65 years surged in 2003 (n = 21,191; annual growth as compared with the preceding year: 12.87%), and then decreased 2004 and 2006 (table 1). ED attendance of this patient group (<65 years) increased again in 2007 (n = 20,237; annual growth as compared with the preceding year: 0.67%). On average, the annual growth of ED visits by patients younger than 65 years amounted to 2.13% (table 1). The annual growth of visits by patients <65 years ranged from –2.36% in 2006 to 12.87% in 2003.
Proportion of patients admitted to hospital
There were two types of admission registered at this ED. Patients who attended the ED and could return home directly were classed as outpatient admissions. Patients who attended the ED and as a result of their health problem had to stay, were subsequently admitted to the hospital. Most consultations were as outpatients (n = 182,942; 61.3%). Between 2002 and 2012, ED attendance of outpatients demonstrated an absolute increase by n = 5,833 (44%); from a total of 13,257 visits (55.1%) in 2002 to 19,090 (62.1%) visits in 2012. The number of patients admitted to hospital also demonstrated an absolute increase by n = 806 (7.4%); from 10,823 (44.9%) in 2002 to 11,629 (37.9%) in 2012. This development was significant, with Pearson’s χ2= 3,355.423; df = 10; p <0.001. However, the development of the proportion of patients admitted to hospital did not change between 2002 and 2012 (Pearson’s r = –0.056, p <0.001).
The type of admission differed by age group. Patients ≥65 years were significantly more often admitted to hospital than patients <65 (Pearson’s χ2= 23,377.190; df = 1; p = 0.000). Between 2002 and 2012, 35.8% (n = 23,718) patients aged ≥65 years were seen as outpatients, whereas the majority of this patient group (≥65 years) were admitted to hospital (64.2%, n = 42,518). By contrast, 68.6% (n = 159,224) patients younger than 65 years were treated as outpatients, and only 31.4% (n = 72,846) patients <65 years were hospitalised.
On average, patients who could return home after their ED attendance were 41.2 years old (SD 18.1 years; range 16‒99 years). Patients who needed to be admitted to hospital as a result of their health problem were on average 54.9 years old (SD 20.0 years; range 16‒99 years).
Reasons for attendances
Multiple reasons for ED attendance exist. However, in this sample most were related to accidents (n = 80,631, 27.0%) or diseases (n = 216,891; 72.7%). This constituted a significant difference (Pearson χ2= 1,153.619; df = 20, p <0.000). ED attendance due to diseases increased steadily between 2002 and 2012 by n = 6,068 (34.9%) from 17,391 (72.2%) to 21,935 (74.5%). The number of patients attending the ED because of diseases ranged from 69.1% (n = 18,277 in 2004) to 76.4% (n = 23,459 in 2012). Patients who visited the ED owing to diseases had significantly more often to remain in hospital (n = 93,297; 43%) than in the case of accidents (χ2 = 6,752.174; df = 2, p <0.001).
In actual numbers, ED attendance due to accidents increased between 2002 (n = 6,674; 27.7%) and 2012 (n = 7,230; 23.5%) by n = 556 (8.3%). Between 2002 and 2012, ED attendance due to accidents varied between 23.5% (n = 7,230 in 2012) and 30.3% (n = 8,096 in 2003). About 72.3% (n = 59,059) patients who attended the ED as a result of accidents could return home on the same day. About 26.8% of the patients (n = 21,572) attending the ED owing to accident-related issues were hospitalised.
Patients younger than 65 years attended the ED more often because of diseases (n = 160,584; 69.2%) than accidents (n = 70,797; 30.5%). Among patients aged 65 years and over ED attendances due to diseases (n = 56,307; 85%) were also more frequent than those due to accidents (n = 9,844; 14.9%). Therefore, ED attendance due to diseases were more frequent across the two age groups than those due to accidents (χ2 = 6,494.269; df = 2; p <0.000) (aim [c]).
|
Table 1: Emergency department (ED) attendance of patients <65 and patients ≥65 years between 2002 and 2012. |
|
Year
|
|
Aged <65 years
|
Aged ≥65 years
|
Overall
|
| 2002 |
Numbers of ED attendance |
18,775 |
5,305 |
24,080 |
| Growth in % related to preceding year |
– |
– |
– |
| 2003 |
Numbers of ED attendance |
21,191 |
5,506 |
26,697 |
| Growth in % related to preceding year |
12.87 |
3.79 |
10.87 |
| 2004 |
Numbers of ED attendance |
21,021 |
5,421 |
26,442 |
| Growth in % related to preceding year |
–0.80 |
–1.54 |
–0.96 |
| 2005 |
Numbers of ED attendance |
20,588 |
5,181 |
25,769 |
| Growth in % related to preceding year |
–2.06 |
–4.43 |
–2.55 |
| 2006 |
Numbers of ED attendance |
20,103 |
5,426 |
25,529 |
| Growth in % related to preceding year |
–2.36 |
4.73 |
-0.93 |
| 2007 |
Numbers of ED attendance |
20,237 |
5,815 |
26,052 |
| Growth in % related to preceding year |
0.67 |
7.17 |
2.05 |
| 2008 |
Numbers of ED attendance |
21,276 |
6,160 |
27,436 |
| Growth in % related to preceding year |
5.13 |
5.93 |
5.31 |
| 2009 |
Numbers of ED attendance |
21,899 |
6,263 |
28,162 |
| Growth in % related to preceding year |
2.93 |
1.67 |
2.65 |
| 2010 |
Numbers of ED attendance |
21,511 |
6,458 |
27,969 |
| Growth in % related to preceding year |
–1.77 |
3.11 |
–0.69 |
| 2011 |
Numbers of ED attendance |
22,300 |
7,151 |
29,451 |
| Growth in % related to preceding year |
3.67 |
10.73 |
5.30 |
| 2012 |
Numbers of ED attendance |
23,169 |
7,550 |
30,719 |
| Growth in % related to preceding year |
3.90 |
5.58 |
4.31 |
| |
| |
Mean growth in % overall per year |
2.13 |
3.59 |
2.46 |
| Growth in % from 2002 to 2012 |
23.40 |
42.32 |
27.57 |
| Overall ED attendances between 2002 and 2012 |
232,070 |
66,236 |
298,306 |
| Apart from 2002, the annual growth is calculated in % for each year as compared to the preceding year. |
Discussion
In the United States, the increase in ED attendance has given rise to much concern and a programme to improve the situation was started by the Institute of Medicine [13]. The main issues in relation to the augmentation of ED visits are crowding, restricted service, and reduced work satisfaction for healthcare professionals [19, 20]. The ED at the Swiss university hospital where this study was carried out has also experienced a significant increase in visits between 2002 and 2012. There are about 100 patients daily attending this ED, leading to overcrowding or a reduction of health professionals’ work satisfaction, causing potential dangers [10].
Between 2004 and 2007 ED attendance at this Swiss university hospital decreased. This is due to the fact that another ED opened in 2004 as a joint venture with other healthcare providers in the area. This joint venture ED is of a smaller size and provides only out-patient services. From 2007 onward the attendance at the ED of the Swiss university hospital grew again. Reasons for this development need more investigation
An important trend that has been described in the literature is the significant increase in visits to EDs by patients aged 65 and over [5, 6], which was also the case for the study ED. The growth of ED attendance of patients ≥65 years is higher than the annual augmentation of the population of the respective region [21]. In addition, it has been observed at the study ED that the attendance of patients ≥65 years increased in 2005, i.e. earlier than that of younger patients. Elderly patients ≥65 years have a higher risk of being admitted to hospital than younger patients [4]. More elderly patients live alone, which also contributes to higher hospital admissions [9]. The continuously increasing ED attendance of patients ≥65 years – despite the opening of the joint venture ED – suggests that this group of patients has greater needs that can be addressed only in the university ED.
The majority of patients to the study ED were men. At other EDs, the majority of the patients were female [2]. The respective region in Switzerland, where this ED is situated, has a larger population of women (499,332) than men (474,903) [22]. However, the ED department of this university hospital does not regularly admit women with gynaecological problems. A special ED unit located in the gynaecology department normally covers this.
Disease-specific reasons for ED attendance constitute the majority of the hospital admissions overall and for each age group at this ED. In the United States and Canada, cardiovascular and respiratory tract diseases, as well as injuries with open wounds, constitute major reasons for ED visits. More specifically, heart pain and dysrhythmia lead to hospital admissions among ED visitors in the United States or Canada [1, 2]. In the United States approximately half of the ED consultations lead to hospital admissions [1]. At the study ED, the detailed diagnoses of the attending patients have yet to be identified systematically. However, informal data indicate that attending patients suffer from trauma including bleeding, pain issues, nausea and vomiting, respiratory tract diseases such as pneumonia or dyspnoea, cardiovascular disease such as arrhythmia, or manifestations of the cerebral processes such as strokes [23].
It is important to explore the diagnoses leading to ED attendance at this Swiss university hospital to provide a healthcare service that is tailored to patient needs. It is noticeable that disease-related issues contribute more often to hospital admission at the study ED. To provide quality care to the group of patients aged 65 and over, validated instruments focussing on the assessment of functionality and frailty or other age-specific health problems need to be included [24, 25].
In the United States and Canada healthcare service consultations, such as ED attendance, constitute important survey parameters, which are investigated at regular intervals [1, 2, 4]. This monitoring provides an empirical basis for a critical review of ED services and to determine future trends, so that services can be adapted if necessary [12, 13]. Switzerland does not regularly monitor ED consultations on a national level and few overviews of Swiss ED admissions per service are available. In order to provide adequate services tailored to patients’ needs, regular monitoring of ED visits would be helpful. However, it is essential that the data on ED attendance includes diagnosis-related information. Thus, future challenges can be identified and responsive measures developed.
Although important trends have been identified in this study, a number of limitations need to be addressed. The database used for this analysis did not include diagnoses of the ED attenders. Information relating to the reasons for the ED attendance is important in order to identify special features among the different age or gender groups. Generalisation of the study findings to Switzerland or Europe is limited as this database only includes the hospital administrative data of one university hospital in Switzerland. Despite the opening of a joint venture ED in the middle of the observed period 2002 and 2012, attendance at the study ED was only temporarily affected. Two years into the existence of the joint venture, attendance at the study ED increased again. It is therefore important to review ED attendance at the study ED and also the joint venture ED in combination with diagnosis-related information, in order to identify the relationship between the two EDs and to respond better to patients’ needs.
Conclusion
Between 2002 and 2012, the ED of this Swiss university hospital experienced an increase in visits of persons aged over 16. In particular, there is a significant increase in visits of elderly persons aged 65 and over. Although the detailed diagnoses of the patients are not known, the findings highlighted that disease-related reasons for ED attendance commonly led to hospital admission. The ED of this university hospital may want to assess the current services provided to patients ≥65 years, the needs of this patient group and, if necessary, to tailor the services better to patients aged 65 and over with diseases such as cardiovascular or respiratory tract diseases. This population requires high expertise and close interdisciplinary collaboration [4, 6].
|
Study group authorship
|
|
Group member
|
Study conceptualisation
|
Data collection and analysis
|
Manuscript conceptualisation, writing
|
Editing
|
| Maya Shaha |
x |
x |
x |
x |
| Selina Gmür |
|
x |
x |
x |
| Fabienne S. Gerber |
x |
x |
x |
x |
| Andreas Schönenberger |
x |
|
|
x |
| Patrick Zumstein |
x |
|
x |
x |
| Aristomenis Exadaktylos |
x |
|
x |
x |
References
1 Owens PL, Barrett ML, Gibson TB, Andrews RM, Weinick RM, Mutter RL. Emergency department care in the United States: a profile of national data sources. Ann Emerg Med. 2010;56(2):150–65.
2 Li G, Lau JT, McCarthy ML, Schull MJ, Vermeulen M, Kelen GD. Emergency department utilization in the United States and Ontario, Canada. Acad Emerg Med. 2007;14(6):582–4.
3 Biber R, Bail HJ, Sieber C, Weis P, Christ M, Singler K. Correlation between age, emergency department length of stay and hospital admission rate in emergency department patients aged >/=70 years. Gerontol. 2013;59(1):17–22.
4 Pines JM, Mullins PM, Cooper JK, Feng LB, Roth KE. National trends in emergency department use, care patterns, and quality of care of older adults in the United States. J Am Geriatr Soc. 2013;61(1):12–7.
5 Baumann MR, Strout TD. Triage of geriatric patients in the emergency department: validity and survival with the Emergency Severity Index. Ann Emerg Med. 2007;49(2):234–40.
6 Samaras N, Chevalley T, Samaras D, Gold G. Older patients in the emergency department: a review. Ann Emerg Med. 2010;56(3):261–9.
7 Businger A, et al. Demographic changes and their implications in a nonacademic emergency department in Switzerland: an 11–year trend analysis (2000–2010) of 104,510 patients International Scholarly Research Network, ISRN Emergency Medicine. 2012. 2012.
8 Vilpert S, Ruedin HJ, Trueb L, Monod-Zorzi S, Yersin B, Büla C. Emergency department use by oldest-old patients from 2005 to 2010 in a Swiss university hospital. BMC Health Serv Res. 2013;13:344.
9 McCusker J, Kakuma R, Abrahamowicz M. Predictors of functional decline in hospitalized elderly patients: a systematic review. J Gerontol A Biol Sci Med Sci. 2002;57(9):M569–77.
10 Hastings SN, Heflin MT. A systematic review of interventions to improve outcomes for elders discharged from the emergency department. Acad Emerg Med. 2005;12(10):978–86.
11 Shanley C, Sutherland S, Stott K, Tumeth R, Whitmore E. Increasing the profile of the care of the older person in the ED: a contemporary nursing challenge. Int Emerg Nurs. 2008;16(3):152–8.
12 Institute of Medicine (U.S.). Committee on the Future of Emergency Care in the United States Health System., Hospital-based emergency care: at the breaking point. Future of emergency care. 2007, Washington, D.C.: National Academies Press. xxiii, 397 p.
13 Institute of Medicine (U.S.). Committee on the Future of Emergency Care in the United States Health System., Emergency medical services at the crossroads. Future of emergency care. 2007, Washington, D.C.: National Academies Press. xxii, 285 p.
14 Albert M, McCaig LF, Ashman JJ. Emergency department visits by persons aged 65 and over: United States, 2009–2010. NCHS Data Brief. 2013(130):1–8.
15 Berger E. Bad report card. Ann Emerg Med. 2014;63(3):11A-12A.
16 Wargon M, Guidet B, Hoang TD, Hejblum G. A systematic review of models for forecasting the number of emergency department visits. Emerg Med J. 2009;26(6):395–9.
17 Schweigler LM, Desmond JS, McCarthy ML, Bukowski KJ, Ionides EL, Younger JG. Forecasting models of emergency department crowding. Acad Emerg Med. 2009;16(4):301–8.
18 Universitäres Notfallzentrum. Universitäres Notfallzentrum 2011 [cited 2014 June,]; Webpage]. Available from: http://www.notfallzentrum.insel.ch/de/information-fuer-patienten/triage/. German.
19 Marcilio I, Hajat S, Gouveia N. Forecasting daily emergency department visits using calendar variables and ambient temperature readings. Acad Emerg Med. 2013;20(8):769–77.
20 Kessler C, Kutka BM, Badillo C. Consultation in the emergency department: a qualitative analysis and review. J Emerg Med. 2012;42(6):704–11.
21 Finanzverwaltung des Kantons Bern. Bevölkerungsbewegung. 2014 [cited 2014 June]; Available from: http://www.fin.be.ch/fin/de/index/finanzen/finanzen/statistik/bevoelk/bevoelkerungsbewegung.html. German.
22 Kantonale Fachstellung für die Gleichstellung von Frauen und Männern, gleich&anders. Zahlen zur Gleichstellung von Frauen und Männern im Kanton Bern Staatskanzlei Bern, Editor. 2011, Kantonale Fachstellung für die Gleichstellung von Frauen und Männern,: Bern. p. 1–56. German.
23 Universitäres Notfallzentrum, Zusammenstellung der ICD-Diagnosen von 2014, Universitäres Notfallzentrum, Editor. 2015, Inselspital, Bern University Hospital: Bern. German.
24 Schoenenberger AW, Bieri C, Özgüler O, Moser A, Haberkern M, Zimmermann H, et al. A novel multidimensional geriatric screening tool in the ED: evaluation of feasibility and clinical relevance. Am J Emerg Med. 2014;32(6):623–8.
25 Graf CE, Giannelli SV, Herrmann FR, Sarasin FP, Michel JP, Zekry D, et al. Identification of older patients at risk of unplanned readmission after discharge from the emergency department – comparison of two screening tools. Swiss Med Wkly. 2012;141: p. w13327.