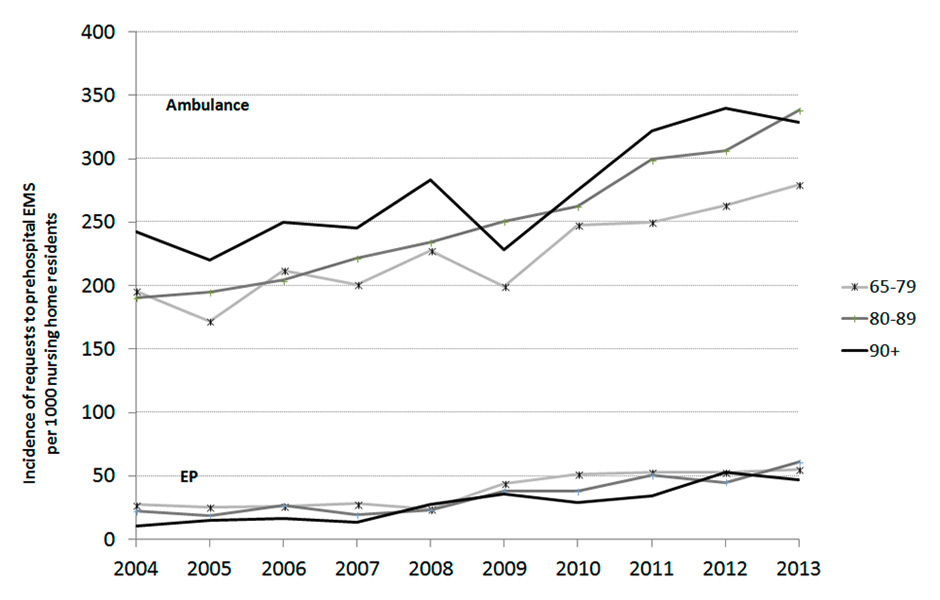
Figure 1
Evolution of the annual incidence of requests to ambulance or emergency physicians(EPs) per 1,000 nursing home residents in the Canton of Vaud, by age category.
DOI: https://doi.org/10.4414/smw.2015.14126
Population ageing is a major concern in industrialised countries, fostered by an increase in life expectancy and by a decrease in birth rate [1, 2]. These trends are particularly noticeable for the oldest elderly patients aged 85 years and over [3]. In European countries, ageing of the population induces a concurrent increase in the number of nursing home residents (NHRs) [1, 4]. In England, five out of every thousand people are now living in a nursing home and the trend predicts a progressive increase in the following years [5]. NHRs aged 65 years and over (65+ yr) are particularly vulnerable, present multiple chronic conditions and require frequent hospital admissions [6, 7]. Concurrently, the management of acute situations involving elderly NHRs is complicated by the increasingly limited availability of general practitioners, the limited emergency skills of nursing home personnel and the lack of preparedness of prehospital emergency professionals [8, 9]. Thus, for these patients, the prehospital emergency medical services (EMS) are frequently the only way to access acute care and often constitute the best pathway to the hospital. The consequence is a progressive increase in EMS interventions in nursing homes and an almost systematic transfer of these patients to the hospital emergency department (ED), resulting in an increase in ED visits by these elderly patients [3, 10].
In Europe, the proportion of interventions by EMS for elderly patients is increasing [11–13]. This has been emphasised in a recent study performed in the Canton of Vaud, Switzerland, showing a 44.9% increase of EMS interventions over 10 years for patients aged 80 years and over [14]. Nevertheless, nothing is known about the actual trend of EMS interventions in nursing homes over the last decade. Assessing this evolution, together with identifying NHRs’ actual needs, is, however, of major importance regarding its impact on the required competencies and skills of EMS professionals.
The aim of this study was to describe the evolution of the incidence of requests to prehospital EMS interventions (ambulances, respectively emergency physicians) for NHRs aged 65 years and over, in a Swiss Canton between 2004 and 2013.
| Table 1:Characteristics of ambulance interventions in nursing home residents aged 65 years and over. | |||||||||||
| 2004 | 2005 | 2006 | 2007 | 2008 | 2009 | 2010 | 2011 | 2012 | 2013 | Total | |
| Number of ambulance interventions | 1,124 | 1,065 | 1,191 | 1,299 | 1,369 | 1,314 | 1,506 | 1,729 | 1,810 | 1,898 | 14,235 |
| Age, n (%) | |||||||||||
| 65–79 years | 223 (19.8) | 203 (19.1) | 254 (21.3) | 237 (19.3) | 268 (19.6) | 239 (18.2) | 302 (20.1) | 303 (17.5) | 335 (18.5) | 361 (19.0) | 2,725 (19.2) |
| 80–89 years | 490 (43.6) | 488 (45.8) | 523 (43.9) | 577 (47.0) | 628 (45.9) | 699 (53.2) | 729 (48.4) | 827 (47.8) | 831 (45.9) | 896 (47.2) | 6,688 (46.9) |
| ≥90 years | 411 (36.6) | 374 (35.1) | 414 (34.8) | 415 (33.8) | 473 (34.6) | 376 (28.6) | 475 (31.5) | 599 (34.6) | 644 (35.6) | 641 (33.8) | 4,822 (33.9) |
| Gender, n (%) | |||||||||||
| Female | 785 (69.8) | 738 (69.4) | 815 (68.4) | 841 (68.5) | 935 (68.4) | 933 (71.0) | 1,011 (67.1) | 1,152 (66.6) | 1,249 (69) | 1,263 (66.5) | 9,722 (68.5) |
| Male | 339 (30.2) | 325 (30.6) | 376 (31.6) | 387 (31.5) | 433 (31.7) | 381 (29.0) | 495 (32.9) | 577 (33.4) | 561 (31) | 635 (33.5) | 4,509 (31.5) |
| NACA score categories, n (%) | |||||||||||
| 0–3 | 979 (87.1) | 916 (86) | 1,004 (84.3) | 1,060 (86.3) | 1,139 (83.2) | 1,106 (84.2) | 1,296 (86.1) | 1,471 (85.1) | 1,525 (84.3) | 1,616 (85.1) | 12,112 (85.2) |
| 4–6 | 141 (12.5) | 141 (13.2) | 179 (15.0) | 164 (13.3) | 221 (16.1) | 195 (14.8) | 202 (13.4) | 246 (14.2) | 269 (14.9) | 268 (14.1) | 2,026 (14.2) |
| 7 | 4 (0.4) | 8 (0.8) | 8 (0.7) | 5 (0.4) | 9 (0.7) | 13 (1) | 8 (0.5) | 12 (0.7) | 16 (0.9) | 14 (0.7) | 97 (0.7) |
| Main reasons for intervention, n (%) | |||||||||||
| Cardiac arrest | 5 (0.5) | 8 (0.8) | 9 (0.8) | 6 (0.5) | 13 (1.0) | 10 (0.8) | 11 (0.7) | 15 (0.9) | 17 (0.9) | 19 (1.0) | 113 (0.8) |
| Coma, convulsions | 49 (4.4) | 58 (5.5) | 70 (5.9) | 78 (6.4) | 60 (4.4) | 59 (4.5) | 90 (6.0) | 86 (5.0) | 94 (5.2) | 103 (5.4) | 747 (5.3) |
| Respiratory distress | 103 (9.2) | 108 (10.1) | 153 (12.9) | 141 (11.5) | 177 (12.9) | 164 (12.5) | 159 (10.6) | 209 (12.1) | 250 (13.8) | 241 (12.7) | 1,705 (12) |
| Cardiovascular | 93 (8.3) | 85 (8.0) | 112 (9.4) | 120 (9.8) | 132 (9.6) | 130 (9.9) | 168 (11.2) | 172 (10) | 169 (9.3) | 186 (9.8) | 1,367 (9.6) |
| Psychiatric, drug abuse, poisoning | 63 (5.6) | 69 (6.5) | 71 (6.0) | 84 (6.8) | 96 (7.0) | 105 (8.0) | 113 (7.5) | 130 (7.5) | 132 (7.3) | 140 (7.4) | 1,003 (7.1) |
| Trauma | 390 (34.7) | 397 (37.3) | 381 (32) | 442 (36) | 451 (32.9) | 459 (34.9) | 493 (32.7) | 604 (34.9) | 613 (33.9) | 608 (32) | 4,838 (34) |
| Nonspecific complaints1 | 79 (7.0) | 69 (6.5) | 90 (7.6) | 77 (6.3) | 95 (6.9) | 112 (8.5) | 216 (14.3) | 255 (14.8) | 295 (16.3) | 335 (17.7) | 1,623 (11.4) |
| Thermal injuries2 | 1 (0.1) | 1 (0.1) | 0 (0.0) | 2 (0.2) | 1 (0.1) | 1 (0.1) | 0 (0.0) | 0 (0.0) | 0 (0.0) | 0 (0.0) | 6 (0.0) |
| Other3 | 340 (30.3) | 270 (25.4) | 305 (25.6) | 279 (22.7) | 344 (25.1) | 274 (20.9) | 256 (17) | 258 (14.9) | 240 (13.3) | 266 (14) | 2,832 (19.9) |
| 1 Non-specific complaints: non-specific abdominal pain, nontraumatic pain, general condition impairment, “home care impossible” 2 Thermal injuries: burns, hypothermia, electric injuries, drowning 3 Diagnoses not listed above National Advisory Committee for Aeronautics (NACA) score: This scale is divided into 7 categories: NACA 0 (no injury), 1 (slight injury, no medical intervention required), 2 (light-to-moderately heavy injury, ambulatory medical clarification necessary), 3 (heavy, but not life-threatening injury or illness, stationary treatment necessary, and frequently also local emergency medical measures), 4 (heavy injury, for which the short-term development of a life threat cannot be excluded), 5 (acute lethal danger), 6 (resuscitation), 7 (death). | |||||||||||
| Table 2:Characteristics of ambulance interventions at home for people aged 65 years and over. | |||||||||||
| 2004 | 2005 | 2006 | 2007 | 2008 | 2009 | 2010 | 2011 | 2012 | 2013 | Total | |
| Number of ambulance interventions | 7,497 | 8,090 | 8,419 | 8,480 | 8,851 | 8,765 | 9,419 | 9,628 | 10,069 | 10,612 | 89,830 |
| Age, n (%) | |||||||||||
| 65–79 years | 2,908 (38.8) | 3,116 (38.5) | 3,273 (38.9) | 3,325 (39.2) | 3,327 (37.6) | 3,587 (40.9) | 3,783 (40.2) | 3,849 (40.0) | 4,045 (40.2) | 4,346 (41) | 35,559 (39.5) |
| 80–89 years | 3,276 (43.7) | 3,491 (43.2) | 3,676 (43.7) | 3,649 (43.0) | 3,974 (44.9) | 3,871 (44.2) | 4,187 (44.5) | 4,207 (43.7) | 4,360 (43.3) | 4,469 (42.1) | 39,160 (43.6) |
| ≥90 years | 1,313 (17.5) | 1,483 (18.3) | 1,470 (17.5) | 1,506 (17.8) | 1,550 (17.5) | 1,307 (14.9) | 1,449 (15.4) | 1,572 (16.3) | 1,664 (16.5) | 1,797 (16.9) | 15,111 (16.9) |
| Gender, n (%) | |||||||||||
| Female | 4,355 (58.1) | 4,806 (59.4) | 4,873 (57.9) | 4,907 (57.9) | 5,152 (58.3) | 5,065 (57.8) | 5,427 (57.6) | 5,459 (56.7) | 5,702 (56.6) | 6,061 (57.1) | 51,807 (57.7) |
| Male | 3,140 (41.9) | 3,283 (40.6) | 3,546 (42.1) | 3,571 (42.1) | 3,692 (41.8) | 3,694 (42.2) | 3,992 (42.4) | 4,169 (43.3) | 4,367 (43.4) | 4,551 (42.9) | 38,005 (42.3) |
| NACA score categories, n (%) | |||||||||||
| 0–3 | 6,106 (81.5) | 6,482 (80.1) | 6,832 (81.2) | 6,690 (78.9) | 7,151 (80.8) | 7,150 (81.6) | 7,728 (82.1) | 8,004 (83.1) | 8,355 (83.0) | 8,835 (83.3) | 73,333 (81.5) |
| 4–6 | 1,208 (16.1) | 1,383 (17.1) | 1,376 (16.3) | 1,569 (18.5) | 1,502 (17.0) | 1,406 (16.0) | 1,479 (15.7) | 1,426 (14.8) | 1,512 (15.0) | 1,566 (14.8) | 14,427 (16.1) |
| 7 | 183 (2.4) | 225 (2.8) | 211 (2.5) | 221 (2.6) | 198 (2.2) | 209 (2.4) | 212 (2.3) | 198 (2.1) | 202 (2.0) | 211 (2.0) | 2,070 (2.3) |
| Main reasons for intervention, n (%) | |||||||||||
| Cardiac arrest | 212 (2.8) | 244 (3.0) | 244 (2.9) | 256 (3) | 229 (2.6) | 232 (2.7) | 258 (2.7) | 241 (2.5) | 240 (2.4) | 253 (2.4) | 2,409 (2.7) |
| Coma, convulsions | 659 (8.8) | 693 (8.6) | 778 (9.2) | 865 (10.2) | 849 (9.6) | 841 (9.6) | 845 (9.0) | 843 (8.8) | 894 (8.9) | 940 (8.9) | 8,207 (9.1) |
| Respiratory distress | 752 (10.0) | 908 (11.2) | 921 (10.9) | 950 (11.2) | 909 (10.3) | 907 (10.4) | 904 (9.6) | 933 (9.7) | 981 (9.7) | 1048 (9.9) | 9,213 (10.3) |
| Cardiovascular | 1,027 (13.7) | 1,053 (13) | 1,078 (12.8) | 1,182 (13.9) | 1,087 (12.3) | 1,199 (13.7) | 1,306 (13.9) | 1,273 (13.2) | 1,316 (13.1) | 1,350 (12.7) | 11,871 (13.2) |
| Psychiatric, drug abuse, poisoning | 482 (6.4) | 523 (6.5) | 648 (7.7) | 641 (7.6) | 706 (8.0) | 669 (7.6) | 724 (7.7) | 735 (7.6) | 795 (7.9) | 783 (7.4) | 6,706 (7.5) |
| Trauma | 1,437 (19.2) | 1,539 (19) | 1,609 (19.1) | 1,613 (19) | 1,730 (19.6) | 1,727 (19.7) | 1,932 (20.5) | 1,886 (19.6) | 1,929 (19.2) | 1,967 (18.5) | 17,369 (19.3) |
| Nonspecific complaints1 | 403 (5.4) | 476 (5.9) | 526 (6.3) | 541 (6.4) | 560 (6.3) | 1,650 (18.8) | 2,312 (24.6) | 2,489 (25.9) | 2,671 (26.5) | 2,946 (27.8) | 14,574 (16.2) |
| Thermal injuries2 | 3 (0.0) | 10 (0.1) | 3 (0.0) | 12 (0.1) | 7 (0.1) | 9 (0.1) | 12 (0.1) | 11 (0.1) | 11 (0.1) | 10 (0.1) | 88 (0.1) |
| Other3 | 2,520 (33.6) | 2,642 (32.7) | 2,611 (31.0) | 2,418 (28.5) | 2,774 (31.3) | 1,531 (17.5) | 1,126 (12) | 1,217 (12.6) | 1,230 (12.2) | 1,315 (12.4) | 19,384 (21.6) |
| 1 Non-specific complaints: nonspecific abdominal pain, nontraumatic pain, general condition impairment, “home care impossible” 2 Thermal injuries: burns, hypothermia, electric injuries, drowning 3 Diagnoses not listed above National Advisory Committee for Aeronautics (NACA) score: This scale is divided into 7 categories: NACA 0 (no injury), 1 (slight injury, no medical intervention required), 2 (light-to-moderately heavy injury, ambulatory medical clarification necessary), 3 (heavy, but not life-threatening injury or illness, stationary treatment necessary, and frequently also local emergency medical measures), 4 (heavy injury, for which the short-term development of a life threat cannot be excluded), 5 (acute lethal danger), 6 (resuscitation), 7 (death). | |||||||||||
A prospective population-based register of routinely collected data for each EMS intervention in the Canton of Vaud (approximately 750,000 inhabitants), in the western part of Switzerland, was analysed for the period 2004 and 2013.
Trained nurses and paramedics coordinate prehospital EMS, from a sole dispatch centre, using specific keyword-based dispatch protocols. Ambulances with paramedics are the primary response element of the EMS. In addition, emergency physicians (EPs) may be sent on-site by ground (emergency resuscitation vehicles) or by air (rescue helicopter), particularly in life-threatening situations, such as cardiac arrest, major trauma, respiratory distress, unconsciousness or other life-threatening emergencies, or at the request of the paramedics already on site. Six emergency resuscitation vehicles are positioned in six regional hospitals around the canton and one is located in the Lausanne University hospital. They are typically dispatched to urban and suburban areas, whereas the rescue helicopter (located in the Lausanne area) is mainly dedicated to life-threatening emergencies occurring in rural and mountainous areas. None of the interventions for a NHR required a rescue helicopter.
Patients are transported either to the regional hospitals of the Canton, or to the Lausanne University Hospital, depending on the severity of the pathologies and the proximity of the hospital. The Lausanne University Hospital functions as a tertiary reference centre, as well as a primary community hospital for the Lausanne area.
Regulation data were collected and recorded in the information system of the dispatch centre. Ambulance reports comprise complementary data (date, place, timing, main reason for the intervention), evaluation of the patient on site (age, gender, severity, life-saving measures), and action undertaken (e.g. transport to the hospital, call to the EP, resuscitation, death). A set of these data was provided by the State Healthcare Authorities to the Institute of Social and Preventive Medicine for control, validation and analysis. Prehospital severity was recorded according to the National Advisory Committee for Aeronautics (NACA) scale. NACA scores of 4 or more imply potentially life-threatening injuries [15]. For EP interventions, reports contain a description of prehospital life-saving measures, procedures or interventions on site (medico-legal procedure, resuscitation with transport to the ED, on-site urgent care, clinical examination, unsuccessful resuscitation, death pronouncement), as well as the diagnosis and outcomes systematically collected at 48 hours after ED admission. The evolution of the number of NHRs in the Canton of Vaud was collected through the State healthcare statistics for the same time period. The annual numbers of patients admitted to the ED of the main hospital (Lausanne University Hospital) were also collected through the Lausanne University ED annual reports.
All ambulances or EP interventions for NHRs aged 65 years and over were analysed. Variables considered were age, gender, severity, procedures and interventions on site, 48-hour outcome and 48-hours diagnosis categories. Ambulances or EP interventions at home for patients aged 65+ years were also described.
The age-specific incidence of requests to EMS was calculated as the number of interventions per 1,000 NHRs per year. Incidence calculations were stratified by age categories (65–79, 80–89, >90). Linear trends of incidence were analysed over years. Linear regressions were performed to estimate slope parameters (95% confidence interval [CI]) of the relationship between incidence and year within age categories. In all analyses, differences were considered statistically significant at p <0.05 (two-tailed). Statistical analyses were conducted using Stata Version 13.1 (StataCorp LP, College Station, TX, USA).
| Table 3:Characteristics of emergency physician (EP) interventions for nursing home residents aged 65 years and over. | |||||||||||
| 2004 | 2005 | 2006 | 2007 | 2008 | 2009 | 2010 | 2011 | 2012 | 2013 | Total | |
| Number of EP interventions | 106 | 101 | 126 | 106 | 135 | 218 | 218 | 268 | 289 | 324 | 1,891 |
| Age, n (%) | |||||||||||
| 65–79 years | 31 (29.3) | 30 (29.7) | 31 (24.6) | 33 (31.1) | 28 (20.7) | 53 (24.3) | 63 (28.9) | 64 (23.9) | 67 (23.2) | 71 (21.9) | 471 (24.9) |
| 80–89 years | 57 (53.8) | 46 (45.5) | 68 (54.0) | 50 (47.2) | 61 (45.2) | 106 (48.6) | 105 (48.2) | 140 (52.2) | 122 (42.2) | 161 (49.7) | 916 (48.4) |
| ≥90 years | 18 (17.0) | 25 (24.8) | 27 (21.4) | 23 (21.7) | 46 (34.1) | 59 (27.1) | 50 (22.9) | 64 (23.9) | 100 (34.6) | 92 (28.4) | 504 (26.7) |
| Gender, n (%) | |||||||||||
| Female | 64 (60.4) | 60 (59.4) | 79 (63.2) | 67 (63.8) | 80 (59.3) | 141 (64.7) | 142 (65.4) | 185 (69.0) | 181 (62.6) | 202 (62.9) | 1,201 (63.7) |
| Male | 42 (39.6) | 41 (40.6) | 46 (36.8) | 38 (36.2) | 55 (40.7) | 77 (35.3) | 75 (34.6) | 83 (31.0) | 108 (37.4) | 119 (37.1) | 684 (36.3) |
| NACA score categories, n (%) | |||||||||||
| 0–3 | 38 (35.9) | 25 (24.8) | 40 (31.8) | 32 (30.2) | 27 (20.0) | 45 (20.6) | 63 (28.9) | 75 (28.0) | 87 (30.1) | 108 (33.3) | 540 (28.6) |
| 4–6 | 64 (60.4) | 71 (70.3) | 82 (65.1) | 70 (66) | 100 (74.1) | 160 (73.4) | 146 (67.0) | 177 (66.0) | 185 (64.0) | 201 (62.0) | 1,256 (66.4) |
| 7 | 4 (3.8) | 5 (5.0) | 4 (3.2) | 4 (3.8) | 8 (5.9) | 13 (6.0) | 9 (4.1) | 16 (6.0) | 17 (5.9) | 15 (4.6) | 95 (5.0) |
| Interventions and procedures, n (%) | |||||||||||
| Medico-legal1 | 0 (0.0) | 0 (0.0) | 0 (0.0) | 0 (0.0) | 0 (0.0) | 0 (0.0) | 2 (0.9) | 0 (0.0) | 1 (0.4) | 1 (0.3) | 4 (0.2) |
| Resuscitation2 | 3 (2.8) | 5 (5) | 7 (5.6) | 3 (2.8) | 10 (7.4) | 6 (2.8) | 6 (2.8) | 15 (5.6) | 8 (2.8) | 8 (2.5) | 71 (3.8) |
| Urgent care | 76 (71.7) | 67 (66.3) | 90 (71.4) | 80 (75.5) | 95 (70.4) | 153 (70.2) | 122 (56) | 141 (52.6) | 179 (61.9) | 202 (62.4) | 1,205 (63.7) |
| Clinical examination | 23 (21.7) | 24 (23.8) | 25 (19.8) | 19 (17.9) | 22 (16.3) | 47 (21.6) | 79 (36.2) | 97 (36.2) | 84 (29.1) | 98 (30.3) | 518 (27.4) |
| Unsuccessful resuscitation3 | 2 (1.9) | 2 (2.0) | 1 (0.8) | 2 (1.9) | 3 (2.2) | 7 (3.2) | 6 (2.8) | 9 (3.4) | 9 (3.1) | 6 (1.9) | 47 (2.5) |
| Death pronouncement | 2 (1.9) | 3 (3.0) | 3 (2.4) | 2 (1.9) | 5 (3.7) | 5 (2.3) | 3 (1.4) | 6 (2.2) | 8 (2.8) | 9 (2.8) | 46 (2.4) |
| 48-hour outcomes, n (%) | |||||||||||
| Death on site or during transport | 4 (3.8) | 5 (5.0) | 5 (4.0) | 4 (3.8) | 9 (6.7) | 13 (6.0) | 10 (4.6) | 16 (6.0) | 17 (5.9) | 15 (4.6) | 98 (5.2) |
| In-hospital death | 8 (7.6) | 13 (12.9) | 15 (11.9) | 8 (7.6) | 11 (8.2) | 22 (10.2) | 15 (6.9) | 20 (7.6) | 25 (8.7) | 33 (10.2) | 170 (9.1) |
| Hospitalised | 76 (62.4) | 74 (73.3) | 88 (69.8) | 79 (74.5) | 93 (69.4) | 130 (60.2) | 134 (62) | 176 (66.5) | 181 (63.3) | 205 (63.5) | 1,236 (65.9) |
| Emergency department visit and return to nursing home | 13 (12.4) | 7 (6.9) | 12 (9.5) | 13 (12.3) | 16 (11.9) | 27 (12.5) | 28 (13.0) | 26 (9.8) | 33 (11.5) | 33 (10.2) | 208 (11.1) |
| Not transported | 4 (3.8) | 2 (2.0) | 6 (4.8) | 2 (1.9) | 5 (3.7) | 24 (11.1) | 29 (13.4) | 27 (10.2) | 30 (10.5) | 37 (11.5) | 166 (8.8) |
| 48-hour diagnosis categories, n (%) | |||||||||||
| Cardiovascular | 59 (55.7) | 44 (43.6) | 72 (57.1) | 50 (47.2) | 74 (54.8) | 85 (39) | 102 (46.8) | 106 (39.6) | 110 (38.1) | 124 (38.3) | 826 (43.7) |
| Pulmonary | 17 (16) | 23 (22.8) | 16 (12.7) | 14 (13.2) | 30 (22.2) | 54 (24.8) | 35 (16.1) | 52 (19.4) | 69 (23.9) | 63 (19.4) | 373 (19.7) |
| Neurological | 10 (9.4) | 20 (19.8) | 12 (9.5) | 15 (14.2) | 8 (5.9) | 23 (10.6) | 39 (17.9) | 57 (21.3) | 41 (14.2) | 66 (20.4) | 291 (15.4) |
| Others | 11 (10.4) | 8 (7.9) | 13 (10.3) | 17 (16) | 18 (13.3) | 39 (17.9) | 33 (15.1) | 35 (13.1) | 42 (14.5) | 52 (16.1) | 268 (14.2) |
| Drug or alcohol abuse, poisoning | 2 (1.9) | 0 (0.0) | 2 (1.6) | 3 (2.8) | 1 (0.7) | 5 (2.3) | 2 (0.9) | 2 (0.8) | 5 (1.7) | 2 (0.6) | 24 (1.3) |
| Psychiatry | 0 (0.0) | 0 (0.0) | 0 (0.0) | 0 (0.0) | 0 (0.0) | 1 (0.5) | 2 (0.9) | 0 (0.0) | 5 (1.7) | 1 (0.3) | 9 (0.5) |
| Trauma | 7 (6.6) | 6 (5.9) | 11 (8.7) | 7 (6.6) | 4 (3) | 11 (5.1) | 5 (2.3) | 16 (6) | 17 (5.9) | 16 (4.9) | 100 (5.3) |
| 1 Refusal of care, severe agitation 2 Cardiac resuscitation or life support procedure (airway management, ventilation) with transport of the patient 3 Unsuccessful resuscitation, no transport National Advisory Committee for Aeronautics (NACA) score: This scale is divided into 7 categories: NACA 0 (no injury), 1 (slight injury, no medical intervention required), 2 (light-to-moderately heavy injury, ambulatory medical clarification necessary), 3 (heavy, but not life-threatening injury or illness, stationary treatment necessary, and frequently also local emergency medical measures), 4 (heavy injury, for which the short-term development of a life threat cannot be excluded), 5 (acute lethal danger), 6 (resuscitation), 7 (death). | |||||||||||
Between 2004 and 2013, the overall population of the Canton of Vaud increased from 644,097 to 743,317 inhabitants (+15.4%) and the nursing home population increased from 5,977 to 6,560 residents (+9.7%). During the same period, the number of patients admitted to the ED of the main hospital (Lausanne university hospital) increased by 19.4% (from 30,702 to 36,661).
Figure 1
Evolution of the annual incidence of requests to ambulance or emergency physicians(EPs) per 1,000 nursing home residents in the Canton of Vaud, by age category.
Between 2004 and 2013, the number of prehospital EMS ambulance interventions for NHRs aged 65 years and over increased by 68.9% (from 1,124 to 1,898; table 1). The number of ambulance interventions at home for patients aged 65 years and over increased simultaneously by 41.5 % (from 7,497 to 10,612; table 2).
Prehospital EP interventions for NHRs aged 65 years and over increased by 205.6% (from 106 to 324; table 3). The annual proportion of ambulance interventions simultaneously requiring an EP increased from 9.4% to 17.1%. In comparison, the total number of prehospital EP interventions at home for patients aged 65 years and over increase marginally by 17.9 % (from 1,779 to 2,097) during the same period (table 4).
The increase of EP interventions for NHRs resulted from a global increase of 2% to 7% of total EP interventions in the Canton de Vaud.
An increasing trend in incidence of requests to an ambulance was observed for NHRs of all categories of age (table 5). This annual linear increase in incidence per 1,000 NHRs was significant for all age categories (table 5), and was particularly noticeable for NHRs aged 80–89 years (16.5, 95% CI 14.0–19.0). A concomitant and similar significant linear increase in the incidence of requests to an EP was observed to a lesser degree for all age categories (fig. 1).
NHRs requiring an ambulance or an EP were mostly women (68.5%). The main reasons for ambulance interventions were related to trauma (34.0%), respiratory distress (12.0%), nonspecific complaints (11.4%) and cardiovascular problems (9.6%). Compared with ambulance interventions at home for people aged 65+, this repartition exhibited an over-representation of trauma (19.3% vs 34.0%). Prehospital severity scores, according to the NACA scale, were stable over the period, with 14.2% of the NHRs exhibiting a life-threatening condition (NACA score >= 4, table 1).
For NHRs requiring an EP, the most frequent medical interventions were described as urgent care in 63.7% and as clinical examination only in 27.4%. Resuscitation or advanced life support procedures occurred in 3.8%. These results were similar for patients over 65 years requiring an EP at home, except for a higher proportion of resuscitation procedures (5.3%) related to cardiac arrests. At 48 hours, 65.9% of the NHRs requiring an EP were admitted to a hospital and only 11.1% returned to the nursing home after the ED. The diagnosis categories collected at 48 hours after ED admission were mainly related to cardiovascular (43.7%), pulmonary (19.7%) and neurological problems (15.4%). Compared to EP interventions at home for people aged 65+, NHRs requiring an EP were older, exhibited more severe NACA scores and more frequently had pulmonary or neurological problems. The global mortality over the period (on site, during transport and in hospital) was 14.3%, with a trend toward a non-significant increase over the period. This mortality rate was similar for patients requiring an EP at home (14.8%).
| Table 4:Characteristics of emergency physician (EP) interventions at home for people aged 65 years and over. | |||||||||||
| 2004 | 2005 | 2006 | 2007 | 2008 | 2009 | 2010 | 2011 | 2012 | 2013 | Total | |
| Number of EP interventions | 1,779 | 1,837 | 1,867 | 1,938 | 1,744 | 1,692 | 1,912 | 1,925 | 2,000 | 2,097 | 18,791 |
| Age, n (%) | |||||||||||
| 65–79 | 891 (50.1) | 922 (50.2) | 923 (49.4) | 979 (50.5) | 843 (48.3) | 850 (50.2) | 950 (49.7) | 940 (48.8) | 978 (48.9) | 1,055 (50.3) | 9,331 (49.7) |
| 80–89 | 691 (38.8) | 727 (39.6) | 739 (39.6) | 746 (38.5) | 708 (40.6) | 666 (39.4) | 771 (40.3) | 772 (40.1) | 782 (39.1) | 807 (38.5) | 7,409 (39.4) |
| ≥90 | 197 (11.1) | 188 (10.2) | 205 (11.0) | 213 (11.0) | 193 (11.1) | 176 (10.4) | 191 (10.0) | 213 (11.1) | 240 (12.0) | 235 (11.2) | 2,051 (10.9) |
| Gender, n (%) | |||||||||||
| Female | 869 (48.9) | 934 (50.9) | 936 (50.2) | 958 (49.7) | 890 (51.1) | 815 (48.2) | 939 (49.3) | 939 (48.8) | 1,038 (51.9) | 1,008 (48.1) | 9,326 (49.7) |
| Male | 909 (51.1) | 901 (49.1) | 927 (49.8) | 971 (50.3) | 853 (48.9) | 875 (51.8) | 967 (50.7) | 985 (51.2) | 961 (48.1) | 1,086 (51.9) | 9,435 (50.3) |
| NACA score categories, n (%) | |||||||||||
| 0–3 | 767 (43.1) | 744 (40.5) | 768 (41.1) | 716 (37.0) | 627 (36.0) | 612 (36.2) | 664 (34.7) | 779 (40.5) | 789 (39.5) | 815 (38.9) | 7,281 (38.8) |
| 4–6 | 842 (47.3) | 901 (49.1) | 913 (48.9) | 1040 (53.7) | 951 (54.5) | 899 (53.1) | 1061 (55.5) | 982 (51.0) | 1,040 (52.0) | 1,099 (52.4) | 9,728 (51.8) |
| 7 | 170 (9.6) | 192 (10.5) | 186 (10.0) | 182 (9.4) | 166 (9.5) | 181 (10.7) | 187 (9.8) | 164 (8.5) | 171 (8.6) | 183 (8.7) | 1,782 (9.5) |
| Interventions and procedures, n (%) | |||||||||||
| Medico-legal1 | 2 (0.1) | 7 (0.4) | 7 (0.4) | 4 (0.2) | 14 (0.8) | 12 (0.7) | 16 (0.8) | 11 (0.6) | 14 (0.7) | 17 (0.8) | 104 (0.6) |
| Resuscitation2 | 53 (3.0) | 69 (3.8) | 72 (3.9) | 66 (3.4) | 69 (4.0) | 51 (3.0) | 78 (4.1) | 85 (4.4) | 73 (3.7) | 68 (3.2) | 684 (3.7) |
| Urgent care | 1,247 (70.1) | 1,270 (69.2) | 1,190 (63.7) | 1,378 (71.1) | 1,134 (65.3) | 1,089 (64.6) | 1,144 (60) | 1,149 (60.0) | 1,187 (59.5) | 1,211 (57.8) | 11,999 (64.0) |
| Clinical examination | 307 (17.3) | 300 (16.3) | 414 (22.2) | 311 (16.1) | 359 (20.7) | 353 (20.9) | 486 (25.5) | 508 (26.5) | 549 (27.5) | 618 (29.5) | 4,205 (22.4) |
| Unsuccessful resuscitation3 | 83 (4.7) | 108 (5.9) | 93 (5.0) | 93 (4.8) | 80 (4.6) | 99 (5.9) | 109 (5.7) | 99 (5.2) | 111 (5.6) | 125 (6.0) | 1,000 (5.3) |
| Death pronouncement | 86 (4.8) | 82 (4.5) | 91 (4.9) | 86 (4.4) | 80 (4.6) | 83 (4.9) | 75 (3.9) | 64 (3.3) | 61 (3.1) | 58 (2.8) | 766 (4.1) |
| 48-hour outcomes, n(%) | |||||||||||
| Death on site or during transport | 172 (9.7) | 191 (10.4) | 186 (10.0) | 182 (9.4) | 164 (9.5) | 182 (10.9) | 185 (9.8) | 165 (8.6) | 172 (8.6) | 183 (8.7) | 1,782 (9.5) |
| In-hospital death | 87 (4.9) | 90 (4.9) | 93 (5.0) | 97 (5.0) | 106 (6.2) | 82 (4.9) | 101 (5.3) | 97 (5.1) | 94 (4.7) | 135 (6.4) | 982 (5.3) |
| Hospitalised | 1,141 (64.2) | 1,196 (65.3) | 1,163 (62.5) | 1,272 (65.8) | 1,083 (63.0) | 1,020 (60.8) | 1,155 (61.0) | 1,245 (65.1) | 1,284 (64.4) | 1,340 (63.9) | 11,900 (63.6) |
| Emergency department visit and return to nursing home | 335 (18.9) | 314 (17.1) | 374 (20.1) | 354 (18.3) | 303 (17.6) | 207 (12.3) | 246 (13) | 199 (10.4) | 224 (11.2) | 244 (11.6) | 2,800 (15) |
| Not transported | 41 (2.3) | 41 (2.2) | 47 (2.5) | 30 (1.6) | 63 (3.7) | 187 (11.1) | 207 (10.9) | 205 (10.7) | 218 (10.9) | 195 (9.3) | 1,234 (6.6) |
| 48-hour diagnosis categories, n (%) | |||||||||||
| Cardiovascular | 1,071 (60.3) | 1,073 (58.4) | 1,085 (58.2) | 1,127 (58.2) | 997 (57.3) | 969 (57.4) | 1,029 (53.8) | 1,021 (53) | 992 (49.6) | 1,069 (51) | 10,433 (55.6) |
| Pulmonary | 224 (12.6) | 249 (13.6) | 271 (14.5) | 258 (13.3) | 227 (13.1) | 236 (14) | 247 (12.9) | 253 (13.1) | 258 (12.9) | 304 (14.5) | 2,527 (13.5) |
| Neurological | 160 (9.0) | 131 (7.1) | 154 (8.3) | 168 (8.7) | 169 (9.7) | 157 (9.3) | 247 (12.9) | 313 (16.3) | 335 (16.8) | 335 (16.0) | 2,169 (11.6) |
| Others | 191 (10.8) | 237 (13.0) | 241 (12.9) | 248 (12.8) | 227 (13.1) | 224 (13.3) | 250 (13.1) | 217 (11.3) | 252 (12.7) | 232 (11.1) | 2,319 (12.3) |
| Drug or alcohol abuse, poisoning | 23 (1.3) | 25 (1.4) | 32 (1.7) | 25 (1.3) | 24 (1.4) | 21 (1.2) | 34 (1.8) | 28 (1.5) | 31 (1.6) | 37 (1.8) | 280 (1.5) |
| Psychiatry | 16 (0.9) | 13 (0.7) | 7 (0.4) | 14 (0.7) | 14 (0.8) | 22 (1.3) | 28 (1.5) | 15 (0.8) | 26 (1.3) | 25 (1.2) | 180 (1.0) |
| Trauma | 92 (5.2) | 106 (5.8) | 75 (4.0) | 98 (5.1) | 80 (4.6) | 60 (3.6) | 77 (4.0) | 78 (4.1) | 106 (5.3) | 95 (4.5) | 867 (4.6) |
| 1 Refusal of care, severe agitation 2 Cardiac resuscitation or life support procedure (airway management, ventilation) with transport of the patient 3 Unsuccessful resuscitation, no transport National Advisory Committee for Aeronautics (NACA) score: This scale is divided into 7 categories: NACA 0 (no injury), 1 (slight injury, no medical intervention required), 2 (light-to-moderately heavy injury, ambulatory medical clarification necessary), 3 (heavy, but not life-threatening injury or illness, stationary treatment necessary, and frequently also local emergency medical measures), 4 (heavy injury, for which the short-term development of a life threat cannot be excluded), 5 (acute lethal danger), 6 (resuscitation), 7 (death). | |||||||||||
| Table 5:Age-specific annual linear changes in incidence of requests to ambulance or emergency physicians. | |||||
| Age-specific incidence of requests/1,000 nursing home residents | |||||
| In 2004 | In 2013 | Annual changes (95% confidence interval) | p-value | R-squared | |
| Ambulance | |||||
| 65–79 years | 196.0 | 279.4 | 10.2 (6.3–14.2) | <0.001 | 0.81 |
| 80–89 years | 190.7 | 338.6 | 16.5 (14.0–19.0) | <0.001 | 0.97 |
| ≥90 years | 242.2 | 328.4 | 12.1 (5.8–18.4) | 0.002 | 0.71 |
| Emergency physician | |||||
| 65–79 years | 27.2 | 55.0 | 4.0 (2.4–5.6) | <0.001 | 0.81 |
| 80–89 years | 22.2 | 60.8 | 4.4 (2.7–6.0) | <0.001 | 0.82 |
| ≥90 years | 10.6 | 47.1 | 4.5 (3.1–5.9) | <0.001 | 0.87 |
This study revealed an important, significant and sustained increase in the incidence of ambulance interventions (+68.9%) and EP interventions (+205%) in nursing homes during the last ten years in the Swiss Canton of Vaud. These increases were disproportionate in comparison with the actual increase in the nursing home population between 2004 and 2013 (+9.7%) and far exceed the increase of the overall prehospital EMS activity for elderly patients during the period. To the best of our knowledge, this is the first study to report such results overt a 10-year period in a European country.
What could be the reasons that may explain such a trend? The increase in the number of NHRs requiring an EMS intervention could reflect a mixed effect of changes in residents’ characteristics, nursing home staff care delivery, as well as a possible correction of prior EMS underuse, promoted by the recent public education campaigns about stroke, cardiac arrest and myocardial infarction. On the other hand, increasing EMS intervention rates could reflect a progressively increasing severity of the medical condition of NHRs, but in our study, mortality rates and severity scores remained stable over the period, except for slight variations.
The progressive unavailability of on-duty primary care practitioners is also a potential explanation, promoting the use of ambulances to transport the patients to the ED, as an alternative to a primary care practitioner evaluation [9]. Another possible explanation could be a change in medical decision processes, arguing for rapid triage decisions that can be taken within the hospital only, such as for cardiac, neurological or respiratory emergencies [12]. An increasing fear of medical errors and possible litigation may be another incentive for nursing home staff to call EMS when facing an urgent situation.
Whatever the reason, in order to face this increase of interventions in nursing homes, the EMS should be able adequately to evaluate, treat and orientate NHRs. The current study does not allow determination of the proportion of prehospital interventions and subsequent transfers to the hospital that may be judged appropriate. Nevertheless, these results suggest that dedicated interventions are required to prevent potentially unnecessary transfers to the ED [6].
This potential new role assigned to EMS professionals is, however, problematic in the context of the current limited training and competence of these healthcare providers towards the population of NHRs. The knowledge and skills required of the EMS professionals to adapt to this challenge should thus encompass both clinical and ethical competencies. They include triage and orientation skills, decision-making capabilities – supported by non-transport guidelines, initiation of treatments in the nursing home and respect for patient’s autonomy – and the capacity to avoid unnecessary transfers to the ED [16]. In the context of limited healthcare resources, this may coincide with an ethical and cost-effective vision.
Reported experiences acknowledge the need for such models, with different versions according to the available resources and to the particularities of the EMS [17]. The involvement of paramedics or nurses as primary care practitioners has been demonstrated to be an effective alternative to the classical general practitioner model to handle emergency situations in the community [17, 18]. The use of a decision-making support system with clinical criteria may improve the direction of patients to an optimal level of care within the healthcare system [19]. In a physician-based EMS model, staffed with experienced EPs, the resources allow likewise evaluation of the ethical stakes and triage of the patients. They can act as a substitute for the general practitioners, providing that all medical information about the patient is easily available, allowing adequate treatment of the patients without requiring their transfer to hospital [13, 20].
The limitations of our analysis include the use of routinely collected data prone to measurement errors, although the mere count of interventions is accurate. The specific and local context of this study (Swiss region, two-tiered EMS with both paramedics and physicians) restricts extrapolation of the results to other EMS systems. In addition, our analysis did not allow appraisal of the various reasons that may have contributed to the evolution of EMS involvement in the emergency care of nursing home residents.
Strengths are the large sample included, as well as the duration of the study, which allows an accurate analysis of the evolution and trends over a ten-year period.
In conclusion, owing to population ageing, changes in societal values and expectations regarding life-threatening and acute situations, in the context of limited resources, overcrowding of EDs and the relative unavailability of general practitioners, we definitely need to revise EMS paradigms [6, 9]. We should move from the classical concept of the “survival chain”, conceptualised to provide rapid transport to hospital, to a patient-centred approach, using EMS resources to manage and triage patients adequately, and to prevent unnecessary ED admissions [21]. This prehospital response to the increased need of medical care for NHRs emphasises the necessity for further analysis; this is a prerequisite for a new redefinition of the roles and competences of prehospital emergency caregivers.
Acknowledgement:We thank Marjan Timmer for proofreading the manuscript.
1 Demographic change in the Euro Area: projections and consequences. In: Monthly Bulletin, European Central Bank (ECB). Frankfurt am Main: European Central Bank, 2006; pp 49–64.
2 Roberts DC, McKay MP, Shaffer A. Increasing rates of emergency department visits for elderly patients in the United States, 1993 to 2003. Ann Emerg Med. 2008;51:769–74.
3 Vilpert S, Jaccard-Ruedin H, Trueb L, Monod-Zorzi S, Yersin B, Büla C. Emergency department use by oldest-old patients from 2005 to 2010 in a Swiss University hospital. BMC Health Serv Res. 2013;13:344.
4 Conroy S, Van der Cammen T, Schols J, Van Balen R, Peteroff P, Luxton T. Medical services for older people in nursing homes – comparing service in England and the Netherlands. J Nutr Health Aging. 2009;13:559–63.
5 NHS England Analytical Service. Improving general practice – a call to action. NHS England August 2013/14.
6 Wang HE, Shah M, Allman RM, Kilgore M. Emergency department visits by nursing home residents in the United States. J Am Geriatr Soc. 2011;59:1864–72.
7 Falconer M, O’Neill D. Profiling disability within nursing homes: a census-based approach. Age Ageing. 2007;36:209–13.
8 Arendts G, Reibel T, Codde J, Frankel J. Can transfers from residential aged care facilities to the Emergency Department be avoided through improved primary care services? Data from qualitative interviews. Austral J Ageing. 2010;29:61–5.
9 Frank C, Seguin R, Haber S, Godwin M, Stewart GI. Medical directors of long-term care facilities. Preventing another physician shortage? Can Fam Physician. 2006;52:752–3.
10 Lowthian JA, Cameron PA, Stoelwinder JU, Curtis A, Currel A, Cooke MW, McNeil JJ. Increasing utilization of emergency ambulances. Austral Health Rev. 2011;35:63–9.
11 Zakariassen E, Burman RA, Hunskaar S. The epidemiology of medical emergency contacts outside hospitals in Norway – a prospective population based study. Scand J Trauma Resusc Emerg Med. 2010;18:9.
12 Platts-Mills TF, Leacock B, Cabanas JG, Shofer FS, McLean SA. Emergency medical services use by the elderly: analysis of a statewide database. Prehosp Emerg Med. 2010;14:329–33.
13 Josseaum J, Duchateau FX, Burnod A, Pariente D, Beaune S, Leroy C, et al. Observatory of the elderly over 80 years supported by the mobile emergency and resuscitation service. Ann Fr Anesth Reanim. 2011;30:553–8. Article in French
14 Pittet V, Burnand B, Yersin B, Carron P-N. Trends of pre-hospital emergency medical services activity over 10 years: a population-based registry analysis. BMC health services research. 2014;14(1):380.
15 Weiss M, Bernoulli L, Zollinger A. The NACA scale. Construct and predictive validity of the NACA scale for prehospital severity rating in trauma patients. Der Anaesthesist. 2001;50(3):150–4. German.
16 Deasy C, Bray JE, Smith K, Harris LR, Bernard SA, Davidson PM, et al. Resuscitation of out-of-hospital cardiac arrests in residential aged care facilities in Melbourne, Australia. Resuscitation. 2012;83:58–62.
17 Melby V, Ryan A. Caring for older people in prehospital emergency care: can nurses make a difference. J Clin Nursing. 2005;14:1141–50.
18 Mason S, Knowles E, Colwell B, Dixon S, Wardrope J, Gorringe R, et al. Effectiveness of paramedic practitioners in attending 999 calls from elderly people in the community: cluster randomized controlled trial. BMJ. 2007;335:919.
19 Vicente V, Sjöstrand F, Sundström BW, Svensson L, Castren M. Developing a decision support system for geriatric patients in prehospital care. Eur J Emerg Med. 2013;20:240–7.
20 Leroy C, Ricard-Hibon A, Chollet C, Marty J. Out-of-hospital management of elderly patients. Ann Fr Anesth Reanim. 2003;22:183–8. French.
21 Simpson PM, Bendall JC, Patterson J, Tiedemann, Middleton PM, Close J. Epidemiology of ambulance responses to older people who have fallen in New South Wales, Australia. Austral J Ageing. 2013;32:171–6.
Funding / potential competing interests: Carron PN is the medical director of the main public state’s ambulance company (Lausanne ambulance service). The Healthcare authorities of the Canton of Vaud gave him a mandate to analyse and design the structure of the future prehospital emergency medical services. This manuscript represents the opinion of all authors.