DOI: https://doi.org/10.4414/smw.2014.14090
List of abbreviations
GCS Glasgow coma scale
G-DRG German diagnosis related groups
ICC Intraclass correlation coefficient
ICU Intensive care unit
IQR Inter-quartile range
NEMS Nine equivalents of nursing manpower use score
PDMS Patient data management system
SAPS II Simplified acute physiology score II
SAPS III Simplified acute physiology score III
SD Standard deviation
SOFA Sequential Organ Failure Assessment
SwissDRG Swiss diagnosis related groups
The simplified acute physiology score II (SAPS II) has been used for many years for clinical research and quality measurements in European intensive care units (ICUs) [1–3]. Its original goal was to provide an estimated risk of hospital mortality for the patients admitted to the ICU, which was based on given characteristics, selected from a large sample of medical and surgical cases and assessed with logistic regression analyses [4]. The score is assigned 24 hours after admission in the ICU and ranges from 0 to 163 points, based on age, type of admission, presence of specified chronic diseases and the worst observed value of a total of 12 clinical items connected with organ function [4, 5].
It is likely that it is still the most commonly utilised severity adjustment tool for research in Europe even though a newer severity score has been developed (SAPS III) [6, 7]. Moreover, the SAPS II is used to calculate the degree of hospital reimbursement for intensive care unit patients in Germany (G-DRG) and Switzerland (SwissDRG) [8, 9]. The SAPS II is also a key process indicator of the Swiss ICU Minimal Dataset, a quality assurance monitoring tool that is mandatory for all certified ICUs in Switzerland [10].
The vast majority of information on severity scores was generated in a research setting and is based on values that were recorded by specifically trained personnel. Few data are available on the quality of the assessed SAPS II as it is used in the ICUs [11–13]. A small, retrospective, multicentre audit conducted in Southern Switzerland showed that the accuracy of the SAPS II scores, assessed by intensive care nurses, is rather poor [14]. However, it is unknown whether such results can be confirmed in a larger sample of ICU healthcare providers with different professional and cultural backgrounds. Moreover, the process of scoring may be influenced by the different organisations or structures in the ICU.
The primary aim of this nationwide survey was to investigate the reliability and the accuracy of the caregiver-recorded SAPS II scores by estimating the difference between them and the reference values established by five study authors. As a secondary aim, we explored the potential link between any bias and both the ICU and staff characteristics.
This study was based on online, self-administered questionnaires addressed to ICU head physicians and ICU bedside personnel. Two steps of data collection, as outlined below, were carried out between April and June 2012.
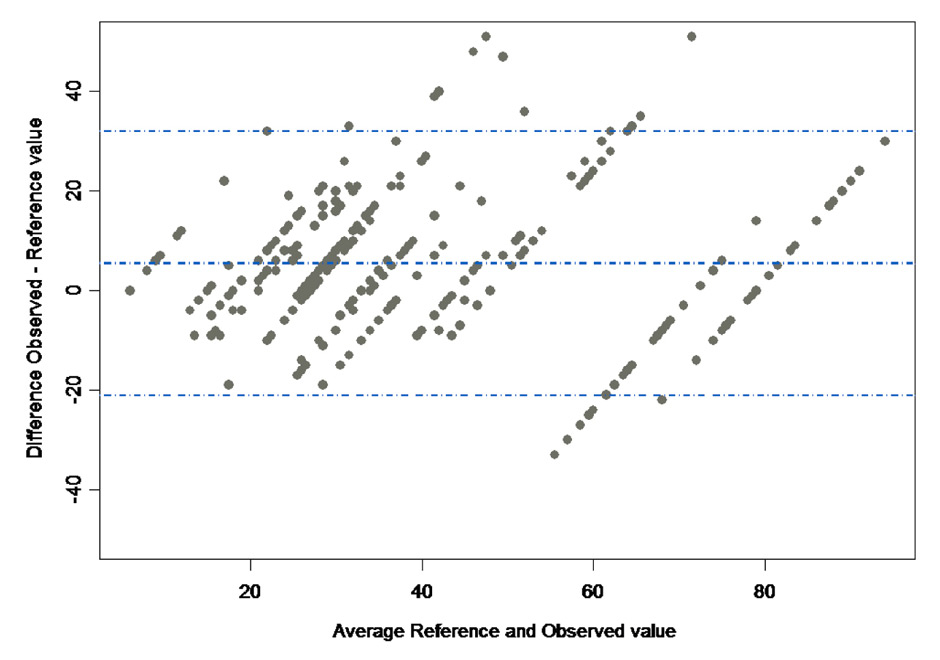
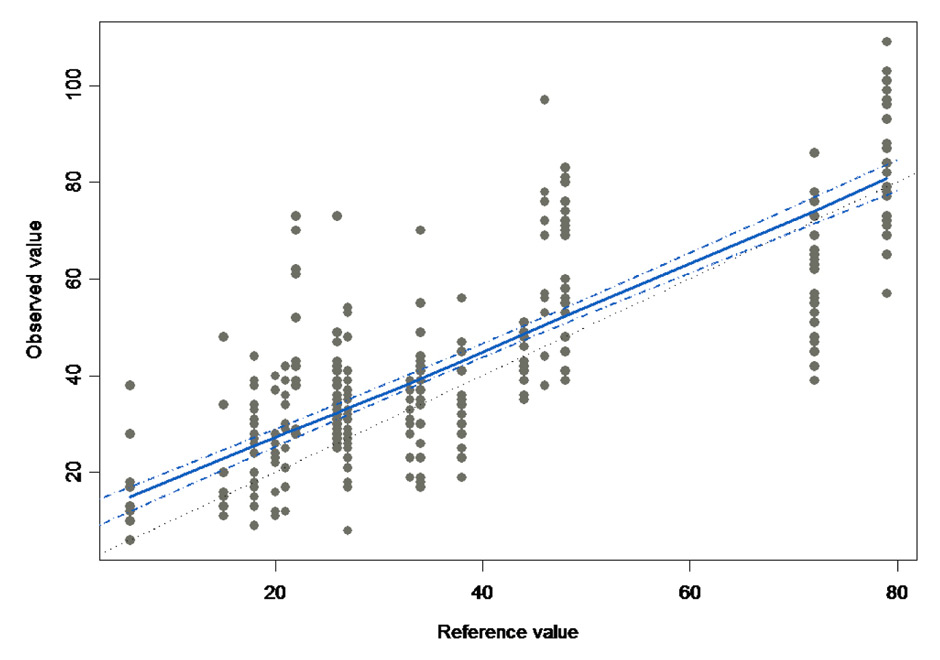
Figure 1
ARelationship between the rater assessed SAPS II scores and the reference value. The dots stand for every observation made, i.e. the score given by every participant (y-value) versus the reference value (x-value). The 16 vertical grouped values stand for the reference values of the 20 cases that have been assessed by the participants (some cases had the identical SAPS II reference score). The continuous line was fitted with a linear mixed effect after model selection. The dotted lines denote the 95% confidence interval around the fitted line.
B Bland-Altman plot showing the relationship between the difference between observed and reference values and the average of reference and observed values. The dotted lines show the mean difference ±1.96 standard deviation.
In a first survey the heads of certified adult Swiss ICUs were invited to complete an online questionnaire that was available in three national languages (German, French, and Italian). The 36 items on the questionnaires included questions on the socio-demographics and professional qualifications (6 items), the ICU structure and organisation (7 items), the SAPS II scoring procedures and training for SAPS II scoring (23 items).
In a second phase, staff who are usually involved in SAPS II scoring were encouraged by the heads of the ICUs to participate in the SAPS II scoring online survey. If they agreed, they received a link to access the survey with a 6-digit key code, known only by the statistician in charge of the analysis, which would allow matching with the centres. An online questionnaire, including 11 items (two socio-demographic items, four items about qualifications and SAPS II training, and five items about SAPS II scoring procedures) was followed by one (out of 20) randomly selected clinical scenario that the participant scored with the SAPS II. Every scenario described a hypothetical patient, with the reasons for admission to the ICU (Supplementary file 1) and included charts with vital parameters, laboratory values, ventilation details and administered medication. The scenarios were designed to depict clinical situations and sequences of events that are commonly observed in a Swiss adult ICU as well as to cover a large range of SAPS II scores. The reference values of every scenario were established by five different study authors, who assigned the score separately. Differences were discussed until consensus on the 15 items and sum-score was reached.
Caregivers from centres where the SAPS II score was recorded based on values supplied by a patient data management system (PDMS) were also given a randomly selected scenario, but this was presented with a specific digital layout using either Centricity Critical Care (Version 7.0 SP3, General Electric Healthcare, Barrington, IL, USA) or MetaVision (Version 5.46.44, iMDSoft, Needham, MA, USA). The aim was to offer the participants the same system that they used in their current clinical practice. Participants were encouraged to handle their cases as usual and without external support.
For every ICU, the following key indicators related to structure were retrieved from the national ICU Minimal Dataset: average SAPS II, number of beds per unit and number of patients per year.
The objectives and design of this quality assurance study were presented to the Executive Committee of the Swiss Society of Intensive Care Medicine, who endorsed the project. The anonymity of the participating caregivers and data safety were ensured. The Cantonal Ethics Committee Ticino (6500 Bellinzona, Switzerland) approved the protocol and waived the need for informed consent.
Previous studies reported an intra-class correlation coefficient (ICC) of 0.8–0.9 for the SAPS II sum-score [11, 14, 15]. Considering an ICC (as a measure of reliability) of 0.7 as the lowest acceptable threshold, and aiming at an ICC of 0.85 (middle of the “average – good” range), a sample size of 20 clinical scenarios that were each assessed 10 times was deemed necessary for detecting the difference between 0.7 and 0.85 with a power of 80% and a Type I error rate of 0.05 [16].
Weighted kappa values were used to establish reliability between measures for the SAPS II items (categorical measures) [17, 18], and the intraclass correlation coefficient (ICC) for the SAPS II Score (continuous measure) [19, 20]. The proportion of rater agreement, as a measure of accuracy, was calculated comparing each rater against the reference value. Linear mixed effect models (the clinical scenarios were taken as random effects) were used to investigate the potential links between the bias (i.e. the difference between the observed value and the reference value) and several structural and individual covariates using a forward selection (log-likelihood ratio test; see list in Supplementary file 2). A Bland and Altman plot was used to visualise the bias and limits of agreement between the SAPS II sum scores [21]. Weighted hospital mortality was calculated based on the original equation [4]. Additional quality control checks of the results for the clinical scenarios to rule out imbalances due to translation included an analysis of variance of the SAPS sum-scores between the linguistic regions.
Continuous variables were expressed as the mean ± standard deviation (SD), unless otherwise specified, or the median with an inter-quartile range (IQR) for highly asymmetric data. Categorical variables were presented with the number of observations and percentage. A result associated with a p-value lower than 0.05 was considered significant.
An independent statistician carried out the data management and the statistical analyses. Data collection was performed via SurveyMonkey®, Palo Alto, CA, USA. All analyses were performed with TIBCO Spotfire S+® 8.1 for Windows, TIBCO Software Inc., Palo Alto, CA, USA.
| Table 1: Characteristics of the study participants scoring the SAPS II. | ||
| Characteristic | Categories | Scoring participants (n = 345, 53 ICUs) |
| Age | ≤45 years | 273 (79%) |
| 46–55 years | 60 (17%) | |
| ≥56 years | 11 (3%) | |
| Linguistic region of ICU | German | 210 (61%) |
| French | 56 (16%) | |
| Italian | 79 (23%) | |
| Gender | Male | 161 (47%) |
| Female | 183 (53%) | |
| Position – Qualification | Consultant | 81 (23%) |
| Resident physician | 137 (40%) | |
| RN with certificate for critical care nursing | 93 (27%) | |
| Other | 33 (10%) | |
| Experience with the SAPS II | ≤3 months | 63 (18%) |
| >3, ≤12 months | 70 (20%) | |
| >12 months | 207 (60%) | |
| Frequency of the SAPS II scoring | On daily basis | 144 (42%) |
| At least once per week | 111 (32%) | |
| Less than once per week | 84 (24%) | |
| Data in n (%). RN = registered nurse. Missing values: Age 1; Linguistic region 0; Gender 1; Position-Qualification 1; Experience with the SAPS II 5; Frequency of the SAPS II scoring 6. | ||
| Table 2:Reliability across the authors for the single items of the SAPS II score. | |||
| Item | Kappaa | Mean agreementb | Perfect agreementc |
| Heart rate | 0.544 | 80% | 45% |
| Systolic blood pressure | 0.683 | 89% | 65% |
| Temperature | 0.767 | 96% | 80% |
| Oxygenation | 0.699 | 87% | 65% |
| Urinary output | 0.782 | 96% | 80% |
| Urea | 0.812 | 85% | 90% |
| Leucocytes | 0.836 | 96% | 85% |
| Potassium | 0.763 | 97% | 90% |
| Sodium | 0.543 | 94% | 75% |
| Bicarbonate | 0.671 | 91% | 70% |
| Bilirubin | 1.000 | 100% | 100% |
| Glasgow Coma Scale | 0.583 | 90% | 70% |
| Age | 0.900 | 96% | 85% |
| Chronic diseases | 0.789 | 96% | 85% |
| Type of admission | 0.877 | 96% | 80% |
| a Weighted Fleiss' Kappa. b Mean proportion of agreement among the 5 authors versus the reference value. c Percentage of total agreement among the 5 authors versus the reference value. | |||
In 2011, the 78 eligible adult ICUs recognised by the Swiss Society of Intensive Care [22] recorded a mean SAPS II score of 30 ± 17. Among all contacted units, 63 (81%) gave their approval for participation in the heads of ICU survey. The participants were 46 to 55 years old in 63% of cases, younger in 16% and older in 21%, respectively. The linguistic regions were represented as follows: 45 participants (71%) from the German part, 14 (23%) from the French region and 4 (6%) from the Italian speaking part of Switzerland. A “reminder” for the SAPS II scoring was available in 87% of the ICUs, which was activated at the 24-hour deadline (16%), the next day (22%) or later (62%). Approximately 68% of the ICUs had a quality control system, but a vast majority of the ICUs (87%) had never had an audit for the SAPS II scoring quality.
A total of 345 participants from 53 ICUs completed the SAPS II evaluation of one clinical scenario (table 1). They were mostly women and most of them worked as physicians (German: 91%; French: 41%; and Italian: 6%; p <0.001). Around two-thirds of the responders (63%) were trained by a colleague, one-third was trained by their manager, only 5% received structured training, and 12% learned from a manual (multiple responses were allowed). Overall, there were 116 participants from intensive care units equipped with a PDMS.
The twenty clinical scenarios were assessed by five study authors. The mean SAPS II score was 35 ± 21, and the minimum-maximum (median) was 6–79 (27). The agreement for the sum scores among the five authors was excellent (ICC = 0.941). Table 2 shows the authors’ reliability for the single items assessed.
Every clinical scenario was assessed between 10 and 26 times (Supplementary file 1 http://www.smw.ch/content/SMW_14090_Supplementary_file_1.pdf ). Among the 345 responders, the average SAPS II score was 42.56 ± 23.38, with an ICC of 0.79, a bias of +5.74 (95%CI 2.00 to 9.48) compared to the reference values (Supplementary file 3 http://www.smw.ch/content/SMW_14090_Supplementary_file_3.pdf ) and no evidence of variation according to the case severity (p = 0.195; fig. 1). The (weighted) mean predicted mortality was 33.4 ± 33.0% against 27.1 ± 31.6% of the reference value (p = 0.011, difference = 6.3% ± 20%). There was no evidence of association between the bias and the ICU size and other structural or organisational ICU features (table 3). Similar results were found for the demographic characteristics of the participants (table 4), type of initial SAPS II training (p = 0.164), and the method used for scoring (p = 0.759).
Only 7.8% (27/345) of rated cases matched the reference value for each item. Bilirubin, temperature and chronic disease were the most accurately scored items (93%, 93%, and 91%, respectively), whereas the lowest agreement was found for urinary output and the Glasgow Coma Scale(63% and 64%). The mean weighted kappa was 0.47 with best values for age (0.77) and lowest for urinary output and sodium (0.20 and 0.28, Supplementary file 4 http://www.smw.ch/content/SMW_14090_Supplementary_file_4.pdf ).
| Table 3: Relationship between the scoring bias (scored vs reference sum scores) and structural ICU data. | |||
| Characteristic | Categories | Bias | p-valuea |
| Mean annual SAPS II in 2011 (points) | ≤29 | 5.0 ± 12.9 | 0.431 |
| >29 and ≤32 | 5.1 ± 13.5 | ||
| >32 | 6.6 ± 14.6 | ||
| Number of beds per unit | ≤8 | 5.6 ± 13.5 | 0.884 |
| 9–15 | 6.5 ± 13.9 | ||
| >15 | 2.9 ± 12.9 | ||
| Number of patients/year | ≤800 | 6.0 ± 14.2 | 0.537 |
| 801–1,200 | 6.4 ± 12.6 | ||
| >1,200 | 2.9 ± 14.0 | ||
| Number of senior physicians (FTE) | ≤1 | 7.6 ± 12.8 | 0.533 |
| >1 and ≤3 | 4.9 ± 13.2 | ||
| >3 | 5.6 ± 14.3 | ||
| Number of residents per day shift (FTE) | ≤1 | 5.5 ± 12.5 | 0.233 |
| >1 and ≤2 | 6.0 ± 14.8 | ||
| >2 | 4.1 ± 12.9 | ||
| Presence of dedicated resident during evening shift | Yes | 5.0 ± 13.5 | 0.410 |
| No | 5.7 ± 13.7 | ||
| Presence of dedicated resident during night shift | Yes | 5.6 ± 13.9 | 0.685 |
| No | 5.3 ± 13.4 | ||
| ICU affiliation | independent | 6.2 ± 13.1 | 0.133 |
| non independent | 3.8 ± 15.0 | ||
| SAPS II data acquisition method | semi-automatic/automatic by PDMS | 2.3 ± 18.8 | 0.459 |
| manual | 5.8 ± 13.1 | ||
| Presence of quality control | Yes | 6.3 ± 13.7 | 0.998 |
| No | 4.8 ± 14.1 | ||
| Presence of feed-back mechanism | Yes | 5.6 ± 14.3 | 0.360 |
| No | 9.6 ± 14.9 | ||
| a Log likelihood ratio test. FTE = full time equivalent; PDMS = patient data management system. | |||
| Table 4:Relationship between the scoring bias (scored vs. reference sum scores) and personal characteristics. | |||
| Characteristic | Categories | Bias | p-valuea |
| Gender | Female | 6.6 ± 14.2 | 0.206 |
| Male | 4.1 ± 12.6 | ||
| Age | ≤45 yrs | 5.3 ± 13.8 | 0.652 |
| 46–55 yrs | 5.2 ± 12.4 | ||
| ≥56 yrs | 8.8 ± 13.8 | ||
| Profession | Senior physician | 3.7 ± 10.8 | 0.328 |
| Resident physician | 4.7 ± 14.6 | ||
| RN with certificate for Critical care nursing | 8.0 ± 13.4 | ||
| Other | 6.4 ± 13.4 | ||
| Language | German | 4.0 ± 13.7 | 0.209 |
| French | 7.6 ± 13.0 | ||
| Italian | 7.7 ± 13.3 | ||
| Experience with SAPS II | ≤3 months | 2.8 ± 15.7 | 0.758 |
| >3, ≤12 months | 5.2 ± 13.8 | ||
| >12 months | 6.0 ± 12.4 | ||
| Frequency of SAPS II scoring | On a daily basis | 4.4 ± 12.6 | 0.720 |
| At least once per week | 6.0 ± 14.9 | ||
| Less than once per week | 5.8 ± 12.5 | ||
| a Log likelihood ratio test. RN = registered nurse. | |||
The main finding of this study was an overall overestimation of the SAPS II by ICU personnel. Theoretically, in terms of mortality prediction the change due to a bias of 5 points will depend on the actual score and on the composition of the analysed sample. In the very low range (SAPS II ≤20) and in the highest range of SAPS II (≥80), the impact of the bias will be minimal, whereas in the middle range (30–60 points) it will be definitely higher. Therefore, the relevance clearly depends on the spectrum of acute illness. In our study this generated an increase of the predicted mortality of 6.3%, which is, in our opinion, barely acceptable for benchmarking, but seems excessive for clinical research.
Since 2012, the SAPS II has become a component of the ICU specific codification (SwissDRG system) for severe patients who have a high resource use. For this purpose the score that is assessed at the end of the first 24 hours is added to the cumulative result of the NEMS score, which is an instrument to quantify nursing workload at the ICU level [23] and is computed (varying between 0 and 56 points) at the end of each eight-hour shift during the entire ICU stay. This type of codification is relevant for cost weight only above 500 points [9]. Thus, in terms of the current coding practices for SwissDRG, the bias may be considered as irrelevant. Nevertheless, more extensive use of the SAPS II cannot be recommended (e.g., integration of the everyday SAPS II score – without the GCS – as in the German G-DRG-System) [8].
The mean weighted kappa value was 0.47, which, based on the criteria proposed by experts, grades the reliability of SAPS II scoring among our participants as fair to moderate [17, 18]. In accordance with the existing knowledge, the less reliable variables were those that require calculations (oxygenation ratio and urinary output), judgement or implementation of some definition on the part of the rater (Glasgow Coma Scale) [24]. For instance, errors for diuresis were caused by miscalculation or by the neglected extrapolation of the total urinary output when patients were discharged from the ICU before the 24–hour deadline. The Glasgow coma scale,a well known source of error, produced most of the overestimation of the sum score as result of an incorrect assessment of the sedated patients with tracheal intubation [25–27].
Interestingly, the observed bias was independent of the participants’ personal characteristics and of the ICU’s structural or organisational features. Our results add to the findings of a retrospective multicentre audit about nurse-registered SAPS II performance [14].
Some variability is inherent to scoring, approximately 10–15%, as was shown for the APACHE II by testing the intra-individual variability [28]. Nevertheless, our data show that there is room for improvement, particularly when compared to a study conducted in nine Dutch ICUs, which showed a non-significant bias of 0.4 [12]. In those ICUs, the NICE registry was applied, which has implemented many procedures (e.g., data dictionary with clear definitions of items, mandatory training, automatic quality check, and automatic selection of variables by a computer algorithm) that are aimed at improving the quality of the data. Another study showed that the inter-observer variability in Acute Physiology and Chronic Health Evaluation (APACHE) II scoring decreased when strict guidelines and a training programme are implemented [29].
Likewise, the Swiss Society of Intensive Care Medicine might consider modifying the regulations for the units’ certification. They may include the requirement of a clear description of the local responsibility for the quality of the key process indicators, for example by assigning a single trained representative per ICU with the task of educating the ICU staff. New collaborators should receive a mandatory, specific introduction and should be provided with official manuals containing all SAPS II definitions. Furthermore, the frequency of training or case-based-discussions in the ICUs could be determined. Additionally, the quality of the collected data should be constantly verified, such as by mandatory and documented spot checks. Automatic retrieval of variables from a PDMS is feasible and may contribute to an increase in the scoring accuracy, depending on the applied validation procedures [12, 30]. In fact, this already happens in most larger hospitals. However, compared to manual acquisition of data, it introduces new problems due to higher sample frequency (e.g. blood pressure measurements), that have been shown to result in higher scores and a lower standardised mortality ratio, potentially biasing the comparison between hospitals with different practices [31].
This study has several limitations to be considered before its results are reflected on the daily clinical practice. First, the clinical scenarios were expressly created for the study and their number was limited to twenty, which was based on power analysis. The number of scoring difficulties inserted in the scenarios might differ from that of real clinical cases, therefore our results could be regarded more as experimental than of clinical relevance. Second, their mean SAPS II sum-score was 5 points higher than that observed in Switzerland in 2011, and they could not reproduce the real complexity of the Swiss ICU patient population. Third, the various characteristics of SAPS II items were not evenly distributed, which may result in additional selection bias. Therefore, we cannot exclude that other vignettes would have produced slightly different results. The use of mixed effect models, however, should at least partially account for this. Fourth, we assumed that everyone surveyed was skilled in retrieving some information from the charts, even if not expressly noted in the case description. However, some participants may have been better able to find the information needed if they had personally witnessed the sequence of events. Fifth, we could not verify if all participants are regularly involved in SAPS II scoring. In fact, one-quarter declared to deal with this task less than once a week and this might cause a wider inter-rater variability. Finally, 15 cases contained patient charts that were presented in a classical way, whereas 5 cases had a “digital” like layout. Only participants working in ICUs equipped with a PDMS were provided with a “digital” chart (accuracy was not different for this subgroup), but we cannot rule out that some participants struggled with unfamiliar graphic details.
We believe that the participation of 345 professionals (i.e. about one-third of all potential responders) from 53 different Swiss ICUs offers a reasonably good snapshot of the national practices because these results are representative for a vast proportion of the Swiss ICUs. However, the rather limited participation of the French-speaking region (only 16% of scorers; compared to 23% of the Swiss population) may interfere with drawing reliable conclusions for this specific part of the country.
In conclusion, this nationwide survey suggests that the accuracy of the SAPS II scores calculated by the ICU caring staff might only be moderate producing a significant bias.This was independent of the profession, experience of the caregivers, method used for data acquisition and structural characteristics of the ICUs. This fact might hamper the scores’ validity in terms of quality improvement, benchmarking and clinical research.A structured national programme reaching all involved professionals, including training sessions, official manuals and quality checks, should be contemplated by the Swiss Society of Intensive Care Medicine.
Acknowledgement: The authors are most grateful to the Swiss ICU heads and all other participants of the surveys. They would also like to express their special appreciation to Dr. Marianne Zumbrunn, Basel, for her contribution. Endorsement and financial support of this project by the Swiss Society of Intensive Care Medicine are recognised.
1 Moreno RP, Hochrieser H, Metnitz B, Bauer P, Metnitz PGH. Characterizing the risk profiles of intensive care units. Intensive Care Med. 2010;36(7):1207–12.
2 Minne L, Eslami S, de Keizer N, de Jonge E, de Rooij SE, Abu-Hanna A. Effect of changes over time in the performance of a customized SAPS-II model on the quality of care assessment. Intensive Care Med. 2011;38(1):40–6.
3 Vosylius S, Sipylaite J, Ivaskevicius J. Evaluation of intensive care unit performance in Lithuania using the SAPS II system. Eur J Anaesthesiol. 2004;21(8):619–24.
4 Le Gall JR, Lemeshow S, Saulnier F. A new Simplified Acute Physiology Score (SAPS II) based on a European/North American multicenter study. JAMA. 1993;270(24):2957–63.
5 SAPS II Calculator [Internet]. 2014. Available from: http://clincalc.com/IcuMortality/SAPSII.aspx
6 Metnitz PGH, Moreno RP, Almeida E, Jordan B, Bauer P, Campos RA, et al. SAPS 3 – From evaluation of the patient to evaluation of the intensive care unit. Part 1: Objectives, methods and cohort description. Intensive Care Med. 2005;31(10):1336–44.
7 Moreno RP, Metnitz PGH, Almeida E, Jordan B, Bauer P, Campos RA, et al. SAPS 3 – From evaluation of the patient to evaluation of the intensive care unit. Part 2: Development of a prognostic model for hospital mortality at ICU admission. Intensive Care Med. 2005;31(10):1345–55.
8 Deutsches Institut für Medizinische Dokumentation und Information, OPS Version 2014, Kapitel 8, Nichtoperative Therapeutische Massnahmen 8–98, 2014, Dokumentationsvorgaben zur Erfassung der Intensivmedizinischen Komplexbehandlung. Available from: http://www.dimdi.de/static/de/klassi/faq/ops/kapitel_8/ops-anleitung-intensivmedizin-8009.pdf
9 Klassifikationen BM. Schweizerische Operationsklassifikation (CHOP). Statistik BF, editor. 2013 Jul 31. Available from: http://www.bfs.admin.ch/bfs/portal/de/index/infothek/nomenklaturen/blank/blank/chop/02/05.html
10 Rothen HU, Kaufmann M. Ein wichtiges Instrument zur Qualitäts-sicherung in der Intensivmedizin. The Medical Journal. 2009;2:18–21.
11 Strand K, Strand LI, Flaatten H. The interrater reliability of SAPS II and SAPS 3. Intensive Care Med. 2010;36(5):850–3.
12 Arts D, de Keizer N, Scheffer G-J, de Jonge E. Quality of data collected for severity of illness scores in the Dutch National Intensive Care Evaluation (NICE) registry. Intensive Care Med. 2002;28(5):656–9.
13 Grønlykke L, Brandstrup SLR, Perner A. Data from clinical database on septic shock are valid. Dan Med J. 2012;59(10):A4522.
14 Perren A, Previsdomini M, Perren I, Merlani P. Critical Care Nurses Inadequately Assess SAPS II Scores of Very Ill Patients in Real Life. Crit Care Res Pract. 2012;2012:919106.
15 Strand K, Søreide E, Aardal S, Flaatten H. A comparison of SAPS II and SAPS 3 in a Norwegian intensive care unit population. Acta Anaesthesiol Scand. 2009;53(5):595–600.
16 Walter SD, Eliasziw M, Donner A. Sample size and optimal designs for reliability studies. Stat Med. 1998;17(1):101–10.
17 Landis JR, Koch GG. An application of hierarchical kappa-type statistics in the assessment of majority agreement among multiple observers. Biometrics. 1977;33(2):363–74.
18 Fleiss JL. Measuring nominal scale agreement among many raters. Psychological Bulletin. 1971;76(5):378–82.
19 Shrout PE, Fleiss JL. Intraclass correlations: uses in assessing rater reliability. Psychol Bull. 1979;86(2):420–8.
20 McGraw KO, Wong SP. Forming inferences about some intraclass correlation coefficients. Psychological Methods. American Psychological Association; 1996;1(1):30–46.
21 Altman DG, Bland JM. Measurement in Medicine: the Analysis of Method Comparison Studies. The statistician. 1983;32:307–17.
22 Anerkannte Intensivstationen. 2013 Oct 23. Available from: http://www.sgi-ssmi.ch/index.php/liste-der-anerkannten-is.html
23 Miranda DR, Moreno R, Iapichino G. Nine equivalents of nursing manpower use score (NEMS). Intensive Care Med. 1997;23(7):760–5.
24 Arts DGT, de Keizer NF, Vroom MB, de Jonge E. Reliability and accuracy of Sequential Organ Failure Assessment (SOFA) scoring. Crit Care Med. 2005;33(9):1988–93.
25 Chen LM, Martin CM, Morrison TL, Sibbald WJ. Interobserver variability in data collection of the APACHE II score in teaching and community hospitals. Crit Care Med. 1999;27(9):1999–2004.
26 Holt AW, Bury LK, Bersten AD, Skowronski GA, Vedig AE. Prospective evaluation of residents and nurses as severity score data collectors. Crit Care Med. 1992;20(12):1688–91.
27 Goldhill DR, Sumner A. APACHE II, data accuracy and outcome prediction. Anaesthesia. 1998;53(10):937–43.
28 Polderman KH, Christiaans HM, Wester JP, Spijkstra JJ, Girbes AR. Intra-observer variability in APACHE II scoring. Intensive Care Med. 2001;27(9):1550–2.
29 Polderman KH, Jorna EM, Girbes AR. Inter-observer variability in APACHE II scoring: effect of strict guidelines and training. Intensive Care Med. 2001;27(8):1365–9.
30 Bosman RJ, Oudemane van Straaten HM, Zandstra DF. The use of intensive care information systems alters outcome prediction. Intensive Care Med. 1998;24(9):953–8.
31 Suistomaa M, Kari A, Ruokonen E, Takala J. Sampling rate causes bias in APACHE II and SAPS II scores. Intensive Care Med. 2000;26(12):1773–8.
Funding / potential competing interests: This study was supported by a grant from the Research Fund of the Swiss Society of Intensive Care Medicine.